World Wheat. Source: US Wheat Associates
|
|
|
- Hollie Owens
- 5 years ago
- Views:
Transcription

1 Grain Outlook 2017

2 2

3 Wheat 3

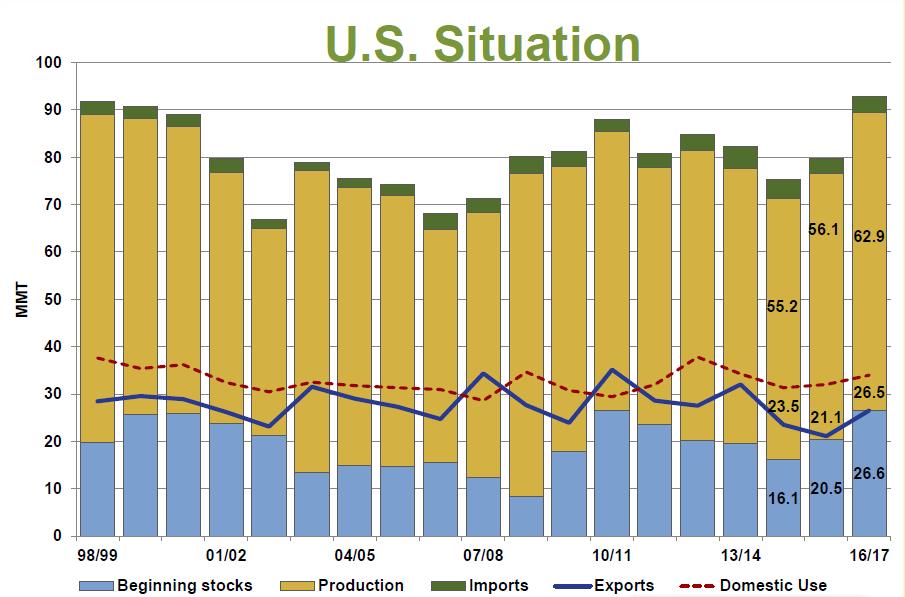
4 World Wheat Source: US Wheat Associates 4

5 World Wheat Source: US Wheat Associates 5

6 Source: US Wheat Associates 6

7 Source: US Wheat Associates 7

8 Source: US Wheat Associates 8

9 Source: US Wheat Associates 9

10 Source: US Wheat Associates 10
11 11

12 12

13 13

14 14

15 15

16 16

17 17
18

19 19
20 U.S. HARD RED SPRING SUPPLY & DEMAND Million Bushels/acres Proj Change Planted Area % Beg Stocks % Production % Imports % Tot Supply % Dom Use % Exports % Tot Use % End Stocks % S/U Ratio 30% 37% 49% 35% Source: USDA November 2016 Xldata/HRS/S&D Erica Olson, Marketing Specialist N.D. Wheat Commission 20
21 Wheat [f] [f] Area seeded (kha) 7,869 7,445 6,915 Area harvested (kha) 7,594 7,250 6,511 Yield Production (kt) 24,227 22,205 23,967 Imports (b) Total supply (kt) 32,973 28,398 28,127 Exports (kt) [c] 18,780 17,179 16,700 Food & Industrial Use (kt) [d] Feed, Waste & Dockage (kt) Total Domestic Use (kt) [e] 3,345 3,238 3,450 3,984 3,187 3,725 8,094 7,149 7,927 Carry-out Stocks (kt) 6,098 4,070 3,500 Average Price ($/t) [g]
22 Canada: Wheat Production (thousand tonnes) Winter * 2,243 3,513 Eastern Hard Red Spring Western Hard Red Spring 16,868 16,670 Canada Prairie Spring 1,346 1,720 Extra Strong Soft White Spring Other spring Total 22,205 23,967 Source: Statistics Canada * hard red winter, soft red winter and soft white winter 22
23 Minneapolis Hard Red Spring Wheat Futures March 2017 Have we formed bottom for spring? 23
24 January Outlook for Winter Pools G3 PRO (per tonne) In store Vancouver or Thunder Bay Winter Pool Wheat 26-Jan 22-Dec 1 CWRS CWRS CWRS CWRS CWRS CWRS CWRS CWRS CWRS CWRS CWRS CWRS CWRS CWRS CWRS CWRS CWRS CWRS

25 Durum Wheat 25

26 26
27 World Durum World durum production increased by 0.6 Mt from to 39.7 Mt. Supply rose by 2.8 Mt to 48.4 Mt because of higher carry-in stocks. Use is forecast to rise by 1 Mt to 37.8 Mt while carry-out stocks increase by 1.9 Mt to 10.6 Mt. US durum production rose by 0.54 Mt to 2.83 Mt. 27
28 2016 U.S. Durum Production and Quality U.S. acreage was up 23% to reach 2.4 million acres Acreage higher in N. durum region, but down in Desert Durum areas of AZ and CA Growing conditions were variable with some areas dry, some too wet Overall yields were strong at 44 bushels/acre same as 2015 Production is the highest in 6 years at 104 million bushels Disease pressure was an issue in northern areas, causing elevated DON levels in northern areas. Lower vitreous kernel counts in areas as well. First half of harvest saw no issues, second half of harvest struggled. Lower protein than last year, higher extractions, reduced pasta color scores and lower cooked firmness Erica Olson, Marketing Specialist N.D. Wheat Commission 28
29 U.S. Durum Wheat Plantings & Production Million Acres 4 Planted Harvested Production Million Bushels Source: USDA Small Grains Summary Xldata/durum/acres Erica Olson, Marketing Specialist N.D. Wheat Commission 29
30 U.S. Durum Wheat Production By State Million Bushels North Dakota Montana AZ & CA Source: USDA Small Grains Summary 30
31 U.S. DURUM SUPPLY & DEMAND Million Bushels Proj Change Beg Stocks % Production % Imports % Tot Supply % Dom Use % Exports % Tot Use % End Stocks % S/U Ratio 19% 21% 26% 25% 49% Source: USDA November 2016 Xldata/durum/S&D Erica Olson, Marketing Specialist N.D. Wheat Commission 31
32 Durum Stocks in Major Countries U.S., Canada, European Union June Million Tons U.S. Canada EU Proj Source: Int l Grains Council October
33 Canadian Durum For , Canadian production rose by 44% to a record of 7.8 million tonnes (Mt) as the 6% increase in seeded area was compounded by a 41% rise in yields from the drought reduced level of The average yields are a record. The average grade quality of the durum crop is lower than for and the past five-year average because of too much rain. The average protein content is lower than for but is at the average of the past five years. 33
34 Canadian Durum Wheat [f] [f] Area seeded (kha) 1,922 2,355 2,505 Area harvested (kha) 1,886 2,327 2,367 Yield (t/ha) Production (kt) 5,193 5,389 7,762 Imports (kt) [b] Total supply (kt) 6,940 6,358 8,873 Exports (kt) [c] 5,177 4,541 4,700 Food & Industrial Use (kt) [d] Feed, Waste & Dockage (kt) ,268 Total Domestic Use (kt) [e] ,673 Carry-out Stocks (kt) 956 1,101 2,500 Average Price ($/t) [g] Source: Ag Canada & Stats Can 34
35 Canadian Durum Supply increased by 40%. Exports increase by 4% because of higher Canadian supply and lower production in Morocco, Algeria and Turkey. The delayed harvest and the lower average quality of expected to limit the increase in exports due to quality. Carry-out stocks are forecast to more than double to 2.5 Mt which is 95% higher than the past five-year average of 1.28 Mt. Carry-out stocks are expected to be mostly lower grade durum. 35
36 Canadian Durum Price The average Canadian producer price for the crop year is forecast to be lower than for due to the higher Canadian, US and world supply. The price discount for lower grades of durum, relative to the base grade No. 1 CWAD 13% protein, has increased because of a limited supply of high grade durum. 36
37 January Outlook for Winter Pools Durum 1 CWAD CWAD CWAD CWAD CWAD CWAD CWAD CWAD CWAD CWAD CWAD
38 REVENUE PER ACRE SOIL ZONE CROP PRODUCTION COSTS ($/ACRE) 2017 Black Bark Brown Brown Spring CPS Winter Spring Durum CPS Winter Spring Durum CPS Winter Wheat Wheat Wheat Wheat Wheat Wheat Wheat Wheat Wheat Wheat Wheat Estimated Yield (bu./ac.,lb./ac.) Estimated On Farm Market Price/bu.,lb Estimated Gross Revenue/ac EXPENSES PER ACRE Variable Expenses/acre Seed Fertilizer Chemical - Herbicides Insecticides/Fungicides Seed Treatments/Inoculants Machinery Operating - Fuel Repair Custom Work and Hired Labour Crop Insurance Premium Utilities and Miscellaneous Interest on Variable Expenses Total Variable Expenses Building Rep./Prop.Tax/Bus O.H Living Expense Debt Payment Per Acre Total Expenses RETURNS PER ACRE* Return over Total Expenses
39 SOIL ZONE CROP PRODUCTION COSTS ($/ACRE) 2017 Black Bark Brown Brown Spring CPS Winter Spring Durum CPS Winter Spring Durum CPS Winter Wheat Wheat Wheat Wheat Wheat Wheat Wheat Wheat Wheat Wheat Wheat BREAK-EVEN YIELD PER ACRE To Cover Variable Expenses To Cover Total Expenses BREAK-EVEN PRICE PER BU./LB. To Cover Variable Expenses To Cover Total Expenses

40 Soybeans 40

41 World Soybean Production (mmt)
42 Brazil Soybean Production (mmt)

43 43
44 44

45 45
46 46
47 47
48 48

49 49
50 March
51 Canadian Soybeans Looking forward, the main factors to watch are: the US crush and export pace, Canadian commercial and export demand for soybeans, South American planting conditions and the strength of Chinese buying. 51
52 Black D. Brown Brown Soybean Soybean Soybean REVENUE PER ACRE Estimated Yield (bu./ac.,lb./ac.) Estimated On Farm Market Price/bu.,lb Estimated Gross Revenue/ac EXPENSES PER ACRE Variable Expenses/acre Seed Fertilizer Chemical - Herbicides Insecticides/Fungicides Seed Treatments/Inoculants Machinery Operating - Fuel Repair Custom Work and Hired Labour Crop Insurance Premium Utilities and Miscellaneous Interest on Variable Expenses Total Variable Expenses Other Expenses/acre Building Rep./Prop.Tax/Bus Overhead Living Expense Debt Payment Per Acre Total Expenses RETURNS PER ACRE* Return over Variable Expenses Return over Total Expenses
53 Black D. Brown Brown Soybean Soybean Soybean RETURNS PER ACRE* Return over Variable Expenses Return over Total Expenses BREAK-EVEN YIELD PER ACRE To Cover Variable Expenses To Cover Total Expenses BREAK-EVEN PRICE PER BU./LB. To Cover Variable Expenses To Cover Total Expenses

54 Canola 54
55 Global Canola Production (mmt) / / / / / / / / / / / / / /17 Source: USDA 55
56 Global Canola Ending Stocks (mmt) Source: USDA 56
57 Canola Production by County (tmt) Meal Oil, Canola Seed Production 2014/ / / / / / / / /17 China 10,890 11,009 9,998 7,137 7,215 6,552 14,772 14,931 13,500 India 2,507 2,985 3,403 1,596 1,900 2,166 5,080 5,920 6,800 Canada 4,150 4,665 4,680 3,230 3,625 3,635 16,410 18,377 18,500 Japan 1,392 1,360 1,360 1,074 1,060 1, EU 14,458 13,862 13,281 10,603 10,166 9,739 24,587 22,199 20,000 Other 5,731 5,332 5,330 3,992 3,748 3,735 10,602 8,810 8,961 World Total 39,128 39,213 38,052 27,632 27,714 26,902 71,454 70,240 67,764 Source: USDA 57
58 Canola Imports by Country (tmt) Meal Oil, Canola Seed Imports 2014/ / / / / / / / /17 China ,591 4,011 3,800 India Canada Japan ,489 2,387 2,450 EU ,317 3,494 3,500 Other 5,405 4,975 5,034 2,528 2,742 2,742 4,873 4,238 4,385 World 6,034 5,772 5,576 3,956 4,119 4,195 14,358 14,234 14,235 Source: USDA 58
59 Canola Exports (tmt) Meal Oil, Canola Seed Exports 2014/ / / / / / / / /17 China India Canada 3,638 4,035 4,075 2,409 2,766 2,880 9,216 10,278 9,700 Japan EU Other ,295 1, ,268 4,058 3,982 World Totals 5,854 5,588 5,560 4,069 4,139 4,111 15,072 14,686 14,082 Source: USDA 59
60 Canola Consumption & Ending Stocks Domestic Consumption 2014/ / /17 China 18,900 19,100 17,400 India 5,150 5,950 6,700 Canada 7,737 8,729 8,739 Japan 2,478 2,419 2,455 EU 26,315 25,220 24,200 Other 10,175 9,157 9,415 World 70,755 70,575 68,909 Ending Stocks China 1,499 1,340 1,240 India Canada 2,542 2,016 2,177 Japan EU 1,891 2, Other World 7,327 6,540 5,548 Source: USDA 60
61 European Canola Supply & Demand Meal Oil, Canola Seed 2014/ / / / / / / / /17 Production 14,458 13,862 13,281 10,603 10,166 9,739 24,587 22,199 20,000 Imports ,317 3,494 3,500 Exports Consumption 14,450 13,850 13,200 10,495 10,100 9,900 26,315 25,220 24,200 Ending Stocks ,891 2, Source: USDA 61
62 Canadian Canola Supply & Demand (tmt) Meal Oil, Canola Seed 2014/ / / / / / / / /17 Production 4,150 4,665 4,680 3,230 3,625 3,635 16,410 18,377 18,500 Imports Exports 3,638 4,035 4,075 2,409 2,766 2,880 9,216 10,278 9,700 Consumption ,737 8,729 8,739 Ending Stocks ,542 2,016 2,177 Source: USDA 62
63 Canola March 2017 Factors: US Soybean Sales/Brazil Bean Crop CDN Canola Sales Dryness in Midwest Will China Continue to Buy US beans? 63

64 March 2017 Quadrant # 1 Quadrant # 2 Quadrant # 3 Quadrant # 4 64
65 Canola Sales Months
66 Black D. Brown Brown Canola Canola Canola REVENUE PER ACRE Estimated Yield (bu./ac.,lb./ac.) Estimated On Farm Market Price/bu.,lb Estimated Gross Revenue/ac EXPENSES PER ACRE Variable Expenses/acre Seed Fertilizer Chemical - Herbicides Insecticides/Fungicides Seed Treatments/Inoculants Machinery Operating - Fuel Repair Custom Work and Hired Labour Crop Insurance Premium Utilities and Miscellaneous Interest on Variable Expenses Total Variable Expenses Other Expenses/acre Build. Rep./Prop.Tax/Bus Overhead Living Expense Debt Payment Per Acre Total Expenses RETURNS PER ACRE* Return over Variable Expenses Return over Total Expenses
67 Black D. Brown Brown Canola Canola Canola RETURNS PER ACRE* Return over Variable Expenses Return over Total Expenses BREAK-EVEN YIELD PER ACRE To Cover Variable Expenses To Cover Total Expenses BREAK-EVEN PRICE PER BU./LB. To Cover Variable Expenses To Cover Total Expenses

68 Peas 68
69 Peas Acres 5,000,000 4,500,000 4,000,000 3,730,000 3,985,000 3,680,000 4,239,000 4,460,000 3,500,000 3,325,000 3,000,000 2,500,000 2,000,000 1,500,000 1,000, , Forecasts by STAT Market Research based on data from Statistics Canada. 69
70 Peas Production & Yield 6,000,000 3,000 5,000,000 2,626 2,515 2,500 4,000,000 1,975 2,108 1,917 2,266 2,000 3,000,000 1,500 2,000,000 1,000 1,000, Production Yield (lbs) Forecasts by STAT Market Research based on data from Statistics Canada. 0 70
71 Pea Exports Disappearance Europe 117,356 79,132 31,559 11,326 70,000 79,000 South America 66,463 78,769 59,854 53,497 91,000 90,000 N/C America 159, , , , , ,000 Pacific Rim 2,253,039 2,241,978 2,677,204 2,369,809 2,722,000 2,360,000 Arab/Africa 56, ,129 64,519 37,998 89,000 97,000 Export 2,653,173 2,783,749 3,085,758 2,651,881 3,234,000 2,910,000 Forecasts by STAT Market Research based on data from Statistics Canada. 71

72 Peas Ending Stocks & Stocks to Use 1,600, % 1,400, % 35.00% 1,200, % 1,000, % 800, , % 17.50% 20.00% 15.00% 400, % 10.00% 200, % 4.70% 5.00% % Ending Stock Stocks/Use Forecasts by STAT Market Research based on data from Statistics Canada. 72
73 Canadian Supply and Demand Estimate for Peas 2016/2017 Yellow Green Other All Peas Area (acres) 3,700, ,000 20,000 4,239,000 Yield (lbs/acre) 2,484 2,647 4,839 2,515 Production 4,168, ,100 43,900 4,835,900 Carry-In 115,000 60,000 1, ,000 Imports 13,700 13,200 1,100 28,000 Supply 4,297, ,300 46,000 5,039,900 Exports 2,817, ,800 29,500 3,234,000 Seed 266,000 43,000 5, ,000 Feed, Waste, and 551, ,500 10, ,900 Other Total Usage 3,635, ,300 45,000 4,289,900 Ending Stocks 662,000 87,000 1, ,000 Stocks/Use 18% 14% 2% 17% *All quantities in tonnes Source: STAT Publishing Ltd. 73
74 Canadian Supply and Demand Estimate for Peas 2017/2018 Yellow Green Other All Peas Area (acres) 3,784, ,300 67,900 4,460,000 Yield (lbs/acre) 2,269 2,206 2,642 2,266 Production 3,895, ,800 81,400 4,585,000 Carry-In 662,000 87,000 1, ,000 Imports 13,700 13,100 1,200 28,000 Supply 4,571, ,900 83,600 5,363,000 Exports 2,480, ,100 45,400 2,910,000 Seed 252,000 40,000 5, ,000 Feed, Waste, and Other 639,000 93,800 23, ,000 Total Usage 3,371, ,900 73,600 3,963,000 Ending Stocks 1,200, ,000 10,000 1,400,000 Stocks/Use 36% 37% 14% 35% *All quantities in tonnes Source: STAT Publishing Ltd. 74
75
76 Delivered THIS LAST LAST Plant Prices WEEK WEEK MONTH FIELD PEAS Canada Green Peas CDN$ bu Sask Canada Large Yellow Peas CDN$ bu Sask Canada Small Yellow Peas CDN$ bu Sask Canada Feed peas CDN$ bu Sask Alberta Feed Peas CDN$ MT Canada Maple Peas CDN$ bu Sask Marrowfat Peas CDN$ bu Sask Forecasts by STAT Market Research based on data from Statistics Canada. 76
77 Black D. Brown Brown Edible Edible Edible Edible Edible Edible Yellow Green Yellow Green Yellow Green Pea Pea Peas Peas Peas Peas REVENUE PER ACRE Estimated Yield (bu./ac.,lb./ac.) Estimated On Farm Market Price/bu.,lb Estimated Gross Revenue/ac EXPENSES PER ACRE Variable Expenses/acre Seed Fertilizer Chemical - Herbicides Insecticides/Fungicides Seed Treatments/Inoculants Machinery Operating - Fuel Repair Custom Work and Hired Labour Crop Insurance Premium Utilities and Miscellaneous Interest on Variable Expenses Total Variable Expenses Other Expenses/acre Building Rep./Prop.Tax/Bus Overhead Living Expense Debt Payment Per Acre Total Expenses RETURNS PER ACRE* Return over Variable Expenses Return over Total Expenses
78 Black D. Brown Brown Edible Edible Edible Edible Edible Edible Yellow Green Yellow Green Yellow Green Pea Pea Peas Peas Peas Peas RETURNS PER ACRE* Return over Variable Expenses Return over Total Expenses BREAK-EVEN YIELD PER ACRE To Cover Variable Expenses To Cover Total Expenses BREAK-EVEN PRICE PER BU./LB. To Cover Variable Expenses To Cover Total Expenses

79 Barley 79

80 World Barley Production (mmt) Production Total supply 3/ 80

81 World Barley Ending Stocks
82 World Barley Production by Country (mmt)
83 Canadian Barley For , production is forecast to increase 7% to 8.8 Mt, despite lower harvested area, due to the record average yield. Higher carry-in stocks, along with the production increase, will allow total supply to increase by 8% to 10.3 million tonnes (Mt). Total domestic use is forecast to increase by 5% due to higher feed use in cattle and hog production. Exports are forecast to decrease slightly due to lower world demand for feed barley demand. However, the malt barley trade remains nearly unchanged. 83
84 Canadian Barley Barley carry-out stocks are forecast to increase significantly to 2.0 Mt which is much higher than the previous 10-year average. The Lethbridge cash feed barley price is forecast to decrease from due to the higher supplies, lower US corn prices and more domestic competition with other feed grain substitutes. 84
85 Canadian Barley [f] [f] Area seeded (kha) 2,380 2,641 2,586 Area harvested (kha) 2,136 2,354 2,223 Yield (t/ha) Production (kt) 7,119 8,226 8,784 Imports (kt) [b] Total supply (kt) 9,205 9,577 10,301 Exports (kt) [c] 2,463 2,014 1,900 Food & Industrial Use (kt) [d] Feed, Waste & Dockage (kt) 5,112 5,735 6,002 Total Domestic Use (kt) [e] 5,525 6,120 6,401 Carry-out Stocks (kt) 1,217 1,443 2,000 Average Price ($/t) [g]
86 Canadian Barley Saskatchewan continues to close the gap on Alberta in terms of total barley production. In Saskatchewan, production was 18% higher than last year and nearly 28% higher than the previous five-year average. Alberta's production was 3% above last year but it was about 5% below the previous 3, 5 and 10-year averages. Similar to last crop year, barley production and quality were better-than expected given the difficult harvest conditions during the fall in the western half of the prairies. 86
87 Lethbridge Barley Price Source: Canfax 87
88 SOIL ZONE CROP PRODUCTION COSTS ($/ACRE) 2017 Black Soil zone Dark Brown Soil Zone Brown Soil Zone Malt Feed Malt Feed Malt Feed Barley Barley Barley Barley Barley Barley REVENUE PER ACRE Estimated Yield (bu./ac.,lb./ac.) Estimated On Farm Market Price/bu.,lb Estimated Gross Revenue/ac EXPENSES PER ACRE Variable Expenses/acre Seed Fertilizer Chemical - Herbicides Insecticides/Fungicides Seed Treatments/Inoculants Machinery Operating - Fuel Repair Custom Work and Hired Labour Crop Insurance Premium Utilities and Miscellaneous Interest on Variable Expenses Total Variable Expenses Build. Rep./Prop.Tax/Bus Overhead Living Expense Debt Payment Per Acre Total Expenses RETURNS PER ACRE* Return over Variable Expenses Return over Total Expenses
89 RETURNS PER ACRE* Malt Feed Malt Feed Malt Feed Barley Barley Barley Barley Barley Barley Return over Variable Expenses Return over Total Expenses BREAK-EVEN YIELD PER ACRE To Cover Variable Expenses To Cover Total Expenses BREAK-EVEN PRICE PER BU./LB. To Cover Variable Expenses To Cover Total Expenses

90 Oats 90
91 Canadian Oat Production [f] [f] Area seeded (kha) 1,132 1,350 1,147 Area harvested (kha) 912 1, Yield (t/ha) Production (kt) 2,979 3,428 3,147 Imports (kt) [b] Total supply (kt) 4,052 4,118 4,095 Exports (kt) [c] 2,329 2,228 2,475 Food & Industrial Use (kt) [d] Feed, Waste & Dockage (kt) Total Domestic Use (kt) [e] 1, Carry-out Stocks (kt) Average Price ($/t) [g]
92 Canadian Oats For , production is forecast to decrease by 8% due to the smaller seeded and harvested areas, despite a record average oat yield. Due to high carry-in stocks, total supply is forecast to decrease by only 1%. Total domestic use is forecast to increase by 1% due to trend feed use and human consumption. Canadian exports are forecast to increase by 11% due to lower 2016 US oat production and trend increases in milling demand. Carry-out stocks are forecast to decrease 30% to 0.7 Mt due to the lower supply and higher total disappearance. 92
93 Canadian Oats The oat yield in Canada was a record 3.52 t/ha versus the previous record of 3.51 t/ha registered in In Western Canada yield second highest yield on record. In 2016, Alberta produced its largest oat crop in five years as it was 59% larger than harvested in 2015 and 22% higher than the previous three-year average. Total oat production in W.C seeded area and production were 23% and 8%, respectively, below the previous 10-year average. Oat yields in Eastern Canada were mixed with the overall yield just below last year. 93
94 Oats Futures 94
95 Canadian Oats The market is expected to increase its focus on the set of USDA reports being released in early January; US final oat production and stocks will be the key factors for price direction for the rest of the winter. If the oat market is able to hold some of these gains, it will help provide an incentive for increased oat area for 2017 in Canada and the US. 95
96 Black D Brown Brown Oats Oats Oats REVENUE PER ACRE Estimated Yield (bu./ac.,lb./ac.) Estimated On Farm Market Price/bu.,lb Estimated Gross Revenue/ac EXPENSES PER ACRE Variable Expenses/acre Seed Fertilizer Chemical - Herbicides Insecticides/Fungicides Seed Treatments/Inoculants Machinery Operating - Fuel Repair Custom Work and Hired Labour Crop Insurance Premium Utilities and Miscellaneous Interest on Variable Expenses Total Variable Expenses Other Expenses/acre Build. Rep./Prop.Tax/Bus Overhead Living Expense Debt Payment Per Acre Total Expenses RETURNS PER ACRE* Return over Variable Expenses Return over Total Expenses
97 Black D Brown Brown Oats Oats Oats RETURNS PER ACRE* Return over Variable Expenses Return over Total Expenses BREAK-EVEN YIELD PER ACRE To Cover Variable Expenses To Cover Total Expenses BREAK-EVEN PRICE PER BU./LB. To Cover Variable Expenses To Cover Total Expenses

98 Flax 98
99 World Flax For , world crushing of flaxseed is forecast to rise slightly to 2.3 Mt from 2.2 Mt last year and 2.1 Mt in China is the world's largest processor of flaxseed, crushing 0.7 Mt yearly, followed closely by the EU-28 at 0.69 Mt. The US is well back in third place, processing 0.28 Mt of flaxseed yearly. The three major exporters of flaxseed are Canada, Russia and Kazakhstan at 0.59 Mt, 0.50 Mt and 0.30 Mt, respectively. Exports from Russia and Kazakhstan mostly go to the EU-28 and Canadian exports into China. Total world exports are estimated at 1.53 Mt for , down slightly from 1.59 Mt in buy up from the 1.38 Mt shipped in The major importers of flaxseed are the EU-28, 0.76 Mt, China, 0.44 Mt, Turkey 0.15 Mt and the USA 0.11 Mt. 99
100 World Linseed World production of linseed (flax) meal is forecast at 1.4 Mt, of which 31,000 t will be exported. China and the EU-28 are the world's largest consumers of flaxseed meal at 0.47 Mt and 0.43 Mt. World production of linseed oil is expected to rise slightly to 0.75 Mt versus 0.72 Mt for China and the EU-28 are the world's largest consumers of linseed oil at 0.24 Mt and 0.18 Mt, respectively. 100
101 Canadian Flax [f] [f] Area seeded (kha) Area harvested (kha) Yield (t/ha) Production (kt) Imports (kt) [b] Total supply (kt) 975 1, Exports (kt) [c] Food & Industrial Use (kt) [d] Feed, Waste & Dockage (kt) Total Domestic Use (kt) [e] Carry-out Stocks (kt) Average Price ($/t) [g]
102 Canadian Flax For , the production estimated at 0.58 Mt based on a harvested area of 0.34 mln ha. This is a sharp decrease from last year when Canada grew 0.94 Mt of flaxseed from a harvested area of 0.65 mln ha. Supplies of flaxseed are estimated down by 18% from to 0.86 Mt, on the sharp drop in output which was partly moderated by higher carry-in of stocks. Exports are forecast to remain relatively stable at 0.6 Mt, despite lower supplies in Canada and competition from burdensome world oilseed and vegetable oil supplies. Total domestic use is expected to decline sharply on a significant drop in feed, waste and dockage. 102
103 Canadian Flax Carry-out stocks are forecast to tighten to 0.2 Mt but remain above the five-year average. Average prices are expected to decline slightly from to a range of $415 to 445/t. Large world vegetable oil stocks, expected steady Kazakhstan and Russian linseed production and uncertain export buying are considered the major factors pressuring Canadian flaxseed prices. World production of flaxseed (linseed) is forecast by Oil World to decrease to 2.5 Mt from 2.8 Mt in Most of the decline occurred in Canada, with US and Indian production also down slightly. Output in Russia and Kazakhstan increased to 0.55 Mt and 0.40 Mt, respectively. The decline in world output is due to a drop in harvested area, to 2.75 mln ha for from 3.00 mln ha the previous year. Worldwide, yields also declined slightly, to 0.92 t/ha vs 0.95 Mt for
104 Black D. Brown Brown Flax Flax Flax REVENUE PER ACRE Estimated Yield (bu./ac.,lb./ac.) Estimated On Farm Market Price/bu.,lb Estimated Gross Revenue/ac EXPENSES PER ACRE Variable Expenses/acre Seed Fertilizer Chemical - Herbicides Insecticides/Fungicides Seed Treatments/Inoculants Machinery Operating - Fuel Repair Custom Work and Hired Labour Crop Insurance Premium Utilities and Miscellaneous Interest on Variable Expenses Total Variable Expenses Other Expenses/acre Build. Rep./Prop.Tax/Bus Overhead Living Expense Debt Payment Per Acre Total Expenses RETURNS PER ACRE* Return over Variable Expenses Return over Total Expenses
105 Black D. Brown Brown Flax Flax Flax RETURNS PER ACRE* Return over Variable Expenses Return over Total Expenses BREAK-EVEN YIELD PER ACRE To Cover Variable Expenses To Cover Total Expenses BREAK-EVEN PRICE PER BU./LB. To Cover Variable Expenses To Cover Total Expenses

106 Lentils 106
107 Lentil Acres 7,000,000 6,000,000 5,860,000 5,590,000 5,000,000 4,000,000 4,035,000 3,000,000 2,515,000 2,720,000 3,120,000 2,000,000 1,000, Forecasts by STAT Market Research based on data from Statistics Canada. 107
108 Lentil Production & Yield 2,000 1,800 1,600 1,400 1,200 1, Production Yield ( lbs) 4,000,000 3,500,000 3,000,000 2,500,000 2,000,000 1,500,000 1,000, ,000 0 Forecasts by STAT Market Research based on data from Statistics Canada. 108
109 Lentils Ending Stocks & Stocks to Use Ratio 900, , , % 45.00% 40.00% 35.00% 600, , % 26.60% 30.00% 24.20% 25.00% 400, % 300, % 15.00% 200, % 100, % Ending Stock Stock/Use 5.00% 0.00% Forecasts by STAT Market Research based on data from Statistics Canada. 109
110 Canadian Supply and Demand Estimate for Lentils in 2016/17 Large Green Medium Green Small Green Extra Small Red Area (acres) 1,100,000 35, , ,000 Yield (lbs/acre) 1,078 1,178 1,475 1,203 Production 537,900 18, ,100 60,000 Carry-In 13,000 2,000 12,000 1,400 Supply 550,900 20, ,100 61,400 Exports 391, ,100 37,200 Seed 46,900 2,300 8,000 1,800 Feed, Waste, and 62,500 2,500 24,000 7,400 Other Total Usage 500,900 17, ,100 46,400 Ending Stocks 50,000 3,000 50,000 15,000 Stocks/Use 10% 17% 30% 32% *All quantities in tonnes Source: STAT Publishing Ltd. 110
111 Canadian Supply and Demand Estimate for Lentils in 2016/17 Small Red All Red Other All Area (acres) 4,295,000 4,405,000 15,000 5,860,000 Yield (lbs/acre) 1,244 1, ,222 Production 2,423,500 2,483,500 4,000 3,248,200 Carry-In 43,600 45,000 1,000 73,000 Supply 2,467,100 2,528,500 5,000 3,321,200 Exports 1,480,200 1,517,400 3,100 2,059,000 Seed 124, , ,800 Feed, Waste, and 281, , ,400 Other Total Usage 1,886,100 1,932,500 4,000 2,621,200 Ending Stocks 581, ,000 1, ,000 Stocks/Use 31% 31% 25% 27% *All quantities in tonnes Source: STAT Publishing Ltd. 111
112 Canadian Supply and Demand Estimate for Lentils in 2017/18 Large Green Medium Green Small Green Extra Small Red Area (acres) 1,150,000 72, ,000 80,000 Yield (lbs/acre) 1,309 1,347 1,439 1,323 Production 683,000 44, ,000 48,000 Carry-In 50,000 3,000 50,000 15,000 Supply 733,000 47, ,000 63,000 Exports 499,300 32, ,400 42,900 Seed 40,000 1,600 6,800 7,100 Feed, Waste, and 63,700 4,400 22,800 6,000 Other Total Usage 603,000 38, ,000 56,000 Ending Stocks 130,000 9,000 60, Stocks/Use 22% 24% 27% 13% *All quantities in tonnes Source: STAT Publishing Ltd. 112
113 Canadian Supply and Demand Estimate for Lentils in 2017/18 Small Red All Red Other All Area (acres) 3,917,000 3,997,000 17,000 5,590,000 Yield (lbs/acre) 1,340 1, ,339 Production 2,381,000 2,429,000 7,000 3,394,000 Carry-In 581, ,000 1, ,000 Supply 2,962,000 3,025,000 8,000 4,094,000 Exports 2,017,800 2,060,700 5,400 2,788,800 Seed 90,000 97, ,800 Feed, Waste, and 261, ,200 1, ,200 Other Total Usage 2,369,000 2,425,000 7,000 3,294,000 Ending Stocks 593, ,000 1, ,000 Stocks/Use 25% 25% 14% 24% *All quantities in tonnes Source: STAT Publishing Ltd. 113
114

115
116
117
118 Weekly Grower Closing Prices -- Specialty Grains (farmers dressed bulk delivered processing plants) Delivered THIS LAST LAST Plant Prices WEEK WEEK MONTH LENTILS Laird Lentils No Cdn$/cwt Canada No Extra No Richlea Lentils No Cdn$/cwt Canada No Extra No Eston Lentils No Cdn$/cwt Canada No Extra No Red Lentils No Cdn$/cwt Canada No Extra No French Lentils No Cdn$/cwt Canada No Extra No Forecasts by STAT Market Research based on data from Statistics Canada.
119 Black D. Brown Brown Large Green Red Large Green Red Large Green Red Lentil Lentil Lentil Lentil Lentil Lentil REVENUE PER ACRE Estimated Yield (bu./ac.,lb./ac.) Estimated On Farm Market Price/bu.,lb Estimated Gross Revenue/ac EXPENSES PER ACRE Variable Expenses/acre Seed Fertilizer Chemical - Herbicides Insecticides/Fungicides Seed Treatments/Inoculants Machinery Operating - Fuel Repair Custom Work and Hired Labour Crop Insurance Premium Utilities and Miscellaneous Interest on Variable Expenses Total Variable Expenses Other Expenses/acre Building Rep./Prop.Tax/Bus Overhead Living Expense Debt Payment Per Acre Total Expenses RETURNS PER ACRE* Return over Variable Expenses Return over Total Expenses
120 Black D. Brown Brown Large Green Red Large Green Red Large Green Red Lentil Lentil Lentil Lentil Lentil Lentil RETURNS PER ACRE* Return over Variable Expenses Return over Total Expenses BREAK-EVEN YIELD PER ACRE To Cover Variable Expenses To Cover Total Expenses BREAK-EVEN PRICE PER BU./LB. To Cover Variable Expenses To Cover Total Expenses
121 ChickPeas 121
122 ChickPeas Acres 250, , , , , , , , , ,000 50, Forecasts by STAT Market Research based on data from Statistics Canada. 122
123 Chick Peas Production & Yield 200,000 2, , , , ,000 1,779 2,088 1,581 1,611 1,645 2,000 1, ,000 80,000 60,000 40,000 20, , Production Yield ( lbs) 1, Forecasts by STAT Market Research based on data from Statistics Canada. 123
124 ChickPeas 120, % 100, % 61.00% 70.00% 60.00% 80, % 60,000 40,000 20, % 40.00% 35.40% 30.00% 20.00% 10.00% % 0.00% Ending Stock Stock/Use 0.00% Forecasts by STAT Market Research based on data from Statistics Canada. 124
125 Canadian Supply and Demand Estimate for Chickpeas 2016/2017 Desi Kabuli Small Kabuli All Area (acres) 1, ,000 19, ,000 Yield (lbs/acre) 2,205 1,047 1,392 1,092 Production 1,000 72,200 12,000 85,200 Carry-In 0 2, ,000 Imports 0 9, ,000 Supply 1,000 82,200 12,000 96,200 Exports ,640 10,000 67,600 Seed 40 13,800 1,100 14,940 Feed, Waste, and Other 0 12, ,660 Total Usage 1,000 83,200 12,000 96,200 Ending Stocks Stocks/Use 0% 0% 0% 0% *All quantities in tonnes Source: STAT Publishing Ltd. 125
126 Canadian Supply and Demand Estimate for Chickpeas in 2017/2018 Desi Kabuli Small All Kabuli Area (acres) 1, ,000 21, ,000 Yield (lbs/acre) 2,205 1,672 1,449 1,645 Production 1, ,700 13, ,000 Carry-In Imports 0 9, ,000 Supply 1, ,700 13, ,000 Exports ,540 9,000 67,500 Seed 40 11,800 1,100 12,940 Feed, Waste, and Other 0 29,360 3,700 32,560 Total Usage 1,000 98,700 13, ,000 Ending Stocks 0 40, ,000 Stocks/Use 0% 41% 0% 35% *All quantities in tonnes Source: STAT Publishing Ltd. 126
127 Delivered THIS LAST LAST Plant Prices WEEK WEEK MONTH CHICKPEAS Desi Chickpea CDN$ cwt mm Kabuli Chickpea CDN$ MT Sask 1, , , mm Kabuli Chickpea CDN$ MT Sask 1, , , mm Kabuli Chickpea CDN$ MT Sask 1, , , mm Kabuli Chickpea CDN$ MT Sask 1, , , No 1 B-90 Chickpea CDN$ MT Sask 1, , , No 2 B-90 Chickpea CDN$ MT Sask 1, , , Forecasts by STAT Market Research based on data from Statistics Canada. 127
128 #1 Desi #1-9mm #1-7mm Chickpea Kabuli Chickpea Kabuli Chickpea Brown Brown Brown REVENUE PER ACRE Estimated Yield (bu./ac., lb./ac.) Est. On Farm Market Price/bu., lb Estimated Gross Revenue/ac EXPENSES PER ACRE Seed Fertilizer -Nitrogen Phosphorous Sulphur and Other Chemical**** -Herbicides/Fungicides Insecticides Seed Treatment/Inoculant Machinery Operating -Fuel Repair Custom Work and Hired Labour Crop Insurance Premium Utilities and Miscellaneous Interest on Variable Expenses Total Variable Expenses Building Repair Property Taxes Business Overhead Total Other Expenses Living Debt Payment Total Expenses RETURNS PER ACRE Return over Variable Expenses Return over Total Expenses
129 #1 Desi #1-9mm #1-7mm Chickpea Kabuli Chickpea Kabuli Chickpea Brown Brown Brown RETURNS PER ACRE Return over Variable Expenses Return over Total Expenses BREAK-EVEN YIELD (lbs. or bu. per acre) To Cover Variable Expenses To Cover Rotation Expenses BREAK-EVEN PRICE (per lb. or bu.) To Cover Variable Expenses To Cover Total Expenses
130 Canary Seed 130
131 Canary Seed Acres 400, , , , , , , , , , , , ,000 50, Forecasts by STAT Market Research based on data from Statistics Canada. 131
132 Canaryseed Production & Yield 200, , , , , , , ,006 1,015 1, ,000 60,000 40,000 20, Production Yield (lbs) Forecasts by STAT Market Research based on data from Statistics Canada. 132
133 Canaryseed - Disappearance Year North Europe 23,724 31,439 24,938 24,623 22,200 21,900 Mediterranean 20,290 29,286 26,967 28,074 23,100 23,800 Americas 78,143 77,013 83,176 63,372 61,300 63,300 Pacific Rim 7,725 12,667 18,688 18,562 11,400 14,800 Arab/Africa 6,310 13,448 10,736 11,519 8,200 9,300 Total Export 136, , , , , ,100 All Domestic 10,508 9,947 10,394 11,450 9,600 16,900 Usage 146, , , , , ,
134 Canaryseed Carryover & Stocks/Use 50.00% 80, % 40.00% 35.00% 43.60% 40.90% 70,000 60, % 50, % 40, % 30, % 10.00% 5.00% 0.00% 12.60% 10.80% 3.70% 4.00% ,000 10,000 0 Carryover Forecasts by STAT Market Research based on data from Statistics Canada. Stocks/Use 134
135 Thus Week Last Week Last Month Canada Canaryseed CDN$ cwt U.S. Forecasts by STAT Market Research based on data from Statistics Canada. 135
136 Canaryseed - DkBrown REVENUE PER ACRE Estimated Yield (bu./ac., lb./ac.) Est. On Farm Market Price/bu., lb Estimated Gross Revenue/ac Variable Expenses/acre Seed Fertilizer -Nitrogen Phosphorous Sulphur and Other Chemical**** -Herbicides/Fungicides Insecticides Seed Treatment/Inoculant 0.00 Machinery Operating -Fuel Repair 7.60 Custom Work and Hired Labour Crop Insurance Premium Utilities and Miscellaneous 4.19 Interest on Variable Expenses 4.15 Total Variable Expenses Other Expenses/acre Building Repair 0.59 Property Taxes 6.16 Business Overhead 3.01 Total Other Expenses 9.76 Living Debt Payment Total Expenses RETURNS PER ACRE Return over Variable Expenses Return over Total Expenses
137 Canaryseed Dk. Brown RETURNS PER ACRE Return over Variable Expenses Return over Total Expenses BREAK-EVEN YIELD (lbs. or bu. per acre) To Cover Variable Expenses To Cover Rotation Expenses BREAK-EVEN PRICE (per lb. or bu.) To Cover Variable Expenses 0.15 To Cover Total Expenses

138 Mustard 138
139 Mustard Acres 600, , , , , , , , , , , ,
140 Mustard Production & Yield 250, , , , , Production Yield 0 140
141 Mustard Carryover & Stocks/Use 50,000 45,000 40, % 20.50% 22.40% 22.30% 25.00% 20.00% 35,000 30, % 25,000 20, % 15,000 10,000 5, % 0.60% Carryover Stocks/Use 5.00% 0.00% 141
142 Delivered THIS LAST LAST Plant Prices WEEK WEEK MONTH Yellow Mustard Seed CDN$ cwt Oriental Mustard Seed CDN$ cwt Brown Mustard Seed CDN$ cwt Forecasts by STAT Market Research based on data from Statistics Canada. 142
143 Soil Zone Brown Brown Brown Yellow Mustard Oriental Mustard Brown Mustard REVENUE PER ACRE Estimated Yield (bu./ac., lb./ac.) Est. On Farm Market Price/bu., lb Estimated Gross Revenue/ac EXPENSES PER ACRE Seed Fertilizer -Nitrogen Phosphorous Sulphur and Other Chemical**** -Herbicides/Fungicides Insecticides Seed Treatment/Inoculant Machinery Operating -Fuel Repair Custom Work and Hired Labour Crop Insurance Premium Utilities and Miscellaneous Interest on Variable Expenses Total Variable Expenses Building Repair Property Taxes Business Overhead Total Other Expenses Living Debt Payment Total Expenses RETURNS PER ACRE Return over Variable Expenses Return over Total Expenses
144 Oriental Brown Yellow Mustard Mustard Mustard Brown Brown Brown RETURNS PER ACRE Return over Variable Expenses Return over Total Expenses BREAK-EVEN YIELD (lbs. or bu. per acre) To Cover Variable Expenses To Cover Rotation Expenses BREAK-EVEN PRICE (per lb. or bu.) To Cover Variable Expenses To Cover Total Expenses

145 Cattle 145
146 All cattle and calves in the United States, up 2% as of January 1, 2017, totaled 93.6 million head.
147 US Cattle Inventory Jan 31, 2017 All cows and heifers that have calved, at 40.6 million head, are 3 percent above the 39.5 million head on January 1, Beef cows, at 31.2 million head, are up 3 percent from a year ago. Milk cows, at 9.35 million head, are up slightly from the previous year.
148 US Cattle Inventory Jan 31, 2017 All heifers 500 pounds and over, up 1% as of January 1, 2017, totaled 20.1 million head. Beef replacement heifers, at 6.42 million head, are up 1 percent from a year ago. Milk replacement heifers, at 4.75 million head, are down 1 percent from the previous year. Other heifers, at 8.88 million head, are 1 percent above a year earlier.
149 US Cattle Inventory Jan 31, 2017 Calves under 500 pounds in the United States, as of January 1, 2017, totaled 14.4 million head up 2 percent. Steers weighing 500 pounds and over totaled 16.4 million head, up slightly from one year ago. Bulls weighing 500 pounds and over totaled 2.23 million head, up 4 percent from the previous year.
150 US Cattle Inventory Jan 31, 2017 The 2016 calf crop in the United States was estimated at 35.1 million head, up 3 percent from last year's calf crop. Calves born during the first half of 2016 were estimated at 25.6 million head or 4% percent from the first half of Calves born during the second half of 2016 were estimated at 9.53 million head, 27 percent of the total 2016 calf crop.
151 U.S. Weekly Cow and Bull Slaughter Daily Livestock Report is published by Steiner Consulting Group, DLR Division, Inc. 151
152 U.S. Weekly Cow and Bull Slaughter Last 6 months US producers have increased the number of female animals they have sent to market relative to the previous year. Since July (26 weeks), total cow slaughter based on weekly data has been million head, about 210,000 head (8.3%) higher than the comparable period a year ago. Almost all of this increase has been due to more beef cows coming to market. Dairy cow slaughter during this period has averaged 0.8% under the previous year while beef cow slaughter has averaged 10.7% above last year. 152
153 Ratio of Female Slaughter (Heifers + Cows) To Total US Cattle Slaughter An increase in the cow slaughter numbers alone does not indicate that producers are liquidating their herds. Record high calf prices in 2015 caused producers to try and retain even the most marginal animals in order to maximize calf production so comparisons to 2015 alone tend to skew the overall picture. Also, it is important to remember that the cow herd has increased substantially in the last few years. On January 1, 2016 the overall cow herd was 39.6 million head, about 1.4 million head larger than it was in
154 Ratio of Female Slaughter (Heifers + Cows) To Total US Cattle Slaughter A larger cow herd - more cull cows available thus growth in the number of cows coming to market. Dairy cow slaughter has been flat to slightly lower and in part this is because we have not seen the kind of supply growth in dairy cow inventories that we have seen in the beef complex. The beef cow herd, on the other hand, on January 1, 2016 was 1.2 million head larger than in 2014 for a total inventory of 30.3 MM head. 154
155 Canadian Beef Cows July 6, , , , ,767.4 Percent Decrease from % 5, , , , , , , , , , , , , Source: Statistics Canada 155
156 Canadian Beef Heifers (Breeding) Source: Statistics Canada 156
157 Saskatchewan Beef Cows & Breeding Heifers 1, , , , , , , ,274.2 Beef Cows Breeding Heifers 1, , , , , , , , , Source: Statistics Canada 157
158 800.0 Manitoba Beef Cow & Breeding Heifers Source: Statistics Canada Beef Cows Breeding Heifers 158
159 Monthly Canadian Cutout Values - AAA (CDN $/cwt) Jan Feb Mar Apr May Jun Jul Aug Sep Oct Nov Dec Source: Canfax 159
160 Cold Storage Report - Jan 2017 Total red meat supplies in freezers were up 1 percent from the previous month but down 2 percent from last year. Total pounds of beef in freezers were up 7 percent from the previous month and up 11 percent from last year. Frozen pork supplies were down 8 percent from the previous month and down 13 percent from last year. Stocks of pork bellies were down 4 percent from last month and down 67 percent from last year.
161

162
163 Weekly Live Cattle Exports to the US 40,000 35,000 30, ,000 20,000 15,000 10,000 5, Source: USDA, APHIS 163
164 164


165 Meat Production 165
166 Quarterly Choice Retail Beef Demand Index Table ( ) Source: Dr. Glynn Tonsor, Kansas State University 166
167 Weekly Canadian Dollar Cdn $ (US terms) Source: Bank of Canada 167
168 168
169 US Cattle on Feed Cattle and calves on feed 1,000 or more head totaled 10.6 million head on January 1, The inventory was slightly above January 1, The inventory included 7.02 million steers and steer calves, down 2 percent from the previous year. This group accounted for 66 percent of the total inventory. Heifers and heifer calves accounted for 3.58 million head, up 5 percent from Placements in feedlots during December totaled 1.80 million head, 18 percent above Net placements were 1.74 million head.
170
171 US Cattle on Feed During December, placements of cattle and calves weighing less than 600 pounds were 435,000 head, pounds were 450,000 head, pounds were 450,000 head, and 800 pounds and greater were 460,000 head. Marketings of fed cattle during December totaled 1.79 million head, 7 percent above Other disappearance totaled 55,000 head during December, 29 percent below 2015.
172

173