GREATER HORN OF AFRICA
|
|
|
- Toby Baker
- 5 years ago
- Views:
Transcription


1 GREATER HORN OF AFRICA CLIMATE RISK AND FOOD SECURITY ATLAS Technical Summary For the detailed Atlas see Source: IGAD Climate Prediction & Application Centre (ICPAC) / World Food Programme (WFP) Regional Bureau for East and Central Africa, Nairobi,

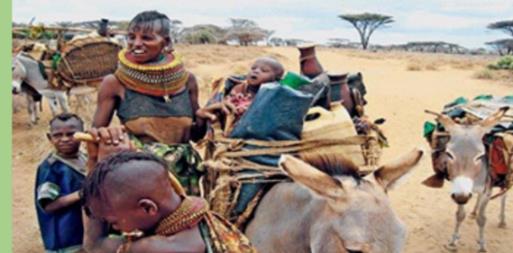
2 Introduction The Greater Horn of Africa (GHA) is one of the regions most vulnerable to climate-related risks. Except for protracted conflict and political violence, climatic-induced risk is the major driver of vulnerability in the region, particularly for poor communities whose livelihood depends on rainfed agricultural systems. Extreme weather events have increased in recent years that are associated with climate variability and change. This has resulted in more crop and livestock diseases, livestock deaths and total crop losses, as well as frequent emergencies, food insecurity, infrastructure damages and high economic costs. The Intergovernmental Authority on Development (IGAD), together with other stakeholders, has therefore emphasised the need to invest in the GHA through the IGAD Drought Disaster Resilience and Sustainability Initiative (IDDRSI) to mitigate the impact of climate-induced risks. Mitigating and adapting to climate risks and resilience building has to be part of the development plans to achieve the Sustainable Development Goals (SDGs), including SDG 2: achieving zero hunger. There is therefore the need for better analysis to understand these climate risks and their impacts on food security. The Greater Horn of Africa Climate Risk and Food Security Atlas is comprised of two sections: Part 1 is a GHA regional analysis and Part 2 covers countries in detail. Plate 1: Impacts of prolonged dry spells in 2010 on (a) maize and (b) livestock in some areas of western and north-eastern parts of Kenya The Atlas is a collaborative effort of WFP, ICPAC and IGAD Disaster Management Programme, with tremendous support and inputs from the Famine Early Warning System Network (FEWS-NET), United Nations International Strategy for Disaster Reduction (UNISDR), United Nations Office for the Coordination of Humanitarian Affairs (UNOCHA), the Food and Agricultural Organization (FAO) and the Regional Centre for Mapping of Resources for Development (RCMRD). The Atlas was validated through a series of regional and country workshops. 1

3 What is this Atlas? The Greater Horn of Africa Climate Risk and Food Security Atlas maps past climate trends, identifies geographic patterns of hazards, vulnerability, and aligns them with food security trends. The Atlas creates a strategic tool and baseline that help guide adaptation planning, programme design, and policy making for national and sub-national government agencies and non-government organizations in the Horn of Africa. The Atlas builds on the IGAD Regional Hazard Maps and Atlas, by including how these factors impact livelihoods, crop production, and other socio-economic activities in the region. The Atlas covers eleven countries (Figure 1) in the GHA. Figure 1: Countries covered and rainfall stations used in the Atlas 2
4 Why this analysis? Climate change events, such as droughts and floods, have increased in frequency and magnitude. These events interact with vulnerable populations and natural systems to increase the number of people at risk in the region. For example, El Niño/La Niña episodes have increased, resulting in droughts in some areas and floods in others, increasing levels of vulnerability. Climate-related shocks and stressors affect food security in the region particularly through the poor rains, witnessed during droughts and floods of 2010/2011. The food security status in the GHA region varies significantly across countries at any given time due to varying conditions and drivers. For this reason, the Atlas looks at the linkages between hazard trends and vulnerabilities to generate appropriate information for policy and programme decisions. The Atlas examines and analyses most of the drivers of food insecurity in the GHA. The majority of drivers are influenced by the climatic variability and change as outlined in Box 1 Main drivers of vulnerability. Box 1: Main drivers of vulnerability Frequent hazards* (droughts, dry spells and floods) Environmental and land degradation* Animal and crop diseases and pests* that negatively impact on production Human disease* (e.g. malaria) that lowers labour availability for production and food utilisation High population density increasing demand for food compared to production potential Eroded livelihoods* and increase in urban population and slums Malfunctioning markets, trade policies and high food prices* Poverty Weak institutional capacity and low access to basic services. Conflict resulting from political and cross-border competition over resources* * Impacted by climate 3
, remote sensing data and temperature (1961 to 2015)); land degradation, land use and land cover; drought")
5 How was the analysis done? Different data sets were used for the analysis that include climate (rainfall (1981 to 2015), remote sensing data and temperature (1961 to 2015)); land degradation, land use and land cover; drought and floods episodes; food security status from the Integrated Food Security Phase Classification (IPC); crop and livestock production; markets and trade routes; malnutrition; and population. These data sets from different sources went into the analysis as summarized in Figure 2 below. Figure 2: Analysis considered in the Atlas Drivers of regional climate Rainfall patterns Rainfall patterns in the region are highly variable due to its complex topographical features such as the Rift Valley System, mountains, plateaus, and large inland water bodies. El Niño/La Niña and the Inter-Tropical Convergence Zone (ITCZ) also cause rainfall anomalies. There is a difference across GHA, some areas have bimodal seasons whilst others are unimodal affecting crop and livestock production and eventually food security. 4
 Influence of El Niño Southern Oscillation (ENSO)")


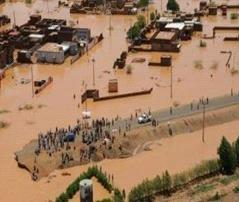
6 Figure 3: Mean annual rainfall, Source: observed data blended with Climate Hazards Group InfraRed Precipitation with Station (CHIRPS) Influence of El Niño Southern Oscillation (ENSO) on Regional Rainfall The ENSO anomaly patterns play a dominant influence on the inter-annual variability of the regional rainfall. The warm phase of ENSO is associated with suppressed rains in the northern sector 1 of the region and abnormally wet conditions such as floods in the southern sector (Figure 4). In contrast, La Niña enhances seasonal rainfall (Figure 5) and Plate 2 shows the impact of flooding and prolonged dry spells. 1 For referencing purposes, the GHA region is generally subdivided into three sub-sectors: The equatorial sector lying approximately between -5 o and 5 o latitude, with the northern and southern sectors occupying the rest of the northern and southern parts of the region respectively 5
 seasonal rainfall during strong El Niño years (i.e.")
 seasonal rainfall and LTM together with Composite of SOND anomaly during strong")


 Sudan and (b) Rwanda and (c)")
7 Figure 4: Mean difference between June- August (JJA) seasonal rainfall and Last Twelve Months (LTM) together with composite of June-August (JJA) seasonal rainfall during strong El Niño years (i.e. Composited years are 1982, 1987, 1991, 1997, 2002, and 2006, 2009) Figure 5: Mean difference between September December (SOND) seasonal rainfall and LTM together with Composite of SOND anomaly during strong La Niña years (Composited years are 1984, 1988, 1998, 1999, 2007 and 2010) This means that the temperature anomalies occurring over the Pacific, Atlantic and Indian Oceans either all at the same time or each at different times, influence the inter-annual variability of the regional rainfall in different ways. The Atlas found that seasonal rainfall declined in parts of the region from the baseline period of , while mean surface air temperature in the region has increased by over 1 C since the 1970s. As Plate 2: Impacts of extreme rainfall events manifested as floods in (a) Sudan and (b) Rwanda and (c) prolonged dry spells in Kenya 6

8 with rainfall, there is evidence that average annual temperatures have become more variable. Climatic Impact in GHA Climatic variability resulted in hotspots Figure 6 shows an overlay of areas identified as prone to floods, high land degradation, and high drought incidences based on the Standard Precipitation Index (SPI). Hotspots are visible in northern parts of Ethiopia, parts of eastern Kenya, southeast Tanzania and northern Sudan. The increased dryness in some areas means that the existing agricultural production systems need to adapt. Global as well as regional climates are changing and, given the levels of greenhouse gases already in the atmosphere, temperatures will continue to rise. This could have serious social, economic and ecological consequences as well as impacting on food security. Information available from the Intergovernmental Panel on Climate Change (IPCC) highlights that extreme weather events have become more frequent and more intense and are likely to become even more pronounced throughout the 21st century due to climate change. Figure 6: Map of Hotspot identification for climate related aspects in GHA region 7
.")
9 Food insecurity trends The number of people in need of food assistance (IPC Phase 3 and above) has continued to increase in the GHA. The largest food insecure population was observed during the El Niño/La Niña events of 2010/2011, 2015 and Needs have increased in South Sudan and Somalia due to conflict (Figure 7). Figure 7: Annual maximum number of food insecure people (IPC phase 3 and above/in need of humanitarian assistance) since 2012 Trend analysis based on recurrent phases generally depicts an improvement in food security over the four years ( ) in much of the region. However, there is still significant temporal variation in food insecurity. This has been brought about by variation in climatic patterns or other factors such as conflicts and malfunctioning markets that directly or indirectly influence food security as seen in Figures 8 and 9. To reduce the effect of climate change on food supplies, livelihoods and economies incentive mechanisms to enhance adaptive capacity in areas such as agriculture in the long and short term remains a priority. 8


10 Figure 8 : Food insecurity selected years (Source: IPC data re-analyses) 2007 to to 2015 Figure 9: Recurrent food insecurity phase (most common) Socio-economic characteristics About 50 percent of the population in the GHA region live below the poverty line of USD 2 per day. The region has an average population growth rate of three percent, among the highest in the world (World Bank, 2015). Demographic pressure is an issue of major concern as population growth continues to outpace increased agricultural production and available resources. This is making it difficult to address the challenges of poverty and food insecurity in the region. In semi-arid areas, around 75 percent of the labour force is involved in smallholder, rain-fed agriculture. This means that the impact of climate variability, extreme events resulting in drought or floods, diseases or economic shocks on crops, livestock and human populations can be acute. 9

.")
11 Physical accessibility to markets Properly functioning markets have an impact on food security among rural populations by cushioning them from stresses and shocks that impact production. When overlaid with population distribution, accessibility mapping can help understand which populations that are likely to be vulnerable to food insecurity. Results show that markets can be reached within 48 hours in most areas. However, more time is needed in parts of Ethiopia, southern Tanzania, Upper Nile state in South Sudan, and Sudan. This analysis also revealed that in most parts of Kenya, Uganda, Rwanda it normally takes less than a day to reach a market (Figure 10). Figure 10: Physical accessibility to markets in the region Figure 11: Maize production and cross-border trade flows (Source: Furthermore, cross-border trade contributes to food security as the markets in the region are interdependent (Figure 11). This means that trade restrictions affect market accessibility, especially in the southeast region between Ethiopia and Somalia, between Tanzania and its neighbours, and between Kenya and Ethiopia. This implies that if cross border trade is restricted through regulatory or policy measures, there are certain areas where populations are likely to be affected due to lack of markets in their particular locations. Therefore there is a need to support and formalize cross-border trade between countries. 10
12 Hunger and Climate Vulnerability Index The Hunger and Climate Vulnerability Index (HCVI) was created in the Atlas as a tool to understand climatic risks to food security at the lower administrative levels. It shows the relative vulnerability of food insecure populations to climate change risks at district level. The composite index incorporates socioeconomic and environmental indicators that are highly correlated and relevant to food insecurity (see Maps below). A total of six indicators have been used. Two for exposure (frequency of floods and drought), two for sensitivity (forest cover and rain-fed agriculture) and two for adaptive capacity (population below poverty line and rural population).. Table 2: Indicators considered in the Hunger and Climate Vulnerability Index (HCVI) Component Profile Indicator Exposure Climate hazards Death toll Mortality per 100,000 inhabitants Economic losses (US $) Losses per GDP (%) Frequency of droughts* Sensitivity Environment Forest cover* (% of total area) Adaptive capacity Frequency of floods* Mean annual temperature* Frequency of Storms Long-term trend in temperature Agriculture Rain-fed agriculture* (% of total agriculture) Crop yields (yield per ha kg/ha) Poverty index Infrastructure Water access rural population (%) Governance Water access urban population (%) Market Paved roads (% of all roads) access* Socioeconomic indicators HCVI = Exposure X Sensitivity / Adaptive Capacity Decadal Population growth (%) Total population below poverty line* ($ 2 per day PPP) (%) Vulnerable employment (%) Rural population* (%) The HCVI goes beyond the impact of climate on crop yields and provides a multidimensional analysis of vulnerability, while demonstrating the critical role of adaptive capacity in determining vulnerability. This approach can also be used to monitor vulnerability, evaluateprogramme efficacy, and/or examine plausible impacts of climate change. The analysis is based on the definition of the relationship between vulnerability and climate change from the Intergovernmental Panel on Climate Change (IPCC 2013). This is the relationship between the degree of climate stress on populations (exposure), the degree of responsiveness to stress (sensitivity) and the 11
 Adaptive Capacity - Ability of populations to adjust to the climatic changes")


13 ability of populations to adjust to the climatic changes (adaptive capacity) (Figure 12) (a) Exposure to climate stress (b) Sensitivity - degree of responsiveness to stress Figure 12: Distribution of HCVI components (c) Adaptive Capacity - Ability of populations to adjust to the climatic changes Based on this analysis, most of Kenya normally faces minimal food insecurity conditions (IPC Phase 2). However, the population is highly sensitive to climate variability. Similarly, most of Puntland and Somaliland in Somalia, south-western and some areas of north- eastern Ethiopia some areas before the desert in central Sudan; Northern Red Sea region of Eritrea; eastern Jonglei, Western Bahr el Ghazal and Western Equatoria states of South Sudan recorded a very high hunger and climate vulnerability index (Figure 13). This means climatic shocks can have a significant impact on food security in these area. A high HCVI was observed in the coastal areas of Tanzania and Kenya, most of central Sudan, pockets of north eastern Ethiopia and around the Lake Victoria region. The other areas of the region range from low to medium HCVI. 12 Figure 13: Hunger & Climate Vulnerability Index (HCVI)
14 Implications of the Analysis: Climate variability and change shown through the highly variable and erratic rainfall together with rising temperatures in the region has become the major driver of vulnerability. It has significant economic impact, reducing food security and decimating livelihoods. Extreme events especially El Niño/La Niña episodes have become more frequent resulting in droughts and floods in some areas, increasing levels of vulnerability. The following essential actions by both governments and development partners will help to reduce the increasing vulnerability and achieve the Sustainable Development Goals (SDGs): Reform government policies, development plans and programmes on sectors that are most vulnerable to climate change and mitigate its related impacts. Adapt farming systems through interventions such as increased irrigation, water harvesting, risk transfers (insurance) and considering changing to drought tolerant species to address climate variability in hotspots. Strengthen resilience building initiatives to cope with increased extreme climatic events and changing ecosystems. Strengthen safety nets to protect lives and livelihoods of the most vulnerable, as both harvest failures and food commodity prices continue to increase in the region while livelihoods especially for the most poor are shrinking due to climatic impacts. Establish land and resource management policies and plans to address increased population and utilization of marginal lands, which have resulted in increased land degradation. Review policies on the management and use of the existing Strategic Food Reserves (SFRs) or establish them, to address high food commodity prices and reduced food availability associated with climate variability and some trade restrictions in the region. Integrate food and nutrition security and sustainable agriculture into regional, national, and local policies. Hunger cannot be eliminated in our lifetime without adapting to climate change and building the resilience of vulnerable people to changing ecosystems and increasing disaster risk and climate change. 13