Irrigation Management Technologies
|
|
|
- Rodney Hood
- 5 years ago
- Views:
Transcription
1 Irrigation Management Technologies Nicholas Kenny, P.E. Texas AgriLife Extension Service Amarillo Crop Production Clinic Goodwell, Oklahoma; 8 March 2012 Improving Lives. Improving Texas.

2 Programs Supported By Texas AgriLIFE Extension Service Ogallala Aquifer Initiative North Plains GCD

3 North Plains EPIC Efficient Profitable Irrigation in Corn

4 Corn Yield and Returns Per Unit of Water 225 $ $ $500 Grain YIield (Bushels / Acre (Blue, smooth line) Maximum physiological yield is expected to occur at 34 of total water. Maximum economic return is expected to occur at 29 of total water. $400 $300 $200 Net Residual Returns per acre (Green, marked line) $100 0 $ Total Seasonal Water (Inches) Irrigation + Soil Storage + Precipitation
5 E.P.I.C Project Goals 2011 Protocol 1. Maintain or Improve Grain Yield 2. Reduce Irrigation by 1 4
6 Management Technologies Employed

7 2011 EPIC Field Parameters County Plot Acres Tillage Method GPM GPM / Acre Variety Plant Population Planting Date Previous Crop Dallam 1 Legacy 120 No-till LESA Pioneer Y ,000 VR 2-May Wheat 2 Hartley Legacy 120 Strip LESA Pioneer 33D49 32, Apr Corn EPIC 120 Strip LESA Pioneer 1395AM1 31, Apr Corn Hutchinson Legacy No-till SDI Syngenta N72F 36, Apr Cotton EPIC 11.6 No-till SDI Syngenta N72F 36, Apr Cotton Ochiltree 1 Legacy 90 Conv. LESA Pioneer 1395AM1 32, Apr Wheat EPIC 50 Conv. LESA Pioneer 1395AM2 32, Apr Wheat Sherman Legacy 120 Strip LESA Channel Apr Corn EPIC 120 Strip LESA Channel Apr Corn 1 Dallam and Ochiltree County cooperators employed a split-pivot. The Ochiltree acreages are estimated based on the North - South divider line. 2 The Dallam County plot was prepared with a spray-killed wheat cover crop, following the 2010 grain corn crop.
8 2011 EPIC Field Results Water (Inches) Location Plot Irrigation Soil 3 Precipitation Total Yield (Bu/ Acre) WUE 4 Dallam Co. 1 Legacy Hartley Co. Legacy EPIC 31.4 (0.35) Hutchinson Co. 2 Legacy EPIC Ochiltree Co. Sherman Co. Legacy 31.2 (0.66) EPIC Legacy EPIC Irrigation application was not able to be reduced on the Dallam County field due to the severe 2011 weather conditions. 2 The Hutchinson County plots utilized subsurface drip irrigation (SDI). The Legacy plot (10.25-acres) reached physiologically maturity earlier than the EPIC plot (11.6-acres) and the remainder of the field (total of approximately 65-acres). The field average yield was 184- bushels, including the two test plots. 3 Soil water content was measured early and late in the season using gravimetric sampling, except the Dallam field which is modeled by AquaPlanner. Negative values indicate seasonal soil moisture accumulation and were evidenced in multiple fields due to dry residual early soil conditions. 4 WUE refers to water use efficiency defined as bushels of corn per inch of TOTAL water (bu/ inch)
9 2011 EPIC Economics Summary County Irr Reduction (inches) Yield (Bushels / acre) Profit ($ / Acre) Dallam 0 0 $ - Hartley $ Hutchinson $ Ochiltree $ Sherman $
10 Why Plants Use Water Provides Plant Structure Temperature Regulation Move Nutrients (Drink, not Eat!!) Salinitymanagement.org
11 Evapotranspiration - ET Meteorological model to estimate crop water use. Wind is the most influential factor Heat is the second most influential factor Vegetation Mass / Plant size

12 AquaPlanner: Irrigation Modeling

13 2011 EPIC: Ochiltree Co.
14 Cotton: Daily ET & Irrigation Demand: 1 June PD year Average ( ) North Plains Research Field - Etter, Texas Cotton Daily ET (inches) Average Daily Irrigation Demand GPM / Acre Daily ET, Inchs Jun 1-Jul 1-Aug 1-Sep 1-Oct 1-Nov

15
16 AquaPlanner Summary Cost: ~$1 per acre Uses Local weather data corrected for Ag. ET Use of daily / weekly ET info Helpful in pre-season crop water use projections Would be beneficial on EVERY ACRE Pat Scarth: (806) pat@aquaplanner.net
 825-4777 $2,200 per Unit - Lease Probe")
17 Capacitance Probe: Soil Water Monitoring aquaspy.com Dave Sloane: (314) $2,200 per Unit - Lease Probe Install Data
 237-0415 $2,500 per Unit - Lease")
18 Capacitance Probe: Soil Water Monitoring cropsense.com Keith Patterson: (901) $2,500 per Unit - Lease Probe Install Data

19 Capacitance Probe: Soil Water Monitoring aquacheck.co.za Available through Eco-Drip $3,200 per Unit - Purchase Sensor Logger Install
20

21
22 2010: Probe Water Response i i i 2.19 i.4 i i i i i i i i 11 irrigations, ~1.2 Rain event Unit lost power

23 Lessons from Ochiltree Co. Legacy: 168 Bushels 32.8 Total

24 Lessons from Ochiltree Co. EPIC: 188 Bushels 32.6 Total

25 EPIC 2011: Ochiltree County Legacy: 168 Bushels 32.8 Total EPIC: 188 Bushels 32.6 Total


26 EPIC 2011: Sherman County Legacy: 141 Bushels 28.6 Irr EPIC: 171 Bushels 25.6 Irr
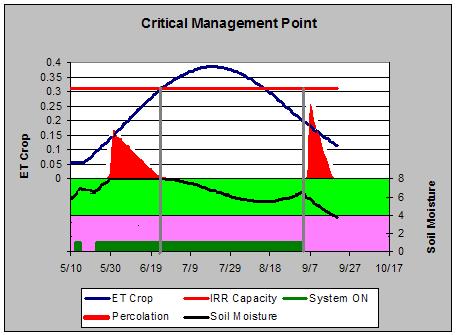
27 Can t Manage what you Can t Measure


28 Can t Manage what you Can t Measure


29 CropMetrics Irrigation Prescriptions


30 EM Survey with RTK Elevation Data EM38 Sensor


31 Process EM Data and Calculate Field Variability Uniform Application: 12.8% (estimate 12.8% yield opportunity) Sector Application: 6.4% (anticipate 6.4% yield improvement) Zone Application: 1.6% (anticipate 11.2% yield improvement)

32 Example Custom VRI Prescriptions

33 Example Custom VRI Prescriptions
 Kevin Abts (402)")
34 CropMetrics Service Cost: ~$8 / acre + 1x Set-up Costs $6 / acre) Yield Map Fertility Map Topography Map Valley, Wilbur-Ellis (North) Kevin Abts (402)

35 Aerial / Satellite Photography Images Courtesy of Olan Moore High Plains Consulting, Inc.


36 Gypsum Block: Soil Water Monitoring

37 Gypsum Block: Soil Water Monitoring ~$750 per unit 4+ Sensors ~$30 per sensor
38 Gypsum Block: Soil Water Monitoring


39 Electro Tensiometers: Irr. Triggers Irrometer Tensiometer Talgil TensioMarker


40 Portable Soil Moisture Meters Watchdog: FieldScout TDR Campbell Scientific: CWS655 (Volumetric)

41 Nicholas Kenny, P.E. Irrigation Specialist Agricultural Engineer Amarillo Research and Extension Center 6500 Amarillo Blvd. West Amarillo, TX YouTube Channel: NPKTexasAgriLIFE Web Site:
42 Efficiency A measure of how well an input is converted to a desired output Miles / Gallon Energy / Pumped Water
43 Measures of Irrigation Efficiency Application Efficiency Water that reaches the soil Transpiration Efficiency Water available to the Plant (Application Eff. minus evaporation and run-off) Water Use Efficiency - Yield / Acre-inch total water (Applied or Final Water)


44 Irrigation System Application Efficiency Surface 50-80% Common Flood 50% Land Leveled 60% Row 65% Alternate Furrow 70% Surge 80% Center Pivot 70-92% LESA 85% LEPA 90% Drag Hoses 92% Drip 90-95% Above Ground 92% Subsurface (SDI) 95%
45 Calculating Application Depth Consider: 500 GPM Center pivot with Sprays (90% eff.) 120 Acres
46 Why Plants Use Water Provides Plant Structure Temperature Regulation Move Nutrients (Drink, not Eat!!) Salinitymanagement.org

47 Evapotranspiration - ET Meteorological model to estimate crop water use. Wind is the most influential factor Heat is the second most influential factor Vegetation Mass / Plant size
48 Reference Evapotranspiration ET o 17-year Average ( ) TXHPET Weather Station - Etter, Texas Daily Evapotranspiration (Inches) Apr 1 May 31 May 30 Jun 30 Jul 29 Aug 28 Sep 28 Oct
49 Grain Corn Daily Evapotranspiration for Multiple Planting Dates 17-year Average ( ) TXHPET Weather Station - Etter, Texas Daily Evapotranspiration (Inches) April PD - FS Corn 15 April PD - FS Corn 1 May PD - FS Corn 15 May PD - SS Corn 1 June PD - SS Corn 5 June PD - SS Corn 15 June PD - SS Corn Reference ET Apr 1 May 31 May 30 Jun 30 Jul 29 Aug 28 Sep 28 Oct


50 Grain Corn Physiology MATURES based on HEAT & GROWS based on TIME!! Start Fast to maximize Photosynthesis Finish Slow to maximize Grain Fill
51 Grain Corn Daily Evapotranspiration for Multiple Planting Dates 17-year Average ( ) TXHPET Weather Station - Etter, Texas Daily Evapotranspiration (Inches) April PD - FS Corn 15 April PD - FS Corn 1 May PD - FS Corn 15 May PD - SS Corn 1 June PD - SS Corn 5 June PD - SS Corn 15 June PD - SS Corn Reference ET Apr 1 May 31 May 30 Jun 30 Jul 29 Aug 28 Sep 28 Oct
52 Grain Corn Daily Evapotranspiration for Multiple Planting Dates 17-year Average ( ) TXHPET Weather Station - Etter, Texas Daily Evapotranspiration (Inches) April PD - FS Corn 15 May PD - SS Corn 5 June PD - SS Corn 1 June PD - Cotton Reference ET Apr 1 May 31 May 30 Jun 30 Jul 29 Aug 28 Sep 28 Oct
53 Grain Corn Accumulative Evapotranspiration for Multiple Planting Dates 17-year Average ( ) TXHPET Weather Station - Etter, Texas Accumulated Evapotranspiration (Inches) April FS Corn 15 April FS Corn 15 1 May FS Corn 15 May FS Corn 1 April SS Corn April SS Corn 1 May SS Corn 15 May SS Corn 5 1 June SS Corn 5 June SS Corn 15 June SS Corn 0 1 Apr 1 May 31 May 30 Jun 30 Jul 29 Aug 28 Sep 28 Oct
54 Grain Corn Heat Units after Planting (HUAP) for Multiple Planting Dates 17-year Average ( ) TXHPET Weather Station - Etter, Texas 4,000 3,750 3,500 3,250 2,800 HUAP - Mature Grain Corn Accumulated Heat Units After Planting (F) 3,000 2,750 2,500 2,250 2,000 1,750 1,500 1,250 1, April Corn HUAP 15 April Corn HUAP 1 May Corn HUAP 15 May Corn HUAP 1 June Corn HUAP 5 June Corn HUAP 15 June Corn HUAP 0 1 Apr 1 May 31 May 30 Jun 30 Jul 29 Aug 28 Sep 28 Oct


55 Direct Planting into trash

56 Preplant Irrigation Study
57 Estimated Reduction of Profile SW as a Percentage of Rain and Applied Water During PP Irrigation Period System Average Spray 60% 58% 83% 67% LEPA 43% 61% 76% 60% SDI 29% 55% 57% 47%
58 Estimated Reduction of Profile SW as a Percentage of Rain and Applied Water During PP Irrigation Period System Average Spray 60% 58% 83% 67% LEPA 43% 61% 76% 60% SDI 29% 55% 57% 47%
59 Estimated Reduction of Profile SW as a Percentage of Rain and Applied Water During PP Irrigation Period System Average Spray 60% 58% 83% 67% LEPA 43% 61% 76% 60% SDI 29% 55% 57% 47%

60 1 of pre-plant irrigation = <0.50 July - Aug irrigation
61 Pre-Water Considerations Avoid unless very dry and Late Planting Dates Consider: 360 GPM on 120-acres 3 GPM / acre 4.3 in 30-days with 90% Efficiency May 15 PD with day ET In- season irrigation Possible gain of 3 early In 2011 Driest starting soil tested had 3.5 PAW

62 Pre-Water Considerations Irrigation when water is the most valuable Regulatory Limits Capacity Limits (well depletion not based on calendar days) Think of a soil like a bucket It can only hold so much Defer as long as possible to allow for rainfall accumulation Plant is very small early, not much water demand Residue / Surface Cover is always a good option
63 Cotton: Daily ET & Irrigation Demand: 1 June PD 14-year Average ( ) North Plains Research Field - Etter, Texas GPM / Acre Most Valuable Water Cotton Daily ET (inches) Average Daily Irrigation Demand 4 GPM / Acre GPM / Acre Daily ET, Inchs Necessary for vigor Damaging Water Jun 1-Jul 1-Aug 1-Sep 1-Oct 1-Nov

64 Soil Management Considerations
65 Plant Available Water In Soil Inches of Water (3' Root Zone) Coarse Sand 1.50 Fine Sand 2.75 Loamy Sand 3.50 Sandy Loam 4.00 Fine Sandy Loam 5.25 Silt Loam 6.75 Silty Clay Loam 5.75 Silty Clay 5.00 Clay 4.00
66 Seasonal Soil Water Levels (Hypothetical) 100.0% SAT - Saturation 90.0% 80.0% 70.0% 60.0% 50.0% 40.0% 30.0% 20.0% Plant Available Water FC Field Capacity RAW Readily Available Water MAD Management Allowable Depletion PWP Permanent Wilting Point 10.0% 0.0% Jun Jul Aug Sep Oct Nov
67 Understanding Evapotranspiration Evaporation + Transpiration Water Provides: Plant Structure Temperature Regulation Nutrient Update Salinitymanagement.org
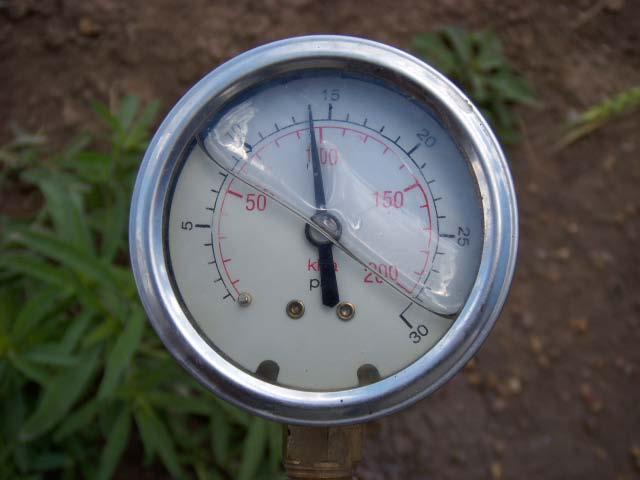
68 Understanding Evapotranspiration Evaporation + Transpiration Water Provides: Plant Structure Temperature Regulation Nutrient Update Transpiration Yield Evaporation Wasted Water Salinitymanagement.org
69 Soil Surface Evaporation Post Application 100% 90% Percent of Evapotranspiration 80% 70% 60% 50% 40% 30% 20% 10% 0% Clay Silt Loam Loamy Sand Days after Surface Wetting
70 Irrigation Frequency Slow Down in Drought / Deficit Conditions Image Courtesy of Olan Moore High Plains Consulting, Inc.
71 Pivot Speed Considerations Specific VOLUME of water lost per application (up to ¼ ) More applications More evaporative loss Consider: 550 GPM on 120-acres.25 per day capacity Assume.20 evap. loss per application 3-day lap leads to 1.84 over 10 days 5-day lap leads to 2.1 over 10 days 90-day Season 2.34 reduction in effective water.
72 Application Rate vs. Runoff / Percolation Derrel L. Martin, et al: University of Nebraska - Lincoln ASABE Proceedings IRR
73 Windshield Wiper Pivots #1 Compromise: Sprinkler Opposite of where it needs to be. Don t get too complicated in Management: Water volume = Water Volume Match application to infiltration in the corners ( <2 in one day) 5 GPM / Acre 7-8 day round trip ( ) 6 GPM / Acre 6-7 day round trip ( ) 7 GPM / Acre 5-6 day round trip ( ) DO NOT dead-head back!!! (Except for rain or shut-down)
74 Windshield Wiper Pivots #2 Very deep application (1.5 2 ) from centerline in. Dead-head back to centerline (<.10 )


75 Daytime and Nighttime Variation

76 Plugged / Worn-out Nozzles


77 How frequently to change nozzles?? Re-Nozzle when: Flow changes by GPM (be Honest!!!) Add or Remove regulators Replace nozzles with wear, check annually: Infinite lifespan with clean water Maybe annually with sand, salt, grit

78 Altered Drop Heights Pressure Change 2.31 Elevation = 1 PSI


79 Spray vs. Bubble Increased Efficiency Uniform Germination

80 Dealing with Air in Pipelines Used with permission from Nelson Irrigation.