Robert Hochmuth Regional Extension Agent and Assistant Center Director, NFREC- Suwannee Valley Live Oak, Florida
|
|
|
- Mervyn Paul
- 5 years ago
- Views:
Transcription

1 Robert Hochmuth Regional Extension Agent and Assistant Center Director, NFREC- Suwannee Valley Live Oak, Florida

 Environmentally Sensitive Area")

2 Suwannee River Basin of North Florida 30 Years of Plasticulture Vegetables Deep (10-12 ft) Sandy Soils (<1.5% OM) Environmentally Sensitive Area Plasticulture Adoption Plasticulture Management Water and Nutrient Management

3
 2013-2018 Basin Management Action")
4 Water Quality and Quantity Suwannee Valley Nitrates in Ground Water Research Funded by Several Agencies Signup Benefits Presumption of Compliance Waiver of Liability Cost Share Programs 2010 Numerical Criteria for Water Bodies (EPA) Basin Management Action Plans


5 Changes in production in Florida in past 30 years


6 1. Soil test 2. All Phosphorus and Micronutrients applied in bed pre-plant (not in deep groove) 3. 1/3 of N and K applied in bed pre-plant 4. Remaining N & K fertigated 5. Sap Test or Tissue Analysis to fine tune, especially in wet year 6. Terminate N&K fertigations prior to final harvest 7. Manage irrigation to keep nutrients in root zone
7 Right source. A soil test is necessary to accurately identify specific nutrients needed. Right rate. Use IFAS rates as a starting target. Adjust with documentation of added amounts (leaching rain events, etc.). Right time. Base timing of applications on plant growth stages. Right placement. Avoid vulnerable broadcast applications of leachable nutrients. Use sidedressing, banded, or drip-fertigation applications.
8 Example: The right rate More than 20 studies Maximum yield with 150 lb/acre with 8-ft beds Yield declined above 200 lb/acre N (8-ft centers) A Summary of N, P, and K Research with Watermelon in Florida, 2010, by G. Hochmuth and E. Hanlon, Keep in mind, rate is only part of a fertilizer recommendation

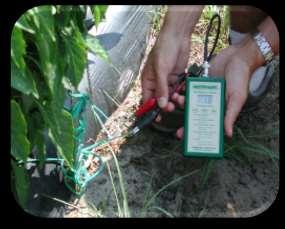
9 Monitoring and fine tuning in-season fertilizer applications Traditional dry leaf analysis Fresh petiole-sap testing Both use most-recently-matured whole leaf /
10 PETIOLE SAP TESTING-WATERMELON CROP STAGE SAP NITRATE-N (PPM) SAP K (PPM) VINES 6 INCHES FRUITS 2 INCHES FRUITS HALF MATURE AT FIRST HARVEST

11 On-Farm Test of Petiole Sap Testing Farmer 1 520* ppm NO3-N Farmer Farmer 3 350* Farmer Farmer 5 800* Farmer Recommended level is ppm near 1 st harvest * denotes farmers with highest yields


12 Current research with controlled-release fertilizers
13 Yield (cwt/acre) Troubadour Watermelon, 2013, Citra, FL Season yield (cwt per acre) LSD 0.05 = Control, no N IFAS standard, fertigation, 150N, 150K2O 120 lb N/A 80% CRF/20% soluble (CRF = D120 NPK) 150 lb N/A 100% CRF (CRF = D120 NPK)

14 Irrigation management Conservation of water Control movement of soluble nutrients like N and K
15 Water management BMP Know root zone Know water-holding capacity Know stage of growth Know crop ET Know irrigation delivery Answer: when to start the irrigation system Answer: how long to run the irrigation system
16 Root Zone the water bank Soil Water Components 30% 60% 100% Gravitational water Plant available water Saturation Field capacity Permanent wilting point Hygroscopic water Unavailable to plants Make a decision to irrigate When 30 to 60% of AWHC is used Sometimes called management allowable depletion Sandy soil holds about 0.7 inch per foot


17

18 Tensiometers -8 to -12 centibars Early-season- can help Reduce amounts of water Mid-Season can help Determine changes in water demand Late-season Water demand is high hard to over-irrigate


19 Use automated switching valves Start with moist bed, keep beds moist Use a hand held TDR Probe, 8-12% Daily readings, middle of day Before zone comes on, driest time of day 4 from drip, middle of bed
20


21

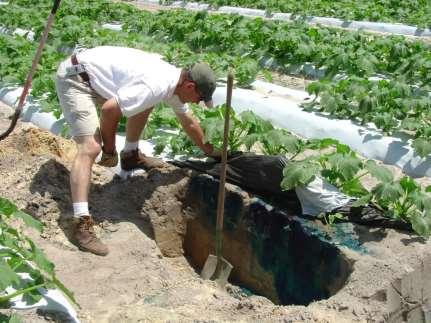
22 lue Dye Don t Lie

23
24 Tomato Roots 88% top 10 soil (loam soil)
25 6 12 Watermelon roots 76% top 12 soil


26 T0-1h 1h T0-2h Cross Cut T0-4h T0-8h


27 T0-1h T0-2h Side View T0-4h T0-8h
 Sand 6-10% Loam 11-21% Field Capacity (FC)")
28 How much water can my bucket hold? Varies with soil type Volumetric Moisture Content (VMC) Sand 6-10% Loam 11-21% Field Capacity (FC) Clay 22+% Soil Matrix at Field Capacity Water Minerals Air Organic

29 Photo: L. Zotarelli

30


31


32

33 Early Season (first 4 wks) greatest risk of leaching irrigation was generally reduced by 50% Mid Season Irrigation sensors caught rapid increase in water demand (late April early May) Late Season Very difficult to over irrigate Lowest risk of leaching Single irrigation events should be no longer than 1½ hours Blue Dye Don t Lie Videos available at


34


35 Donell and Robert Gwinn Located in Suwannee County, McAlpin BMP Demonstration Farm Plastic mulch and drip irrigation 125 acres watermelon
36


37 Jack and Riley Putnal Located in Suwannee County Raise cattle, peanuts, iron-clay peas, corn, sorghum Plastic mulch and drip irrigation 300+ acres watermelon


38 Weeks No injection. 1 lb/a/day. Nitrogen only lb/a/day. N and Potash lb/a/day. N and Potash lb/a/day. Depends on harvest Timing and rates coincide with sap test.

39 PPM Nitrogen Sap test Nitrogen Nitrogen Upper Limit Actual Nitrogen Nitrogen Lower Limit 600 Samples collected every 7 days.

40 Connection of Specific Demonstrations Sap Testing or Leaf Tissue Analysis Soil Moisture Sensors Blue Dye Combination of Methods UF Center Trials & Field Days Drip Irrigation Schools On-Farm Demonstrations Irrigation Management more Important than Specific Nutrient Amount
41 Bob Hochmuth