KSU Agriculture Today Radio Notes
|
|
|
- Sabrina Mills
- 5 years ago
- Views:
Transcription


1 KSU Agriculture Today Radio Notes Daniel O Brien, Extension Agricultural Economist, Kansas State University For Radio Program to be aired 10:00-10:15 a.m., Friday, March 31, 2017 I. Grain Futures Closes, Changes & Carry on Thursday, March 30, 2017 Corn Futures Soybean Futures Kansas HRW Wheat Futures Month Close Change Carry /mo Month Close Change Carry /mo Month Close Change Carry /mo May 17 $3.57 ½ $ May 17 $ 9.63 $ May 17 $4.17 ¼ $ July 17 $3.65 $0.01 $ July 17 $ 9.73 ¼ $ $ July 17 $4.30 ¼ $ $ Sept 17 $3.72 ¼ $0.01 $ Aug 17 $ 9.75 ¼ $ $0.02 Sept 17 $4.45 ½ $0.06 $ Dec 17 $3.81 $0.01 $ Sept 17 $ 9.68 ¼ $ No Carry Dec 17 $4.69 $ $ Mar 18 $3.90 ¼ $ $ Nov 17 $ 9.63 ¼ $ No Carry Mar 18 $4.85 ¼ $0.05 $ May 18 $3.95 ¾ $ $ Jan 18 $ 9.68 ¾ $ $ May 18 $4.93 ¼ $ $0.04 July 18 $3.99 $ $ Mar 18 $ 9.71 $0.05 $ July 18 $4.96 ¼ $0.06 $ Sept 18 $3.92 ½ $0.015 No Carry May 18 $ 9.74 ¾ $ $ Sept 18 $5.08 $ $ Price Soybean$ / Price Corn$ Ratios on March 30, 2017: Current Crop 2016/17 $MAY 2017 Soybeans $MAY 2017 Corn = $ 9.63 $3.57 ½ = 2.69 New Crop 2017/18 $NOV 2017 Soybeans $DEC 2017 Corn = $ 9.63 ¼ $3.81 = 2.52 *** 1 P age
2 II. USDA Planted Acres and Grain Stocks Reports to be released on Friday, March 31, 2017 How USDA's corn, soy plantings could surprise traders by Karen Braun - Reuters, March 29, 2017 The opinions expressed here are those of the author, a market analyst for Reuters. CHICAGO, March 29 (Reuters) - Current Chicago futures prices suggest that analysts may have overestimated 2017 U.S. corn acres and underestimated soybean acres for Friday's USDA plantings report - though the trade expectations do have a spotty track record. Report outcomes from several past years suggest that this year's corn acres could fall below the range of 31 analyst estimates, and the soybean number may push the high side of the range. On Friday at noon EDT (1600 GMT), the U.S. Department of Agriculture's statistics service will publish its annual Prospective Plantings, which will break down how many acres of each crop U.S. farmers intend to plant this spring. The figures are primarily based on probability surveys of over 83,000 farm operators conducted during the first two weeks of March. The market will mostly be focused on the number of acres planted to corn and soybeans, the United States' top two exported crops. Analysts predict the report will reflect million acres of corn (down 3%) and million acres of soybeans (up 6%) on the year, respectively. The low side of the range is 90 million acres for corn and the high side of the soybean range is 89.3 million acres. The expected year-on-year change in soybean acres is relatively large compared with history and the corn assumptions are more in line with past years, but there is evidence that these gaps may prove even wider come Friday. Most analysts would agree that the March plantings report is one of the most difficult to predict, which is why report day is often one of the most volatile trading days of the year for corn and soybean futures. However, price moves cannot always be directly explained by the expectation and outcome of the report since it competes with another key set of USDA data - quarterly U.S. grain stocks - released at the same time. Traders will also be watching wheat acres on Friday, though to a slightly lesser extent since they already have a partial idea of what to expect, as USDA released planting expectations for winter wheat back in January. Market participants are fairly confident that total wheat acres are headed for the lowest levels in at least 106 years. MORE SOYBEANS, MAYBE On average, market analysts polled by Reuters prior to the plantings report generally tend to overestimate soybean acres, as they have done so in eight out of the past 12 years, including the last two. However, the years in which the average analyst estimate undershot reported soybean acres , 2008, 2006, and all share a common characteristic: an above average new-crop soybeans-tocorn futures price ratio early in the year. But it is hard to believe that analysts would have overlooked this, as the late winter/early springtime ratio of November soybean futures SX7 to December corn CZ7 is a very common profitability indicator. Values much over 2.4 imply that U.S. farmers are more likely to favor soybeans over corn in the spring. Ever since the beginning of 2017, the new-crop futures price ratio has hovered at 20-year highs, averaging around So the expectations for soybean acreage to annihilate 2016's record by nearly 5 million acres seems to make sense, and the historical comparisons suggest that Friday's figure could push the 89 million range. Confidently predicting record-high anything can be a dangerous game and the agriculture market is often wary of doing so. But all 31 analysts polled by Reuters believe there is no chance that soybean acres miss the record in 2017, and in fact the lowest estimate provided was 3 million acres above last year's area. This same idea worked fairly well for analysts in 2014, when the new-crop futures ratio was also elevated in favor of soybeans, though they still proved too low on their guess. On average, analysts predicted that 2014 planting intentions would show soybean acreage rising a massive 4.2 million acres above the previous year and 3.6 million above 2009's record, which has since been broken. The pre-plantings trade guess in 2014 turned out to be about a half a million acres too low, and final soybean acreage that year came in 1.8 million acres above intentions. CORN BELOW 90? Traders will likely avoid a repeat of last year, which was their worst-ever miss of the corn acres prior to planting intentions - some 4 percent too low. Directionally, the assumption for lower acres in 2017 makes sense given the yellow grain's lower profitability compared with other crops. But analysts have not given themselves much of a downside cushion as not one of the 31 analysts polled by Reuters believe that corn acres would end up lower than 90 million acres on Friday. Given the trade average of million acres, the lower range is very small and has only been below 1 million acres twice before in the last 12 years. This could have a psychological impact on the futures market on Friday if the report comes in even a hair below the trade range. If USDA ends up printing 89.9 million corn acres, the difference in the lead digit could make it the largest 0.1 percent miss in history. And given corn's lackluster economic incentive this year, a sub-90 million acre number would not be the most shocking thing that ever happened. Over past 12 years, analysts overestimated corn on the three years with the highest new-crop corn-to-soybeans ratio and 2 P age
3 underestimated it on the three lowest years. During the month of March, the 2017 new-crop futures ratio has been nearly equal to that of 2005, which featured the highest values of the past 20 years. In both 2005 and 2014, the trade overestimated corn plantings by 1.2 percent - which if applied to the average market guess for 2017 would amount to 89.9 million acres. (( karen.braun@thomsonreuters.com ; +1)(312)( ; Reuters Messaging: karen.braun.thomsonreuters.net@reuters.com; Twitter: ) A. USDA Quarterly Stocks Report Pre-report Trade Estimates for March 31, 2017 (Source: DTN) (billion bushels or bb ) March 1, 2017 Grain Stocks Average Pre-report Low-End Pre-report High-End Pre-report March 1, 2016 March 1, 2015 March 1, 2014 Grain Stocks Crop Estimates Trade Estimates Trade Estimates Trade Estimates Grain Stocks Grain Stocks Corn bb bb bb bb bb bb Soybeans bb bb bb bb bb bb Wheat bb bb bb bb bb bb Grain Sorghum bb bb bb bb bb bb B. USDA Prospective Plantings Report Pre-report Trade Estimates for March 31, 2017 (Source: DTN) (million acres or ma ) March 1, 2017 Planted Acres Average Pre-report Low-End Pre-report High-End Pre-report 2016 U.S U.S U.S. Planted Acres U.S. Crop Estimates Trade Estimates Trade Estimates Trade Estimates Planted Acres Planted Acres Corn ma ma ma ma ma ma Soybeans ma ma ma ma ma ma All Wheat ma ma ma ma ma ma Winter Wheat * ma ma ma ma ma ma ma Spring Wheat ma ma ma ma ma ma Durum Wheat ma ma ma ma ma ma Grain Sorghum ma ma ma ma ma ma 3 P age
4 4 P age
5 5 P age

6 6 P age


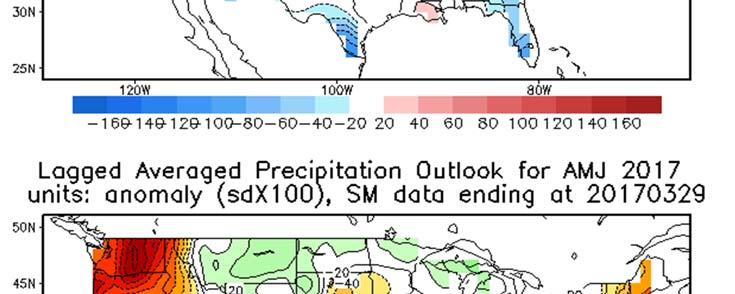
7 II. U.S. & World Drought Monitor, Moisture Accumulations & Forecasts (Weekly Weather and Crop Bulletin) 7 P age

8 8 P age


9 9 P age

10 10 P age

 Total sales (3/23/2017) for current MY 2016/17 = 1.867 bb i.e., 83.9% of 2.225 bb USDA projn w. 55.8% of MY complete (29/52 weeks) MAY 2017 Corn (Daily): $3.57 ½ on Th.")
11 III. Corn Market Information Daily MAY 2017 Corn Futures Key Corn & Grain Sorghum Supply Demand Factors: U.S. Corn Exports: Bullish short term MY 2016/17 U.S. corn export shipments with positive long term outlook for total sales Weekly Export Shipments week of 3/23/2017 for MY 2016/17 = 55.2 mb vs 44.5 mb/wk needed to meet USDA s March 9 th projn of bb exports Total shipments through 3/23/2017 for MY 2016/17 = bb i.e., 54.0% of bb USDA projn with 55.8% of MY complete (29/52 weeks) Total sales (3/23/2017) for current MY 2016/17 = bb i.e., 83.9% of bb USDA projn w. 55.8% of MY complete (29/52 weeks) MAY 2017 Corn (Daily): $3.57 ½ on Th., March 30, 2017 Monthly Corn Futures Continuation Chart MAY 2017 Corn: $3.57 ½ on Th., March 30, 2017 U.S. Grain Sorghum Exports: Negative short term MY 2016/17 grain sorghum export shipments & neutral positive long term sales Weekly Export Shipments wk of 3/23/2017 for MY 2016/17 = 2.3 mb vs 4.94 mb/wk needed to meet USDA s March 9 th projn of 225 mb exports Total shipments through 3/23/2017 for MY 2016/17 = mb i.e., 49.5% of 225 mb USDA projn with 55.8% of MY complete (29/52 weeks) Total new sales (3/23/2017) for current MY 2016/17 = mb i.e., 67.1% of 225 mb USDA projn w. 55.8% of MY complete (29/52 weeks) World & U.S. Corn Supply Demand Fundamentals Mktg Yr World % S/U U.S. % S/U U.S. $/bu U.S. Crop 2007/ % S/U 12.8% S/U $4.20 /bu bln bu 2008/ % S/U 13.9% S/U $4.06 /bu bln bu 2009/ % S/U 13.1% S/U $3.55 /bu bln bu 2010/ % S/U 8.7% S/U $5.18 /bu bln bu 2011/ % S/U 7.9% S/U $6.22 /bu bln bu 2012/ % S/U 7.4% S/U $6.89 /bu bln bu 2013/ % S/U 9.2% S/U $4.46 /bu bln bu 2014/15 USDA 21.4% S/U 12.6% S/U $3.70 /bu bln bu 2015/16 USDA 22.0% S/U 12.7% S/U $3.61 /bu bln bu 2016/17 USDA 21.2% S/U 15.9% S/U $3.40 /bu bln bu 2017/18 USDA na 15.6% S/U $3.50 /bu bln bu U.S. Grain Sorghum Supply Demand Fundamentals $3.46 $3.09 $3.18 $3.15 $ /15 USDA 67.6 bu/ac US 4.0% S/U $4.03 /bu 433 mln bu 2015/16 USDA 76.0 bu/ac US 6.4% S/U $3.31 /bu 597 mln bu 2016/17 USDA 76.5 bu/ac US 7.9% S/U $2.70 /bu 480 mln bu 2017/18 USDA 67.1 bu/ac US 9.6% S/U **$3.00 /bu 362 mln bu 11 P age


12 IV. Wheat Market Outlook Daily MAY 2017 HRW Futures MAY 2017 KC Wheat (Daily) $4.17 ¼ on Th., March 30, 2017 Monthly Kansas HRW Wheat efutures Monthly KS HRW Wheat Futures Continuation Chart $4.71 MAY 2017 KC Wheat $4.27 ¼ on Th., March 30, 2017 $3.97 $4.27 Wheat Export Situation: U.S. All Wheat Exports: Bearish Short Term Export Shipments with neutralpositive long run export prospects in current MY 2016/17 total sales Weekly Export Shipments wk of 3/23/2017 for current MY 2016/17 = 18.2 mb vs 65.0 mb /wk needed to meet USDA s March 9 th projn of 1,025 mb exports Total shipments through 3/23/2017 for current MY 2016/17 = mb i.e., 72.7% of 1,025 mb USDA projn with 84.6% of MY complete (44/52 weeks) Total shipments + new sales 3/23/2017 for current MY 2016/17 = mb i.e., 94.0% of 1,025 mb USDA projn with 84.6% of MY complete (44/52 weeks) U.S. Hard Red WINTER Wheat Exports: Neutral negative Shipments with neutral long run prospects in current MY 2016/17 total sales Weekly Export Shipments wk of 3/23/2017 for current MY 2016/17 = 9.0 mb vs 13.2 mb /wk needed to meet USDA s March 9 th projn of 425 mb exports Total shipments through 3/23/2017 for current MY 2016/17 = mb i.e., 75.2% of 425 mb USDA projn with 84.6% of MY complete (44/52 weeks) Total shipments + new sales 3/23/2017 for current MY 2016/17 = mb i.e., 93.2% of 425 mb USDA projn with 84.6% of MY complete (44/52 weeks) Negative World & U.S. Wheat S/D Fundamentals Mktg Yr World % S/U World Crop U.S. % S/U U.S. $/bu U.S. Exports 2007/ % S/U mmt 13.2% S/U $6.48 /bu 1,263 mln bu 2008/ % S/U mmt 28.7% S/U $6.78 /bu 1,015 mln bu 2009/ % S/U mmt 48.6% S/U $4.87 /bu 879 mln bu 2010/ % S/U mmt 36.4% S/U $5.70 /bu 1,291 mln bu 2011/ % S/U mmt 33.4% S/U $7.24 /bu 1,051 mln bu 2012/ % S/U mmt 29.9% S/U $7.77 /bu 1,012 mln bu 2013/ % S/U mmt 24.2% S/U $6.87 /bu 1,176 mln bu 2014/ % S/U mmt 37.3% S/U $5.99 /bu 864 mln bu 2015/16 USDA 33.7% S/U mmt 50.0% S/U $4.89 /bu 775 mln bu 2016/17 USDA 33.7% S/U mmt 49.7% S/U $3.85 /bu 1,025 mln bu 2017/18 USDA na na 40.9% S/U $4.30 /bu 975 mln bu 12 P age


13 VI. Soybean Market Outlook Daily MAY 2017 Soybean Futures Key Soybean Supply Demand Issues: U.S. Soybean Exports: Neutral positive short run export shipments in MY 2016/17 and positive bullish total sales o Export Shipments for week of 3/23/2017 for current MY 2016/17 = 35.0 mb vs 13.5 mb/wk needed to meet USDA s March 9 th projn of bb exports o Total shipments through 3/23/2017 for current MY 2016/17 = bln bu i.e., 84.6% of bb USDA projn with 55.8% of MY complete (29/52 weeks) o Total new sales (3/23/2017) for current MY 2016/17 = bb i.e., 99.2% of bb USDA projn with 55.8% of MY complete (29/52 weeks) Monthly Soybean efutures $7.76 ¼ Daily MAY 2017 Soybeans $9.63 on Th., March 23, 2017 MAY 2017 Soybeans $9.63 on Th., March 23, 2017 $8.44 ¼ $9.63 U.S. Soybean Meal Exports: Bullish short run export shipments in MY 2016/17 and positive total sales o Export Shipments for week of 3/23/2017 for current MY 2016/17 = 430,000 mt vs 184,607 mt/wk needed to meet USDA s March 9 th projn of 10,520 mmt exports o Total shipments through 3/23/2017 for current MY 2016/17 = mmt i.e., 52.6% of mmt USDA projn with 48.1% of MY complete (25/52 weeks) o Total shipments & new sales (3/23/2017) for current MY 2016/17 = mmt i.e., 80.2% of mmt USDA projn with 48.1% of MY complete (25/52 weeks) World & U.S. Soybean Supply Demand Fundamentals Mktg Yr World % S/U World Crop U.S. % S/U U.S. $/bu U.S. Exports 2007/ % S/U mmt 6.7% S/U $10.10 /bu bln bu 2008/ % S/U mmt 4.5% S/U $ 9.97 /bu bln bu 2009/ % S/U mmt 4.5% S/U $ 9.59 /bu bln bu 2010/ % S/U mmt 6.6% S/U $11.30 /bu bln bu 2011/ % S/U mmt 5.4% S/U $12.50 /bu bln bu 2012/ % S/U mmt 4.5% S/U $14.40 /bu bln bu 2013/ % S/U mmt 2.7% S/U $13.00 /bu bln bu 2014/ % S/U mmt 5.0% S/U $10.10 /bu bln bu 2015/16 USDA 24.3% S/U mmt 5.0% S/U $ 8.95 /bu bln bu 2016/17 USDA 25.0% S/U mmt 10.6% S/U $ 9.60 /bu bln bu 2017/18 USDA na na 10.3% S/U $ 9.60 /bu bln bu 13 P age