USDA lowered the 2010/11 wheat carry out by 5 million and decreased 2010/11 Yield by.3 bushels/acre.
|
|
|
- Edwina McCoy
- 5 years ago
- Views:
Transcription


1 Tuesday November 9 th 2010 World Ag Supply & Demand Estimates Slightly Bullish for Corn More Bullish for Soybeans Friendly U.S. Wheat USDA lowered the 2010/11 corn carry out by 75 million and decreased 2010/11 Yield by 1.5 bushels/acre. The corn yield is.1 bushel below the average trade estimate. USDA lowered the 2010/11 soybean carry out by 80 million and decreased 2010/11 Yield by.5 bushels/acre. The soybean yield is.7 bushel below the average trade estimate. USDA lowered the 2010/11 wheat carry out by 5 million and decreased 2010/11 Yield by.3 bushels/acre.
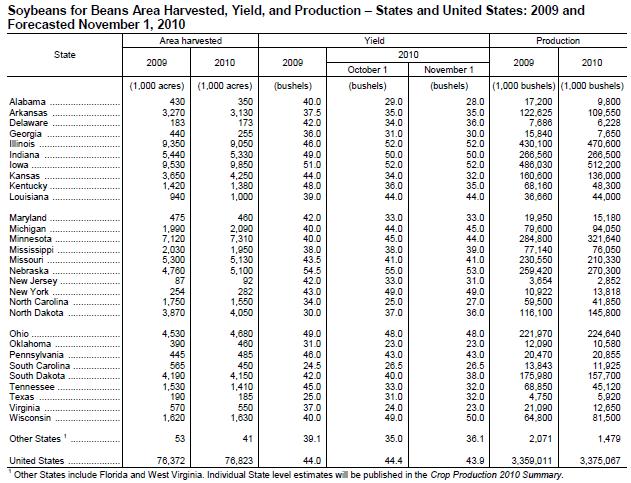
2 U.S. corn production for 2010/11 is forecast 124 million bushels lower as the national average yield is lowered to bushels per acre, down 1.5 bushels from the previous forecast. Feed and residual use is projected 100 million bushels lower with the smaller forecast crop and higher prices expected to reduce feeding. Exports are lowered 50 million bushels as higher prices trim export demand. Corn use for ethanol is raised 100 million bushels with record October ethanol production. Corn ending stocks for 2010/11 are projected 75 million bushels lower. At 827 million bushels, ending stocks would be the lowest since 1995/96 and represent a carryout of 6.2 percent of projected usage. Global coarse grain supplies for 2010/11 are projected 3.3 million tons lower reflecting reduced corn production in the United States, reduced barley production in China, and reduced oats and rye production in Russia. Global corn production is reduced 1.1 million tons as the U.S. decline is partly offset by a 2.0-million-ton increase for China on higher 2010/11 area. Corn production for China is also raised 2.0 million tons for 2009/10 based on an area increase of 800,000 hectares as indicated by official government statistics. Global 2010/11 barley production is lowered 0.8 million tons mostly on a 0.7-million-ton reduction for China on lower area and yields. Other barley changes include small reductions for Belarus and EU-27, and a 0.3-million-ton increase for Australia as abundant rainfall in eastern growing areas support higher yields. U.S. Oilseed Production for 2010/11 is projected at million tons, down 1 million from last month as lower soybean and cottonseed production are only partly offset by higher peanut production. Soybean production is forecast at billion bushels, down 33 million from last month. The soybean yield is projected at 43.9 bushels per acre, down 0.5 bushels from the previous estimate. Soybean exports are raised 50 million bushels to a record 1.57 billion due to increased global import demand and to a record sales pace, especially to China which accounts for over 70 percent of known U.S. soybean export sales through October. Soybean ending stocks are projected at 185 million bushels, down 80 million from last month. Global oilseed 2010/11 production is projected at million tons, up 0.1 million from last month. Increased soybean production is mostly offset by lower sunflowerseed, rapeseed, peanut, and cottonseed production. Global soybean production is projected higher with increases for Brazil, Argentina, India, and South Africa only partly offset by a reduction for the United States. Argentina soybean production is raised 2 million tons to 52 million due to increased area as producers respond to relatively high soybean prices. Brazil soybean production is projected at 67.5 million tons, up 0.5 million from last month due to increased area. Global sunflowerseed production is projected lower due to reduced estimates for Russia, Argentina, India, and EU-27. U.S. wheat ending stocks for 2010/11 are projected 5 million bushels lower this month as downward production revisions of 11 million bushels for Hard Red Spring (HRS) wheat and 4 million bushels for durum more than offset higher projected imports. Imports are raised 10 million bushels with increases for Soft Red Winter (SRW) wheat and durum. Exports are unchanged, but shifts among classes result in higher projected exports of Hard Red Winter and HRS wheat and reductions for SRW and durum. Global wheat stocks for 2010/11are projected higher as higher world production offsets lower carry in, mostly reflecting higher 2009/10 wheat feeding in China. World production is raised 1.5 million tons for 2010/11 as increases for Argentina, Australia, EU-27, and Paraguay more than offset reductions for FSU-12 and the United States. Argentina production is raised 1.5 million tons as favorable returns and timely rains boost area and yield prospects. Australia production is raised 1.0 million tons as rising yield prospects in eastern growing areas more than offset reductions from extended dryness in Western Australia. Production is raised 0.6 million tons for EU-27 mostly based on higher reported area for Poland. Production for Russia is lowered 0.5 million tons as harvest results indicate lower-than-expected yields in Siberia. Production is also lowered 0.5 million tons each for Azerbaijan and Kazakhstan as the latest reports confirm higher-than-expected yield losses from the extended drought across the region.

3 Corn U.S. Corn 2010/11 ending stocks forecast are estimated at 827 million bushels, 881 million bushels lower than the 2009/10 carry out for corn. USDA decreased expected production by 124 million and decreased demand by 50 million for reduction in the 2010/11 carry out by 75 million. The season-average 2010/11 farm price is projected at a range of $4.80 to $5.60 per bushel by raising the 2010/11 price by $0.20 on both the lower and upper end of the range. 2010/11 US ending stocks of 827 million bushel estimates provides for a 6.2 carry out as compared to a 6.7% Carry Out / Use ratio last month and represents 22 days of usage as compared to 24 estimated last month and 48 days for the 2009/10 crop. The early look is used to provide an idea that nearly 6 million more acres of corn may be needed next year to keep adequate corn stocks available using projected demand forecasts, and that is with a national average yield of 160 bu/acre. Expected higher prices should throttle back demand from the forecast levels shown above. However, USDA has not throttled back US meat production estimates for World corn carry out declines to mmt with a 15.4% stock to use ratio.
4 Soybeans U.S. Soybean 2010/11 ending stocks projected at 181 million a decrease of 80 million from last month but up 34 million as compared to 2009/10 ending stocks. USDA decreased yield.5 bushels/acre which decreased expected production 33 million and then also increased exports 50 million. The U.S. season-average farm soybean price for 2010/11 is projected at $10.70 to $12.20 per bushel raising the expected 2010/11 price range by $0.70 per bushel on both ends of the price range. Soybean meal prices are forecast at $310 to $350 per ton, up $30 and $20 from last month and compares to $311 per ton for 2009/10. Soybean oil prices are projected at 42.5 to 46.5 cents per pound, up 30.0 from last month and compares to cents for 2009/10. The 2010/11 ending stocks estimated of 185 million bushel provides for a 5.50% Carry Out / Use ratio for the 2010 crop year as compared to 8.0% last month and represents 20 days of usage as compared to 29 days last month and 16 days last year. World soybean carry out remains steady with last month at 61.4 mmt and a 24.1% stocks to use carry out ratio. The early look is used to provide an idea that we could give up 300 thousand acres of soybeans next year and with a good crop would have snug soybeans stocks available using projected demand forecasts. Expected higher prices should throttle back demand from the forecast levels shown above.
5 Wheat 2010/11 U.S. wheat ending stocks projected at 848 million down 5 million as USDA decreased yield.4 bu/acre decreasing production by 16 million bushels and increased imports 11 million. The U.S. season-average farm wheat price for 2010/11 is projected at $5.25 to $5.75 per bushel, up.05 on the lower end and down.05 on the higher end and compares with $4.87 per bushel in 2009/10. USDA stated that heavy early season marketings and forward sales limit upside potential for the season-average farm price. The U.S wheat carry out of 848 million is considered adequate to burdensome, however world supply is also decreasing compared to last year and at mmt it has been decreasing and is nearing the 2008/09 carry out of mmt. U.S. 2010/11 ending stocks estimated of 848 million bushel provides for a 34.7% Carry Out / Use ratio for the 2010 crop year as compared to 34.9% forecast last month and represents 127 days of usage as compared to 127 days forecast last month. The early look is used to provide an idea that we could have an increase of only 1.4 million more acres of wheat next year and keep adequate but snug wheat stocks available using projected demand forecasts. Expected higher prices should throttle back demand from the forecast levels shown above and expected higher corn prices will likely cut into planed spring wheat acres.

6 Year to Year Change Stocks / use ratio for corn currently at 6.1:1 the tightest ratio ever seen in a November report. Similar year was the 95 / 96 scenario which had a November ratio at 7.4:1 and ultimately was as tight as 3.7:1 in the May report.


7 Carry out Matrix The 2010/11 Corn Balance sheet matrix shows potential yield and acres scenarios. The 2010/11 Soybean Balance sheet matrix shows potential yield and acres scenarios. The 2010/11 Wheat Balance sheet matrix shows potential yield and acres scenarios. The RED highlighted matrix cells indicate stocks to use carry out ratio that typically has been considered tight.

8
9