Innovation Center for U.S. Dairy Sustainability Commitment Overview. Erin Fitzgerald January 3, 2015
|
|
|
- Brendan Robinson
- 5 years ago
- Views:
Transcription
1 Innovation Center for U.S. Dairy Sustainability Commitment Overview Erin Fitzgerald January 3,


2 Associations/Government Alliance Dairies Clauss Dairy Farms Fair Oaks Farms Fiscalini Farms Foster Brothers Farm Gar-Lin Dairy Farm Graywood Farm Haubenschild Farms Inc. Holsum Dairies Kooistra Farms Maddox Dairy MarBec Dairy Medeiros & Sons Dairy McCarty Family Farms Mystic Valley Dairy Nobis Dairy Prairieland Dairy Rovey Dairy Simonson Dairy Spruce Haven Farm Triple A Farms Werkhoven Dairy Suppliers Coops & Farmers Crop Production Dairy Processor Cheese Sustainability Council We commit to being leaders in sustainability, ensuring the health and well-being of our planet, communities, consumers and the industry Transport Community Retail & QSR 114 companies & 150 professionals in the Sustainability Council Leading 8 project teams with over 800 industry members contributing over $6M


3 Current reality competitors NGOs consumers customers government investors

4 Customers are setting sustainable sourcing goals 2014: 70% of suppliers have an approach 2015: 50% of suppliers can provide details 2016: Begin purchasing verified sustainable beef Shareholder resolution on sustainability reporting and addressing supply chain water Commitment to sustainably source dairy using the Guide by 2020 Unilever commitment to sustainably source by 2020 Nestle Responsible Sourcing Goals 3


5 Stewardship and Sustainability Stewardship = preservation and conservation doing good Sustainability = Preservation + enhance livelihoods + improve profitability doing good business 4

6 Single approach from Grass to Glass Credible, transparent and industry led. Program that is equal to or exceeds the competition while satisfying the demands of retail customers and dairy consumers. Demonstrate progress. Buyers and sellers seek proof that dairy from grass to glass uses practices that protect natural resources and promote community wellbeing and economic vitality. Mission: one approach. Create a voluntary method to track and communicate stewardship and sustainability progress. 5
7 Enhancing Consumer Trust Credibly Enhance Consumer Trust Stewardship & Sustainability Guide to track and communicate progress Share Best Practices and case studies to optimize performance Use Smart Tools to measure what matters Science to establish the baseline 6

8 What we learned: opportunities for efficiency and innovation across the value chain Drive Innovation 2.05 CO 2 e kg/kg fluid milk consumed Drive Efficiency 1 Does not include sources related to waste. 2 Greenhouse Gas Emissions of Fluid Milk in the U.S. University of Arkansas, Based on environmental and consumption data from Natural variability in data ranges from 15.3 to 20.7 lbs. CO2e. The total fluid milk carbon footprint is approximately 35 million metric tons, with a 95% confidence range from 30 to 45 million metric tons. 7
9 Lead: Combination of top down and bottom up 32 Dairy industry CEOs and chairpersons committed to 25% by 2020 GHG reduction for fluid milk $238 million Estimated business value across industry 8
 Renewed")

10 Lead: Be bold and a pilot for changes USDA Memorandum of Understanding (MOU) On December 15, 2009, Copenhagen, DK USDA recognized the work of dairy farmers and the entire industry with a Memorandum of Understanding (MOU) Renewed April 24, 2013, Washington, DC "This historic agreement, the first of its kind, will help us achieve the ambitious goal of drastically reducing greenhouse gas emissions while benefiting dairy farmers. " -- Secretary Tom Vilsack 9

11 Farm Smart -helping farmers to measure, mitigate, and communicate sustainable performance Smart Tools 10

12 Measure and communicate sustainability through the value chain Field Dairy Field Dairy Milk Cooperative Field Dairy The Innovation Center and Industry have tested the tools on 1.6% of total U.S. milk production and 1.4% of cows! This is one of the largest tests that has occurred within the agriculture standards Transportation Retail Processing 11


13 Communicate progress to stakeholders Outstanding Dairy Farm Sustainability Prairieland Dairy Firth, Neb. View all of the 2013 winner videos at 12
14 APPENDIX 13
15 The need for a sustainable food system Satisfy human food, feed and fiber needs, and contribute to biofuel needs Enhance quality of life for farmers, farm workers and society as a whole Sustain economic viability of agriculture Enhance environmental quality and the resource base (nutrients such as nitrogen and phosphorus) Social Quality of Life Food Feed Fiber Biofuel Healthy Food Economic Viability Environmental Quality
16 One out of three food calories is wasted 29% of America s food supply was lost from human consumption Estimated total value at retail and consumer levels was $165.6 billion 273 pounds of food per person Disposal costs add one billion dollars in local taxes annually Added sugar & sweeteners 3% Food waste by retail value ($165.6B total) Grain products 6% Eggs 2% Added fats and oils 7% Dairy products 14% Fruit 9% Vegetables 17% Tree nuts & peanuts 1% Meat, poultry, & fish 41% Source: J. Buzby, and J. Hyman. Total and per capita value of food loss in the United States, Food Policy, 37(2012):
 2 tons/week Nutrients (N & P) What if 2 tons/wk food waste")
 226 tons Nitrogen 28 tons Phosphorus Green Power for")
17 What if 2 tons/wk of food waste were repurposed? 17 tons Nitrogen 1.3 tons Phosphorus (Annual Values) 2 tons/week Nutrients (N & P) What if 2 tons/wk food waste added to manure digester? 2 tons/week Dairy digester (1,000 cows) 226 tons Nitrogen 28 tons Phosphorus Green Power for 3 homes (Annual Values) Source: Frear et al, 2011 Clean Soil, Air, water 2011, 39 (7),


18 Manure & Food Waste: 2,700 deployed digesters with food waste could reduce overall U.S. Dairy footprint by 25% and generate eco system benefits from repurposing food waste Reduces total landfill by 8% 15 M tons commercial & retail food waste 70% of retail waste 4.8 M tons food processing waste 109 M tons dairy cow manure 813 M bags of nutrient rich potting fiber 3.2 M cars off the road Or 25% of total dairy footprint Electricity for 1 M homes Nitrogen fertilizer for 5% of corn production Phosphorus for more than all U.S. tomato production 17

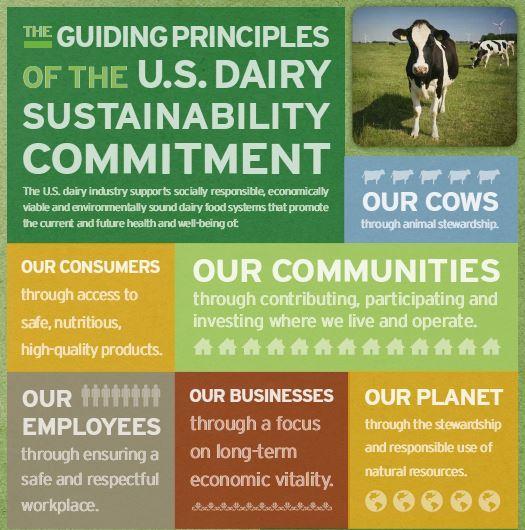
19 Guiding Principles align on a vision for the industry The U.S. Dairy Industry supports socially responsible, economically viable and environmentally sound dairy food systems that promote the current and future health and well being of: We commit to these principles through our shared values of honesty, integrity, inclusiveness, and transparency Our consumers through access to safe, nutritious, high-quality products. Our communities through contributing, participating, and investing where we live and operate. Our cows through animal stewardship. Our employees through ensuring a safe and respectful workplace. Our planet through the stewardship and responsible use of natural resources. Our businesses through a focus on longterm economic vitality. 18

20 About the Dairy Industry

21 How one cow contributes to a sustainable food system 20
22 Review case study of supply chain trying out the guide and tools 1t3 21

23 Key findings: carbon footprint, all products 22
24 Measurement: Understand business drivers 23

25 Lead: Industrywide leadership from farm to table 24

26 Phase II farm indicator development Phase II development in 2014 by national and regional taskforce teams National Teams: Review and refine previous work to develop indicators and aggregate regional team recommendations. Topics covered: Work Force Resource Recovery Soil Health Community Engagement Water Biodiversity Regional Teams: 6 Regional Teams to develop indicators and metrics that will cover water, resource recovery, and soil health January Present to Innovation Center Board 25

27 Key findings: dairy uses ~5.1% of U.S. water withdrawal 26

28 27

29 Key finding: water is a local issue impacted by both water supply and watershed characteristics FPCM: fat and protein corrected milk Water stress index: liter in competition P impact: Phosphate eutrophication impact N impact: Nitrate eutrophication impact 28
30 Dairy Water Impacts: Know Your Operation Water issues are largely dependent on local or regional conditions Consequently, some operations will be more significantly affected by quality issues than quantity issues, and vise versa Producers should be aware of their major impacts and risks and pay particular attention to the practices that will mitigate those risks 29
31 What we learned: management practices matter Increasing feed efficiency Reducing enteric methane Improving manure management Reducing electricity usage Consolidating distribution network Considering alternative packaging materials Good truck maintenance Better route design Reducing long distance milk hauling The basis for differences is best management practices not size, region or age. 30
32 Dairy LCA key implications to the industry Variability means opportunity Focus on what matters BMPs can improve environmental footprint of virtually all farms and businesses 31