Between a Rock and a. Hard Place. Corn Profitability
|
|
|
- Bryan Cunningham
- 5 years ago
- Views:
Transcription

 Nielsen")

1 Corn Profitability Between a Rock and a Image source: Hard Place RL (Bob) Nielsen Extension Corn Specialist Purdue Agronomy v Purdue University 1


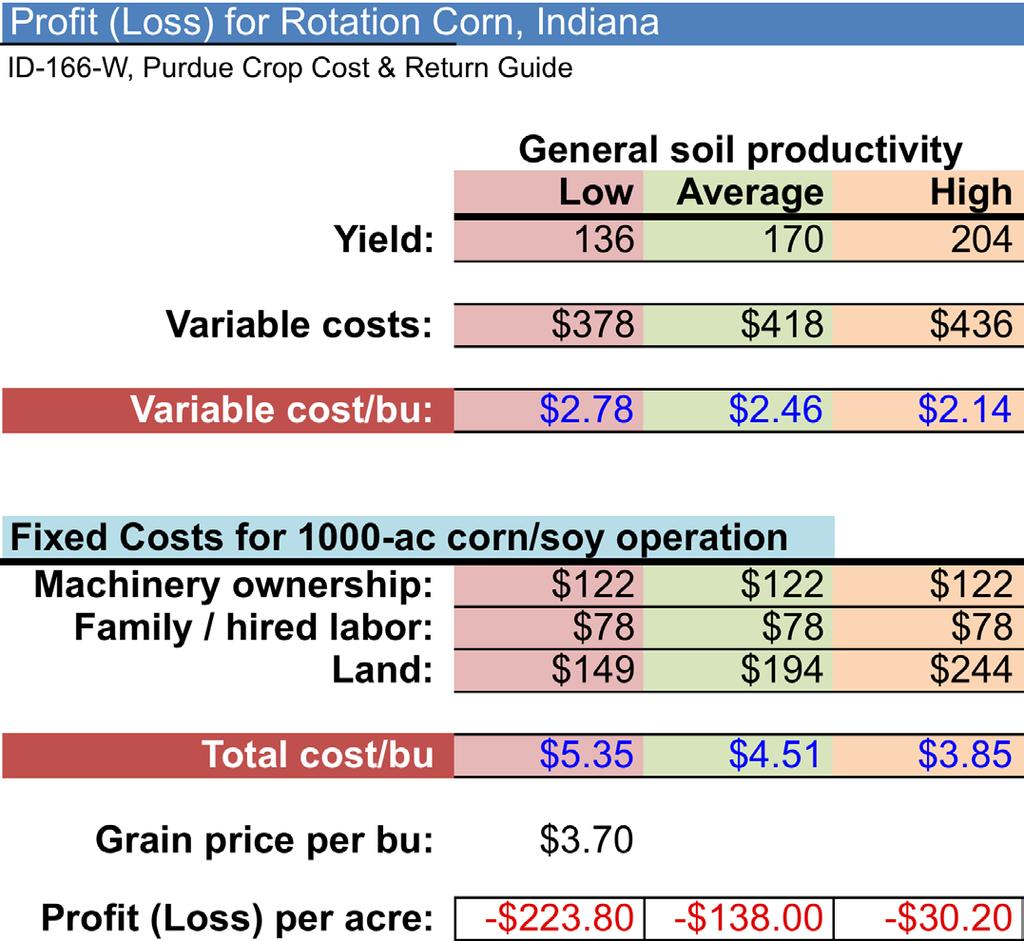
2 The challenge today COST PER Price per bu BUSHEL v Purdue University 2

3 v Purdue University 3


4 Total cost per bushel can be reduced Fixed cost Var. cost Divided by Yield Cost per bushel Decreasing fixed costs of production Decreasing variable costs without significantly reducing yield Increasing yield without significantly increasing variable costs v Purdue University 4


5 Variable Input Costs Fertilizer Lime, N, P, & K Seed Cost / bag & rate Pesticides Approx. 70% of total variable costs for rotation corn in Indiana Even higher if foliar fungicide is used v Purdue University 5

6 16 25 Add ~ $30 for foliar fungicide application Variable Costs for Rotation Corn on Avg. Productivity Soils Replacement P & K plus lime lbs/ac N; $508/ton 49 33,000 $293/80k bag N fert Other fert Seed Pesticide Dryer fuel Mach. Fuel Mach. Repairs Hauling Interest Insurance etc v Source: Dobbins et al Purdue Crop Cost & Return Purdue Guide, University ID-166-W (Oct 16) 6

7 Nitrogen cost per bushel Cost varies among N fertilizer sources by upwards of $0.10 per bushel Cost per lb N: AA < Urea < UAN v Purdue University 7

.")


8 Soil N loss occurs in wet soils either by denitrification (heavier soils) or leaching (sandier soils). Consequently, N cost per bu increases if yields are reduced or you over-apply N fertilizer to avoid yield loss. v Purdue University 8 Image source: RLNielsen

 N applic s Avoid UAN or urea")
9 Minimize risk of N losses.. Improve tile or surface drainage to reduce risk of soil nitrate-n losses Focus on late pre-plant N applic s, split-applic s (pre-plant + sidedress), full sidedress, or fertigation N applic s Include inhibitors where appropriate Avoid fall-applied anhydrous ammonia Avoid early spring (March) N applic s Avoid UAN or urea broadcast without incorporation (i.e., volatilization loss) v Purdue University 9

10 The right rate of N fertilizer varies year by year because grain price & N cost vary year to year AND the available soil N varies year by year. v Purdue University 10 Image source: RLNielsen

11 Predicting the right N rate every year is a challenging puzzle because it is difficult to accurately predict soil N levels. Soil tests have their limitations. Stalk nitrate sampling has its limitations. Nitrogen models have their limitations. Crop reflectance tools have their limitations. v Purdue University 11


12 So, is there a practical alternative? Even though soil N availability varies year to year, we can use the results of sound field research to identify good ballpark estimates of optimum N rates that best maximize dollar returns. v Purdue University 12


13 Field scale trials More than 250 field scale trials since % are farmer trials Most are sidedress About 80% UAN 76% rotation corn 12% sandy soils 4% irrigated v Purdue University 13
14 Summary available online v Purdue University 14
 202 208 212 193 184 190 Non-irrig.")

15 Total applied N (lbs / ac) Agronomic vs. Economic N Rates* Corn following soybean (no manure) Non-irrig. * Total N, incl. starter N Medium- & fine-textured soils Sandy SW/SC/SE/WC NW/NC C EC NE Camberato & Nielsen, Purdue, ~ 180 trials statewide, $3.50 corn, $0.30 N v Purdue University 15


16 Tri-State Fert. Recs. In Search of Profits CONSIDER DELAYING P & K APPLICATIONS v Purdue University 16


17 Soil Test Philosophy Tri-State Fert. Recs. High Recommended fertilizer rate Feed the crop and build up soil test values Critical level e.g., P = 15 ppm Maintenance plateau Replace what the crop removes and maintain soil test levels Maintenance limit e.g., P = 30 ppm Draw down the soil test levels Low Soil test values v Purdue University 17 High


18 Key consideration Tri-State Fert. Recs. High Critical level e.g., P = 15 ppm Maintenance limit e.g., P = 30 ppm Recommended fertilizer rate Yield response to additional P & K Maintenance plateau No yield response expected to additional P or K beyond the critical level Low Soil test values v Purdue University 18 High

19 So, when $$ are limited Applications of P and K fertilizers can be delayed with little risk of yield loss, IF. Soil sampling has been done within the last few years AND Soil test nutrient levels are WELL within the maintenance ranges or beyond. Soil test levels for P and K change slowly, so there is little risk of fields rapidly becoming deficient. v Purdue University 19
20 In Search of Profits SEED COST Seed catalog, ca. 1913, Source: v Purdue University 20

21 Seed cost PER ACRE is influenced by cost per bag and seeding rate v Purdue University 21


22 Seed cost PER BUSHEL is more difficult to predict Key considerations Cost per bag of seed Transgenic traits? Genetic yield potential Genetic stress tolerance Other considerations Seed quality Customer service Seed catalog, ca. 1913, Source: v Purdue University 22

23 Non-GMO hybrids are cheaper: Risky or not? v Purdue University 23

24 Not an easy answer After all, there is no clear yield advantage to transgenics v Purdue University 24
25 Not an easy answer No clear yield advantage to transgenics Insect-resistant transgenics (Bt traits) target mainly rootworm & European corn borer; lesser control for earworms or Western bean cutworm. Predicting need for control is difficult Herbicide tolerant transgenics (glyphosate, glufosinate) broaden weed control options v Purdue University 25


26 If the Bt lingo confuses you v Purdue University 26

27 Remember that hybrid selection influences both yield and variable cost Yield Price Var. Cost Contrib. margin Your ability to identify good hybrids can easily add 20 to 30 bu/ac to your bottom line. Do not underestimate the importance of this agronomic decision. v Purdue University 27
28 Hybrid selection is not simply about genetic yield potential But, also the ability of hybrids to perform consistently well across a wide range of growing conditions (i.e., stress tolerance). Tolerance to a wide array of stresses is important because we cannot accurately forecast next year s growing conditions. v Purdue University 28

29 A Good Indicator of Hybrid Stress Tolerance: Hybrid performance in as many variety trials as you can find within a given geographic region. Multiple trials provide a range of growing conditions that your fields may experience in the future. Look for hybrids that consistently yield near the top of the majority of the trials. v Purdue University 29

30 Hybrid traits & Crop resilience Emergence & seedling vigor Early season soils often wetter & cooler Resistance to important diseases Seedling disease, stalk & ear rots Excellent foliar disease resistance minimizes the need for foliar fungicide Stalk & root health Overall stalk strength Drought tolerance Overall stress tolerance v Purdue University 30 Image: National Archives


31 Reduce seed costs by choosing seeding rates wisely v Purdue University 31 Image source: RLNielsen

32 Purdue plant population trials Since 2008, we ve conducted ~ 90 field scale trials around the state. Majority were on-farm trials. Trials ranged in size from 30 to 100 acres. Various hybrids, but 27 trials were split-planter hybrid comparisons, purposefully chosen. Few irrigated trials But honestly, response is probably similar to high-yield rain-fed conditions v Purdue University 32

33 Summary available online v Purdue University 33
34 Bottom line on plant population Two sweet spots for plant population that maximize corn yield in Indiana. Challenging soils: Low 20 s FINAL stand Routinely yielding less than ~ 130 bu/ac Productive soils: Low 30 s FINAL stand Within range of ~ 140 to 240 bu/ac However, considering that seed ranges from $2.50 to $3.75 per thousand seed v Purdue University 34

35 250 Yield Response to Population 200 +/- 1 bu/ac Grain yield (bu/ac) /- 1 bu/ac Plant population (plants/ac) Purdue Seeding Rate Trials, Because the yield response curves are so flat near the agronomic optimums, economic optimum populations are several thousand lower. v Purdue University 35


36 Weed Management Know which weeds you are dealing with and which herbicides control them Be timely with herbicide applications relative to weed size Recognize & identify resistant weeds Do not rely solely on post-emergence herbicide applications v Purdue University 36 Image Purdue Univ; RLNielsen

37 Mix / match herbicide activity v Purdue University 37
 are also common problem Stalk rots often a problem when grain fill conditions are challenging Almost all overwinter on old corn residues v20161212 Purdue University 38 Image Purdue Univ;")
38 Disease Management Know your diseases, send samples to PPDL to confirm diagnoses Most important foliar diseases for corn in Indiana are GLS, NCLB, Goss s Wilt Ear rots (diplodia, gibberella, fusarium) are also common problem Stalk rots often a problem when grain fill conditions are challenging Almost all overwinter on old corn residues v Purdue University 38 Image Purdue Univ; RLNielsen


39 Minimize risk of foliar diseases Also ear & stalk rots Also ear & stalk rots Avoid corn following corn Consider tillage Also ear & stalk rots Hybrids with disease resistance Manage diseases Foliar fungicides Not for Goss s Wilt or the rots v Purdue University 39


40 In search of profits MINIMIZE HARVEST LOSSES 1 bushel = 12 kernels in a 30 by 30 square 20 to 25 bu/ac loss >>>>>> v Purdue University 40


41 In search of profits AVOID UNNECESSARY INPUTS If it sounds too good to be true, it probably is. Ask for comprehensive trial data. If in doubt, contact a reputable agronomist. v Purdue University 41
 Sound agronomic decision-making v20161212 Purdue University 43 Image Purdue Univ,")
42 Increasing crop resilience against extreme weather involves Identification & mitigation of field-specific Yield Limiting Factors (YLFs) Sound agronomic decision-making v Purdue University 43 Image Purdue Univ, RLNielsen