Carbon Trading and Policy Issues: New Opportunities for Climate Change Mitigation
|
|
|
- Ilene Gibbs
- 5 years ago
- Views:
Transcription
1 Carbon Trading and Policy Issues: New Opportunities for Climate Change Mitigation SARE Carbon, Energy, and Climate Conference September 26, 2012 Phil Robertson Dept. of Plant, Soil, and Microbial Sciences and W.K. Kellogg Biological Station Michigan State University


2 Strategies to Stabilize Atmospheric CO 2 Agriculture s Role Strategies Reduce fossil Fuel consumption Identify CO 2 sinks and sequestration rate Reduce Non CO 2 Greenhouse Gases Improve efficiency Renewable energy sources Terrestrial Aquatic Geologic Agriculture Industry Soils Plants Soils Animals Adapted from C. Rice
3 Contemporary Global CO 2 Budget Source/Sink (Pg C / y) Sources Emissions from fossil fuels Emissions from deforestation Total Sources Pg C y Sinks Atmospheric increase Oceanic uptake Terrestrial Uptake Total Sinks Pg C = g C = GT C = 1000 MMT C Source IPCC (2002); Canadell et al PNAS
4 A Portfolio of Potential CO 2 Stabilization Options Minor Contributors <0.2 PgC/y Rapidly Deployable Biomass co-fire electric generation Cogeneration (small scale) Hydropower Natural Gas Combined cycle Niche options (geothermal, small scale solar) Not Rapidly Deployable Integrated photovoltaics Forest management (fire suppression) Ocean fertilization Major Contributors >0.2 PgC/y Carbon sequestration in agricultural soils Improved appliance efficiency Improved buildings Improved vehicle efficiency Non-CO 2 gas abatement from industry Non-CO 2 gas abatement from agriculture Reforestation Stratospheric sulfates Biomass to hydrogen Biomass to fuel Cessation of deforestation Energy-efficient urban and transportation systems Fossil-fuel C separation with geologic or ocean storage High efficiency coal technology Large-scale solar Next generation nuclear fission Wind with H2 storage Speculative technologies (space solar, nuclear fusion, etc.) Caldeira, Morgan, Baldocchi, Brewer, Chen, Nabuurs, Nakicenovic, & Robertson A portfolio of carbon management options, p , In C. B. Field and M. R. Raupach, eds. The Global Carbon Cycle. Island Press, Washington, DC.

 Slowing decomposition (no-till)")
5 Historical Soil Carbon Loss from Cropping Systems locally 40-60% of original C lost after years of cultivation in North America globally 54 Pg C from an original 222 Pg C (about 25%) potential for recovering Pg C y -1 Increasing C inputs (crop residues, cover crops) Slowing decomposition (no-till) Source: Lal 1999, Smith 2004, IPCC 2002, Grace et al. 2006


6 How to Restore Soil Carbon? 1. Increase C inputs to soil Cover crops Rotations Residue quantity 2. Decrease C loss from soil (slow decomposition) Tillage reduction Residue quality
7 MSU EPRI Nitrous Oxide Reduction Protocol Partner Utilities American Electric Power Detroit Edison Co. Duke Energy Hoosier Energy Rural Electric Coop Oglethorpe Power Corporation PNM Resources Inc. Salt River Project Southern California Edison Tri State Generation and Transmission Coop
8 From IPCC (2001) Atmospheric concentrations of the biogenic greenhouse gases (CO 2, methane, and nitrous oxide) from 1000 A.D.
9 Global Warming Potential (GWP) Biogenic Gases Lifetime yr Global Warming Potential 20 yr 100 yr 500 yr CO 2 variable CH N 2 O Source: IPCC 2002; 2007

10 Atmospheric N 2 O from 1976 N 2 O The contemporary N 2 O increase is largely due to agricultural intensification small mass but large global warming potential with a total annual impact ~ 1.2 Pg C equiv (compare to fossil fuel CO 2 loading = 4.1 PgC per year) Industry is responsible for ~16% of the anthropogenic source Agriculture for the remainder with most of the agricultural increase (~60%) from cropped soils Agriculture Source IPCC 2001, 2007; Prinn 2004; Robertson 2004
11 KBS Long-Term Ecological Research (LTER) Site Ecosystem Type Management Intensity Annual Grain Crops (Corn - Soybean - Wheat) Conventional tillage High No-till Low-input with legume cover Organic with legume cover Perennial Biomass Crops Alfalfa Hybrid poplars Unmanaged Communities Early successional old field Mid successional old field Late successional forest Low
")

12 Sources of Global Warming Impacts in KBS Cropping Systems ( ) Annual Crops Perennial Crops Robertson et al. 2000; Gelfand et al. in review.
 Bouwman et al. 1996 Robertson et al. 2000; Bouwman et al.")
13 Nitrous oxide fluxes are generally predictable based the amount of N cycling in the system Basis for IPCC National Greenhouse Gas Inventories: IPCC N 2 O Tier 1 Emission Factor Emission Factor IPCC 2006 Tier 1 Linear Emission Factor EF = 1.0% ( %) Bouwman et al Robertson et al. 2000; Bouwman et al. 1996; IPCC 2006
14 Sources of N 2 O in soil Terrestrial Nitrogen Cycle Robertson & Groffman 2007


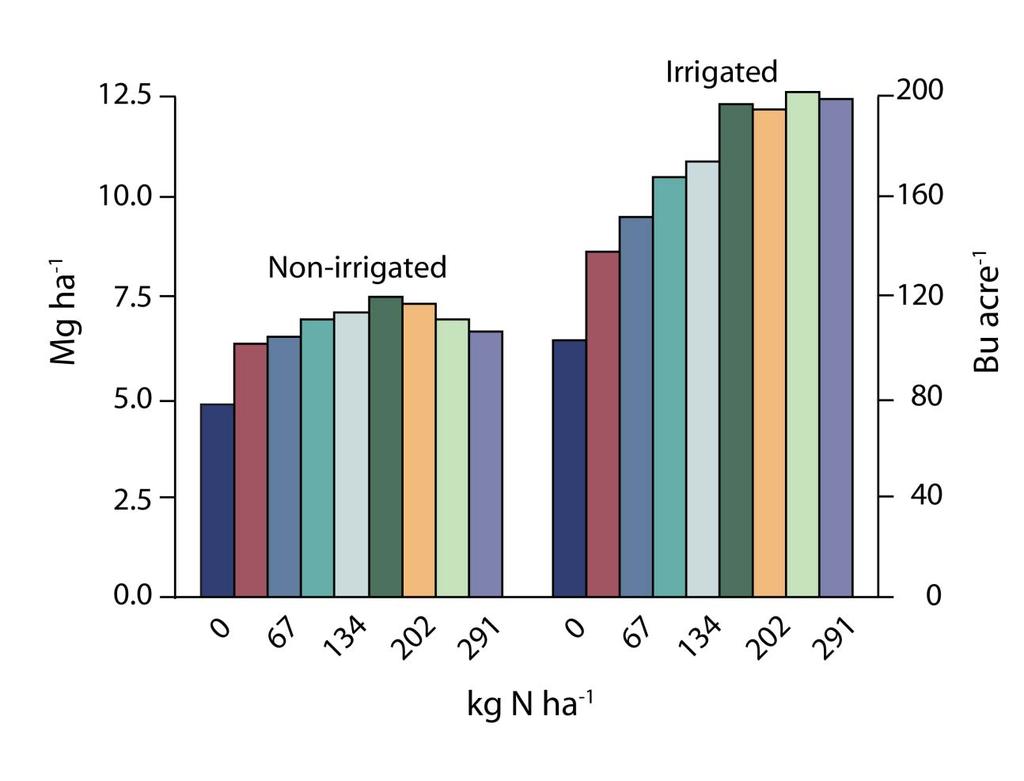
15 KBS corn yields at different N rates (2008)
16 N 2 O fluxes across different N rates (KBS 2010 wheat) Emissions factors vary with N rate especially above crop optimum Millar et al., submitted
17 N 2 O flux crop yield (KBS 2005 corn) 80 N 2O Flux (g N 2O-N ha -1 day -1 ) kg N kg N N 2 O fluxes accelerate at N fertilizer rates greater than yield response Implication N 2 O savings can be substantial where fertilizer rate exceeds crop needs Yield (Mg grain ha -1 ) Millar et al. 2012; McSwiney & Robertson, Global Change Biology, 2005.
 0 45 90 135 180 225 N 2 O emissions (kg N 2 O-N ha -1 yr -1 ) 3000 3.0 2500 2.5 2000 2.0 1500 1.5 1000 1.0 N 2 O emissions = 0.67 * exp (0.0067 * N rate) KBS Hoben et al.")
18 Cross state test of non linear N 2 O response to N fertilizer Cummulative N2O (g N2O N ha 1 ) Fairgrove, MI Days After Fertilization N Fertilizer (kg N ha 1 ) N 2 O emissions (kg N 2 O-N ha -1 yr -1 ) N 2 O emissions = 0.67 * exp ( * N rate) KBS Hoben et al., 2011, Global Change Biology Fertilizer rate (kg N ha -1 yr -1 )
19 Implications for N 2 O reductions for a given N rate reduction For a given N rate reduction, very different N 2 O outcomes N rate reduction (50 kg N)


20 N 2 O fluxes across different fertilizer rates Emissions factors vary with N rate especially above crop optimum Potential Carbon Credit Crop Yield Optimum N Fertilizer Rate Millar et al., submitted


21 Carbon Trading and Offsets Offset traded Baseline GHG emissions Before After Before After Practice Change Offset provided Regulated or Voluntary entity Electric Power Plant Green Retailer Offset provider Agriculture
22 Emerging Offset Opportunities Benefits Reduce agricultural GHGs Reduce reactive N release to the environment Incentivize conservation using current technology Incentivize new technology Carbon Market Issues Baseline establishment N2O flux prior to the crediting period must be known Permanence the GHG savings must be permanent No Additionality the savings must be greater than what would otherwise occur No Leakage the savings in one location must not create greater losses elsewhere


23 How to reduce N fertilizer rates without affecting yields Sources of information used by Michigan farmers to determine nitrogen fertilizer application rates to corn % Getting Information From Source % Using as Most Important Source Fertilizer dealers Seed company agronomist University recommendations Other farmers Magazines Private consultant Other D. Stuart et al (submitted)
 Simplest = better estimating crop N needs using new US corn belt")
 Mean Return to Nitrogen (MRTN) Calculator http://extension.agron.iastate.")
24 How to reduce N fertilizer rates without affecting yields Various technologies related to 4 R s (rate, timing, placement, formulation) Simplest = better estimating crop N needs using new US corn belt calculators Percent of Maximum Yield (%) MRTN Rate N fertilizer rate (lb N acre 1 ) Mean Return to Nitrogen (MRTN) Calculator
25 EPRI-MSU N 2 O Offset Protocol Guiding Principles Simple To understand and to implement Transparent No gaming opportunities Scientifically robust Peer reviewed, accepted Widely applicable Different climates, soils, crops Economically powerful Sufficient incentive to implement
26 EPRI MSU N 2 O Offset Protocol Eligibility Requirements Fertilizer Type Synthetic N (e.g., readily soluble, single or multi nutrient) Organic N (e.g., animal manure, compost, sewage sludge) All N inputs are considered equal irrespective of source Fertilizer Management Deliberately and directly applied to the soil as external source Farmers can reduce by any means that works for them Need to adhere to Best Management Practices (BMPs) of the region
27 EPRI MSU N 2 O Offset Protocol Eligibility Nitrous Oxide Emissions Direct produced on site from farmer s field Indirect produced off site from project fertilizer. Includes N 2 O produced in waters and soils as a result of NO 3 leaching and NH 3 volatilization. Geographic Location and Calculation Method Method 1: Tier 1 straight percentage is applicable to cropland anywhere Method 2: Tier 2 enhanced nonlinear percentage is applicable to corn cropland within the US North Central Region
28 EPRI MSU N 2 O Offset Protocol Baseline Calculation Approach 1: Site Specific Baseline determined from management records for previous 5 years crop rotation Management records include N fertilizer purchase and application rate data, as well as manure application rate and manure N content data. Approach 2: County average Baseline calculated from crop yield data at the county level and equations for determining fertilizer N rate recommendations based on yield goal estimates Used if management records not available
29 EPRI MSU N 2 O Offset Protocol Permanence and Leakage Permanence Avoided N 2 O emissions occur immediately irreversible and permanent. No permanence concerns Reserve pool non permanence risk analysis Producer aggregation collective persistence of credits Leakage Land maintained in production prior to implementing project No yield reductions no yield compensation no additional N use No market leakage
 Cost of better fertilizer management 2.")
30 Conclusions Carbon Credits for Better Nitrogen Management 1. Experiment in progress no guarantees that will pay off Farmers willingness to participate Price of carbon (market now voluntary, soon to be compliance) Cost of better fertilizer management 2. Potentially a triple win: For electric industry more available credits means lower costs For farmers payments to manage fertilizer more precisely, which has information and technology costs For the environment abates N 2 O as a climate change gas without affecting food security, and also provides co benefits for other types of reactive nitrogen e.g. nitrates