ABSTRACT. Honey bee (Apis mellifera) colonies were equipped with pollen traps obtained
|
|
|
- Mervyn Golden
- 5 years ago
- Views:
Transcription
1 ABSTRACT RUBINSTEIN, JOSHUA MICHAEL. Pollen traps as a beekeeping integrated pest management tool: Their use in IPM for varroa mite control and for reducing the impact of microencapsulated pesticides on honey bee colonies. (Under the direction of John T. Ambrose.) Honey bee (Apis mellifera) colonies were equipped with pollen traps obtained from the CC pollen company. One set of studies compared bee deaths and pesticide residues in pollen trap-treated colonies with untreated control colonies placed near agricultural fields that were sprayed with microencapsulated methyl parathion (Penncap- M ). A second set of studies examined the effect of the pollen traps on varroa mite (Varroa destructor) populations compared with mite populations in control colonies that were treated with the labeled chemical treatment for varroa mites. Pesticide Studies: The pesticide studies were in response to the problem of bee deaths due to poisoning by microencapsulated methyl parathion. The microcapsules are in the size range of pollen grains and poisoning became a problem in fruit orchards where the pesticide drifted onto blooming ground cover where it was accidentally collected along with pollen by foraging honey bees. The studies showed that the microencapsulated pesticide persisted on orchard ground cover (clover) for several days after the pesticide was sprayed. The pesticide was also in the pollen loads that were removed from foragers by the pollen traps, and in the bees that were dying as a result of the pesticide spray. The presence of the pollen traps did not significantly reduce bee deaths or pesticide residues in the treated colonies. The pesticide studies also showed that under drought conditions, blooming orchard ground cover plants such as clover may be sufficiently unattractive to foraging
2 honey bees to prevent the expected pesticide poisoning that would normally occur after a Penncap- M spray. In such cases drought may be an IPM tool for managing bee colonies in some potentially dangerous agricultural settings. Varroa mite studies: The varroa mite studies were in response to the enormous problem of the varroa mite parasite which, over the past twelve years, has killed virtually all feral honey bee colonies and reduced the number of managed colonies by a third. Although there are chemical treatments available for varroa mite control, there are problems with their use such as the development of resistant mites and the contamination of honey and bees wax. Pollen traps removed large numbers of varroa mites from the bee population, but the removal was slower than chemical treatment so that the mites in pollen trap-treated colonies continued to reproduce. In many instances, mite levels remained below the established economic treatment threshold when the pollen traps were used in July and August. However, when pollen traps were used in December and January, mite levels were in all cases above the treatment threshold. These results show that pollen traps do have a value in varroa mite IPM. Future studies should examine the effect of pollen traps on varroa mite populations when the traps are used earlier in the year to prevent or reduce the chance that mite levels will reach economic threshold levels.
3
4 BIOGRAPHY The author was born on March 3, 1971, in Ridgewood, New Jersey. He received his elementary and secondary education in Westwood, NJ and graduated from high school in He received his B.S. in Biology in 1993 from Union College in Schenectady, New York. In 1996 he enrolled in the entomology program at North Carolina State University and has since been working towards a Masters of Science in Entomology degree with a minor in Horticulture. ii
5 ACKNOWLEDGEMENTS I would like to thank the many people who helped me to complete this project. I would like to thank Dr. Ron Kuhr and Dr. Mike Parker who served on my graduate committee. Special thanks go to my advisor, Dr. John Ambrose. His guidance and patience as a mentor were essential to the completion of this project. I would also like to thank the North Carolina State Beekeepers Association (NCSBA) for their support. Financial support obtained by the NCSBA with the assistance of the apicultural program at N.C. State University and the NCDA & CS (NCARS Project 6355) made this work possible. Thanks also to fellow students Mike Stanghellini and Jennifer Keller for their valuable help and suggestions. Special thanks go to Dr. Mike Hood of Clemson University for his assistance at the Simpson research farm, to Ross Leidy for carrying out pesticide residue analysis, to Dr. Cavell Brownie for her invaluable work on statistical analysis and to Kenny Barnwell and Ed Buchanan for providing bee colonies for research in Henderson County. Thanks also to the people at the Clayton research station and especially to the members of the N.C. State Beekeepers Association for all of their support and encouragement. I also received immeasurable love and support from my parents Angela and Benjamin, my sister Sarah and from my girlfriend Jennifer Lavonier. iii
6 TABLE OF CONTENTS Page List of Tables.vi List of Figures.. vii Introduction....1 Literature Review..4 Importance of honey bees Introduced pests of honey bees and recent problems Biology of varroa mites The origin of the varroa mite and its introduction to Apis mellifera The spread of varroa mites. 10 Damage caused by varroa mites Consequences of varroa mite infection.. 12 Chemical control Genetic resistance Essential oils Environmental control Bottom boards and pollen traps Trap comb and pupae destruction Integrated pest management for varroa control Pesticide poisoning of honey bees Microencapsulated methyl parathion Microencapsulated pesticides in North Carolina...29 Pollen traps...31 iv
7 Manuscript 1: Pollen Traps for the Reduction of Honey Bee Deaths due to the Use of Microencapsulated Pesticides..33 Introduction.. 33 Materials and Methods Results Discussion List of References Manuscript 2: Traps as a Tool for Varroa Mite Control Introduction Materials and Methods Results Discussion List of References.. 79 General References Appendices 89 Appendix A. Pesticide Residue Analysis Results for Study 1, Appendix B. SAS Statistical Analysis Output..99 v
8 LIST OF TABLES Page MANUSCRIPT I. Table 1. Penncap-M (methyl parathion) pesticide analysis of bees in Henderson County, N.C. August, Table 2. Dead bee and weather data for Penncap-M study Clemson, S.C. 16 June, June, Table 3. Dead bee and weather data for Penncap-M study Clemson, S.C. 2 June, June, Table 4. Dead bee and weather data for Penncap-M study Clemson, S.C. 8 July, July, Table 5. Pesticide residue analysis for pollen-trap pollen, dead bees and clover with log10 transformed values: Clemson, S.C. study - July, Table 6. Dead bee and weather data for Penncap-M study Edneyville, N.C. 12 August, August, Manuscript II. Table 1. Effectiveness of pollen traps compared with Apistan for Varroa mite control on honey bees study Table 2. Effectiveness of pollen traps compared with Apistan for Varroa mite control on honey bees study vi
9 LIST OF FIGURES MANUSCRIPT I. Page Figure 1. Pollen trap with open collecting drawer and arrows pointing to modified bee exits. 36 Figure 2. Pesticide analysis of bees from Henderson County, N.C. - August, Figure 3. Pesticide residue on clover sampled near hives in Clemson,S.C. - July, Figure 4. Average pesticide residue in pollen from pollen traps in Clemson, S.C. - July, Figure 5. Average pesticide residue on dead bees from pollen trap-treated and control colonies in Clemson, S.C. - July, Figure 6. Average dead bee counts for pollen trap treated versus control colonies in Clemson, SC July, MANUSCRIPT II. Figure 1. Pollen trap with open collecting drawer and arrows pointing to modified bee exits.. 65 Figure 2. Cumulative averaged mites collected 11/16/99 through 1/10/ Figure 3. Cumulative averaged mites collected 7/25/02 through 9/17/02 74 vii
10 INTRODUCTION The western honey bee, Apis mellifera, is economically important for the products it produces, and to a much greater extent, for its work as a pollinator. Robinson et al. (1989) estimated that a $9.3 billion annual increase in U.S. agricultural production is attributable to honey bee pollination, while 11 years later Morse and Calderone (2000) estimated a $14.6 billion increase. The increase occurs because many crops are dependent on honey bees for pollination. In addition, many crops that are not dependent on honey bees do benefit from increased production if honey bees pollinate them. Despite the recent attention that has been given to alternate pollinators, honey bees are still by far the most important agricultural crop pollinators. Honey bees face a number of important challenges to their survival. These challenges include the long-standing problem of incidental contact with pesticides in the environment and, in recent years, introduced pest species. Starting in the late 1800 s with the introduction of modern commercial pesticides, U.S. beekeepers have experienced losses due to pesticide poisoning. In a typical incident, insecticides are sprayed on crops and bees are unintentionally killed by coming into contact with the poison in any of several ways. Some insecticide formulations tend to be picked up more easily by foraging bees. A major contributor to the ease with which bees can pick up insecticides may be the branched body hairs that are adapted for picking up tiny grains of pollen. The problem of the pollen-adapted hairs is at its worst when foraging bees encounter microencapsulated methyl parathion, which has been widely used to control orchard pests. The polymer-coated microcapsules are about the same size (30-50µ) as 1
11 pollen grains. Microencapsulated methyl parathion has been implicated in many severe bee poisoning problems involving the kill of newly emerged adult bees and honey bee brood. U.S. honey bees have experienced a series of pest problems. The first of these problems started in 1984 with the introduction of the tracheal mite (Acarapis woodi); followed by the introduction of the varroa mite (Varroa destructor) in 1987; the Africanized honey bee (Apis mellifera x scutellata) in 1990; and most recently the introduction of the small hive beetle (Aethina tumida) in The consequences of these introduced pests have included a drastic reduction in the population of honey bees, including almost all feral and approximately one third of all managed honey bee colonies (Ambrose 2000). The varroa mite is the worst of these pests. The use of a limited number of chemical insecticides has been the primary means to control the varroa mite. Apistan is the safest and most common chemical control. It comes in the form of plastic strips impregnated with the pyrethroid fluvalinate, and kills the mites when they come in contact with the strips. Due to the heavy dependence on a single pesticide, varroa mites are showing resistance to fluvalinate (Milani 1999). In these cases, the next step is to treat with Checkmite which contains the active ingredient coumaphos. Coumaphos is an organophosphate and is more dangerous to both the bees and the beekeepers who handle the pesticide than is fluvalinate. Also, there is a greater risk of honey and bees wax contamination from coumaphos than from fluvalinate. There are reports from New Jersey that varroa mites are showing resistance to coumaphos as well (Nasr 2002). 2
12 The current research places an emphasis on pollen traps as an integrated pest management tool to help control varroa mites, and to help prevent microencapsulated pesticides from entering honey bee colonies. Use of pollen traps is a practice already utilized by beekeepers for the purpose of pollen collection. Pollen traps were invented so that beekeepers could collect pollen for sale in the marketplace. All pollen traps operate on the premise that pollen loads can be dislodged from the corbiculae (pollen baskets) of incoming foragers and collected, or trapped, so that the bee-collected pollen can be easily obtained by the beekeeper. The premise of the varroa studies is that pollen traps can remove mites from the bodies of adult bees much as they can remove pollen loads. In addition, pollen traps can act as a trap for mites that fall to the hive floor. The premise of the pesticide studies is that pollen traps may prevent some contaminated pollen loads from entering the hive. If bee colonies are poisoned by incoming contaminated pollen loads, it stands to reason that a pollen trap may help to protect against such contaminated pollen. These studies indicate that pollen traps do have a practical value in an IPM approach to varroa mite control. However, the pesticide under investigation, microencapsulated methyl parathion, is no longer being used for the purposes that were problematic for honey bees. The evaluation for reducing the impact of microencapsulated pesticides on honey bee colonies is still relevant because microencapsulation remains an attractive formulation for growers, and microencapsulated pesticides may be problematic in the future. 3
13 LITERATURE REVIEW The Importance of Honey Bees The western honey bee, Apis mellifera, is economically important for the products it produces, and to a much greater extent for its work as a pollinator. Products taken from honey bee colonies and sold in the marketplace include honey and beeswax, and to a lesser extent, pollen, royal jelly, propolis and venom. Though honey bees have been valued for their honey and beeswax since they were brought to the New World from Europe in the 1600's (Hoff and Willet 1994), their value as pollinators has been studied carefully only in recent times. In careful evaluations, Robinson et al. (1989) estimated that a $9.3 billion annual increase in U.S. agricultural production is attributable to honey bee pollination, while Morse and Calderone (2000) estimated a $14.6 billion increase. The increase occurs because many crops are dependent on honey bees for pollination. In addition, many crops that are not dependent on honey bees do benefit from increased production if honey bees pollinate them. Examples of crops that depend on or benefit from honey bee pollination include almonds, apples, pears, alfalfa seed, blueberries, cherries, melons and citrus fruits. In North Carolina, the annual value of honey bee pollination is estimated to be $97 million (Ambrose 1997). This figure considers only commercial crops. Some important crops in NC that depend on honey bees for proper pollination include apples, cucumbers, watermelons and other vine crops. In addition to such agricultural crops, 4
14 honey bees also pollinate plants in home gardens and plants that provide food for wildlife. The importance of the beekeeping industry in North Carolina is emphasized by the fact that the fruits and vegetables grown in home gardens and the seeds and berries that provide food for wildlife all depend at least partly on the services of honey bees. Approximately 2.5 million honey bee colonies were rented for crop pollination in the U.S. in 1999 (Morse and Calderone 2000). Included in this figure are the colonies moved around the country in migratory beekeeping operations. Each year, approximately one million colonies are moved from Texas and the Great Plains to California and back, mostly for almond pollination. Migratory beekeepers also operate up and down the East Coast from Florida to New England and back each year. The introduction of new honey bee pests over the past 18 years has hindered the migratory pollination practices. As states endeavored to keep pests out, they placed tougher restrictions on the movement of bees across their borders. As pollinators, honey bees have many advantages over other bees. Honey bees live in populous colonies, which can be contained in portable hives. Honey bee colonies live throughout the year as opposed to other bees, which are available only during a short season, and the hives can be placed in agricultural fields at any desired orientation or density. The honey bee s ability to quickly recruit large numbers of foragers to food sources, its ability to exploit a large variety of flowering plants for pollen and nectar, and its habit of visiting one plant species at a time all contribute to the superiority of the honey bee as a pollinator (Hoff and Willet 1994). Other pollinators are often groundnesting bees. Such bees tend to be less compatible with agricultural crops compared to 5
15 honey bees because farming practices disturb the ground that the other pollinators use as nesting sites and because the nesting sites are more vulnerable to pesticide runoff. Introduced Pests of Honey Bees and Recent Problems In addition to diseases that have existed from the start, and pesticide-related bee kills that have been a problem since the 1930's, the number of problems facing the U.S. beekeeping industry has escalated in the last 18 years. The introduction of a series of pests and parasites has reduced the availability of honey bee colonies for the pollination of commercial crops, home gardens and plants producing food for wildlife. The arrival of the tracheal mite, Acarapis woodi, and the varroa mite, Varroa destructor, occurred in the mid 1980's. The damage inflicted on honey bees by these parasites has resulted in a drastic reduction in the number of honey bee colonies (Morse and Calderone 2000). North Carolina has experienced a 30% reduction in the number of managed colonies and an almost complete loss of feral colonies (Ambrose 1997). The problems with tracheal mites have largely subsided. The tracheal mite gets its common name from the fact that it spends the majority of its life in the tracheal system of the adult honey bee where it feeds on the bee s hemolymph. The mite was a native pest of the western honey bee dating back before the bees were brought to the New World. Tracheal mites were first discovered in the United States in Weslaco, Texas in July 1984 (Delfinado-Baker 1984). Initially, substantial bee kills were seen, but over the years, the bee s vestigial resistance has strengthened. Resistant honey bee stocks, in addition to effective control of the mites using menthol treatments in beehives, have 6
16 largely eliminated the tracheal mite problem. The varroa mite is the more serious of the mites and is discussed at greater length in later sections of this literature review. The small hive beetle, Aethina tumida, was confirmed to be present in the U.S. in June of 1998 (Smith 1998). Approximately 20,000 honey bee colonies were lost to the beetles in Florida alone during that first year (Sanford 1998). Although its true potential as a pest of honey bees remains unknown, small hive beetles (SHB s) continue to spread and to be an economic and psychological drain on U.S. beekeepers. As of June 2002, SHB s have spread to over the half the states in the U.S., including the entire East Coast (Keller and Ambrose 2002a). The small hive beetle was confirmed to be present in North Carolina in November of 1998 (Hopkins et al. 1999). As of June 2002, SHB s have been found in about half of the 100 counties in the NC. The spread is facilitated by the movement of bees, particularly along interstate highway corridors (Keller and Ambrose 2002b). The spread of SHB s may also be partly explained by the fact that they are not obligate honey bee pests. Keller (2002) has shown that the beetles can survive and reproduce on a number of fruits. Therefore, they may be able to spread to new locations without the aid of honey bees. Africanized honey bees (AHB's) have been in the U.S. since October of 1990 and are now established in several states (TX, NM, NV, CA and AZ). AHB colonies are more difficult to manage, present a greater health hazard than purely western honey bees and place additional pressure on the beekeeping industry (Guzman-Novoa and Page 1994). The presence of AHB's discourages individuals from beekeeping, causes negative perceptions of honey bees among the public and limits the movement and shipment of 7
17 honey bees within the country. The spread of AHB's eastward from Texas has been slowed considerably and they will probably not become established in North Carolina any time in the near future. Several factors contribute to the slowed movement of AHB s. Restrictions on the movement of bees from areas where AHB s are found prevent both the sale of bees and the rental of colonies for pollination from those areas. Also, there has been a lot of effort along the migration front to destroy honey bee swarms and to ensure European queens are in place in managed colonies. Additionally, AHB s seem to be more susceptible to varroa mite damage outside of tropical conditions. As AHB s move into areas with cooler temperatures, they require more development time as larvae. This longer development time allows the varroa mites more time to reproduce, resulting in increased colony death for the migrating AHB s. Varroa Mites Biology of varroa mites The varroa mite, Varroa destructor (Oudemans) is an external parasite of honey bees. Adult female varroa mites measure 1.1 mm long x 1.6 mm wide and are reddishbrown in color. The less conspicuous males are smaller, measure about 500 µm wide, and are very light yellow in color. Varroa mites require bee brood to reproduce, so that mite populations are highest after periods of increased brood-raising by the host honey bee colony. Varroa prefer drone brood, which has a longer development time, to worker brood. Worker brood does, however, get attacked by varroa, especially in heavily infested colonies. 8
18 A gravid female mite enters an open brood cell and hides upside-down beneath the bee larva, submerged in the liquid brood-food. Once the cell is sealed and the bee larva begins to pupate, the mite pierces the pupa using its specialized mouthparts and feeds on the bee hemolymph. The mite begins to oviposit 60 hours after capping, laying single additional eggs at hour intervals. The first egg becomes a male, while each of the subsequent 2-6 eggs become female. If the brood cell contains a worker larva, an average of 1.3 female offspring are produced; if the cell contains a drone larva, the average is 2.6 female offspring (De Jong 1987). The male mite matures in 5 to 6 days and mates with each maturing sister mite. After mating, the male mite s life cycle is complete. Female mites mature in 6 to 7 days (De Jong 1987) and emerge from the cell attached to the adult bee as the bee emerges. On average, the number of reproductive cycles for a female mite is between 1.5 and 2. Adult female mites live on adult bees. They attach themselves to various parts of a bee s thorax or abdomen and suck hemolymph for food. The mites can, however, move rapidly over the bee s body, (De Jong et al.1982) as well as move from one bee to another. After traveling and feeding an average of 7 days on the original adult bee or on another bee, the mites transfer to a suitable brood cell in order to lay eggs and produce the next generation of varroa mites. Mites that fall off bees can live on their own for only about 20 hours (De Guzman et al.1993). For additional detailed information about varroa mite biology, see De Jong et al. (1982) and De Jong (1987). 9
19 The origin of the varroa mite and its introduction to Apis mellifera Varroa destructor was until recently thought to be a closely related mite species called Varroa jacobsoni (Anderson and Trueman 2000). Both species parasitize the Asian honey bee, Apis cerana. Anderson and Trueman (2000) determined that the mite species originally described as V. jacobsoni by Oudemans in 1904 (Oudemans 1904) is part of the same species complex, but not the same species that made the jump to Apis mellifera. That jump probably first took place in the Philippines in the early 1960 s (De Jong et al.1982). Only after A. mellifera were imported to the Philippines, thereby coming into close contact with Apis cerana and their accompanying parasites, was varroa known to be a parasite of A. mellifera. There are several reasons that A. cerana colonies are able to withstand varroa infestations with relatively little damage compared to A. mellifera. A. cerana practice more active grooming (Peng et al.1987) and hygienic (Spivak 1996) behaviors than do A. mellifera. Grooming behavior refers to the removal of mites from the bodies of adult bees and hygienic behavior refers to the removal of unhealthy brood from the hive. The tropical climates in which A. cerana are found afford shorter development time for bee brood compared to longer development time for A. mellifera in temperate climates. This short development time limits the number of mites that can mature during the capped brood stage. In addition, varroa mites usually reproduce only in drone cells when parasitizing A. cerana, but reproduce in both worker and drone cells in A. mellifera. 10
20 The spread of varroa mites The original species jump to A. mellifera and the subsequent spread of varroa mites to most regions of the world can both be attributed to movement of bees by humans. Once varroa are in an area, however, they may spread in other ways. Varroa mites were first reported in the U.S. in Their spread within the country was and continues to be due to several factors including robbing and drifting by honey bees. Robbing and drifting behaviors allow bees from one colony to enter other colonies. A drifting bee (usually a forager carrying food) is accepted into a colony other than its parent colony and may bring mites with it. A robbing bee enters a weak colony to obtain food. During the robbing event, mites may be transferred from or to the robber bee, effectively spreading mites from one colony to another. Another contributor to the spread of varroa mites is the introduction of infested swarms into apiaries. Such swarms are often incorporated into an apiary without the bees being treated or examined for mites (Rademacher 1991). Damage caused by varroa mites Untreated varroa mite parasitism of honey bee larvae and adults will usually result in the death of the bee colony. Colony death usually occurs within two years. Brood that have been parasitized by several mites often develop into abnormal adults. Such adults exhibit wing deformities, leg deformities, shortened abdomens, reduced longevity and lower weight (De Jong et al.1982). Also, mites piercing bee larvae seems to cause detrimental secondary effects. Colonies infested with varroa mites have shown increased and damaging levels of acute paralysis virus (Ball 1985) and parasitic mite syndrome 11
21 (Shimanuki et al.1994). Bees weakened by varroa infection may also be more susceptible to invasion by other pathogens. On a national level, nearly all feral honey bee colonies in the U.S. have died since the introduction of varroa mites (Krause and Page 1995) with the varroa mites being the primary cause of this loss. In addition, it is estimated that varroa mites are responsible for the deaths of at least 30% of the bee colonies managed by people (Ambrose 2000). Consequences of varroa mite infection In addition to the substantial number of colonies that are killed by varroa mites, many colonies are weakened by varroa infection. This weakened condition has economic consequences including reduced pollination efficiency by bee colonies and reduced honey production. Beekeepers experience further economic loss because of the financial and labor costs associated with combating the mites. For example, the recommended two treatments of Apistan each year currently costs from $6.36 to $8.80 (Dadant and Sons 2000; Mann Lake Ltd. 2000). The net result is fewer honey bees and increased management demands and expense for the remaining bee colonies. Control of varroa mites Chemical Chemical control of varroa mites is difficult for several reasons. The mites complete their entire life cycle in close association with their honey bee hosts, so the chemical treatments must not be harmful to bees. Further, a substantial portion of the mite population is typically located in sealed bee brood cells that are difficult to safely 12
22 penetrate with most chemicals. The timing of pesticide applications also presents a problem if the chemical is to be prevented from contaminating honey destined for human consumption. Other considerations that create difficulty in the chemical control of varroa mites include the need to prevent pesticide residues in commercial hive products and pesticide resistance in mites. The pesticides currently approved by the Environmental Protection Agency for varroa control cannot be used during honey flows. Pesticide resistant varroa mites are a problem that has existed for some time, which highlights the need for more and different approaches to varroa control. Premature removal of chemical mite treatments imposed by honey flows may also contribute to pesticide resistance in mites. Currently, there are three products (acaricides) approved in the U.S. for varroa mite control. They are tau-fluvalinate impregnated plastic strips (Apistan ); coumaphos impregnated plastic strips (Checkmite ) and a gel formulation of formic acid (Apicure ). In general, these products have the advantages of offering good mite control with minimal damage to the bees, and presenting a low risk of hive-product contamination when used according to their labels. Fluvalinate First used in Austria in 1988, Apistan has generally had widespread success in controlling varroa mites. Apistan is a formulation of tau-fluvalinate that incorporates the chemical into a plastic strip for use as a contact poison. This type of formulation is also found in familiar household dog and cat flea collars. During a treatment, each colony s brood nest receives two strips for approximately 56 days. This treatment is 13
23 usually done twice a year: Once in early spring before the main honey flow, and once in late summer after the honey harvest. Apistan treatment is % effective when used properly against normal (nonresistant) mite populations (Hillesheim et al.1996). Apistan treatment has been shown to have some negative side effects on treated colonies. These effects include queen supercedure and lowered levels of drone survival (Currie 1999). Rinderer et al. (1999) also found reduced numbers of healthy drones in Apistan treated colonies. Use of Apistan as the exclusive chemical to combat varroa mites in the U.S. for a period of years, and frequent misuse during that time, have accelerated the inevitability of fluvalinate-resistant mites. Fluvalinate resistance has been found in Europe (Lodesani 1995; Milani 1999) and in the U.S. (Elzen et al.1998; Elzen et al.1999). Such reports are becoming commonplace. Apistan is valuable because of its unique combination of high efficacy and safety but resistance is a serious problem for the beekeeping industry. Coumaphos The organophosphate coumaphos is formulated as impregnated plastic strips sold as Checkmite. This use of coumaphos was approved in the U.S. in 1999 in response to the presence of Apistan -resistant mites. Also contributing to the approval was the need to control the small hive beetle, Aethina tumida, a newly introduced pest of U.S. honey bees. Many states, including North Carolina, obtained EPA section 18 emergency exemptions for the use of coumaphos as an alternative to Apistan for varroa treatment. Concerns about the use of the organophosphate coumaphos by the beekeeping industry include greater risk of harm to the applicators and greater risk of contaminated 14
24 hive products causing a public health risk compared with the pyrethroid fluvalinate. As with any pest subjected to the repeated use of a given pesticide, varroa mites can become resistant to coumaphos. Some evidence of coumaphos-resistant mites has been shown in Europe (Milani 1999), and recently, Nasr (2002) reported mites showing resistance to coumaphos in New Jersey. Formic acid Formic acid liquid and vapor treatments have been used as effective treatments for varroa mite control in Europe and in Russia since the introduction of varroa mites to those countries. Calderone and Nasr (1991) showed 56% mite mortality using formic acid in an autumn treatment. The formic acid vapors have the valued ability to penetrate sealed brood cells. Fries (1991) showed a 90% survival rate of brood while still effectively killing mites inside sealed cells. In February of 2000, a gel formulation of formic acid was approved and labeled for use in U.S. beehives. The new product has been shown to be about 70% effective against varroa mites, and is effective against tracheal mites (USDA Beltsville 1999). As of this writing, however, this formic acid product is unavailable due to problems with the formulation and packaging discovered after its public release. Although not as effective as other chemicals, formic acid is an appealing product as part of an integrated pest management (IPM) approach to effective mite control. Another appeal of formic acid is that its residues in hive products do not present a public health concern since formic acid is a naturally occurring product found in honey. 15
25 It may appear that the control of varroa mites has made much progress now that there are three chemicals approved for U.S. beekeepers to use against the mites. In reality however, there are several problems associated with acquiring and effectively using the chemicals. Since formic acid is currently unavailable to beekeepers, there are in practice only two approved chemicals (fluvalinate and coumaphos) for varroa mite control. Of those two, coumaphos is limited since it is made available only by EPA section 18 emergency exemption. In addition, varroa mites have shown resistance to both fluvalinate and coumaphos. In light of these problems, the need for other methods of control is urgent. Genetic resistance As discussed in the previous section, (The origin of the varroa mite and its introduction to Apis mellifera), A. cerana bees have important characteristics that make them genetically resistant to varroa mite infection. Peng et al. (1987) described physiological and behavioral characteristics that contribute to this resistance. Physiological characteristics include the ability of worker bees to detect and respond to the presence of varroa mites on brood, on nest mates and on themselves. Behavioral characteristics include rapid removal of mites from brood and from adult bees. This removal is called grooming behavior. In addition, A. cerana have a shorter capped brood stage compared to A. mellifera. This shorter development time limits the number of mites that develop to maturity since the mites grow on the developing (immature stages) of the bees. In addition, since the mites are necessarily in contact with the immature bee for a 16
26 shorter time, the amount of damage that the mites can cause to an individual bee is reduced. Breeding for resistance to varroa mites in A. mellifera is a topic of ongoing study. The goal of breeding for genetic resistance is to produce honey bee strains that can tolerate mite infestations or reduce mite populations to very low levels. Harbo and Harris (1999b) name several characteristics that contribute to varroa resistance. These include duration of the capped brood period, hygienic behavior, grooming behavior, proportion of the mite population occurring in the brood and suppression of mite reproduction. Buchler and Drescher (1990) found that about 25% of the variation in mite populations in A. mellifera colonies could be explained by differences in duration of the capped brood period. Attempts to breed A. mellifera for a shorter duration of the capped brood stage are described and were made by Kralj and Otis (1999). Szabo (1999) describes the history of hygienic behavior research. Hygienic behavior involves workers removing unhealthy brood from the nest. Hygienic behavior has been shown to aid in the control of varroa mites (Spivak 1996). Attempts have been made to breed for hygienic bees as a control measure for varroa mites (Harbo and Harris 1999a; Harbo and Harris 1999b; Szabo 1999). At present, such breeding efforts do not seem promising. Several researchers describe grooming behavior that results in mutilated mites (Morse et al.1991; Szabo et al.1996). However Harbo and Harris (1999b) found that the characteristic of physically damaging mites is difficult to select for, and they note that damaged mites have never been found to be related to reduced mite populations in A. 17
27 mellifera. In addition, Peng et al. (1987) found that A. mellifera generally fail to remove mites from adult bees or from brood. Mites are found in one of two situations in the bee colony. They are found in a brood cell where reproduction takes place or on an adult bee in a phoretic stage. The proportion of mites in brood was found to be a heritable characteristic so that bees bred to yield a lower proportion of mites in brood should be more resistant to varroa. The reason for differences in this proportion is probably due to attractiveness of the brood to the mites (Harbo and Harris 1999b). Many researchers suggest that resistance may be partly due to failure of female mites to reproduce after they enter a brood cell; see Harbo and Harris (1999b) for an extensive list of references on this subject. This non-reproduction characteristic probably plays a substantial role in the varroa-resistance shown by bees in the area of far-eastern Russia. It is likely that in that region, A. mellifera has been in association with V. destructor for a longer period of time than any other region in the range A. mellifera. The association probably goes back to before the mite was described in 1904, and seems to have resulted in honey bee stocks that demonstrate some genetic resistance to varroa (Danka et al.1995). The phenomenon of resistant stocks of A. mellifera in that region led to the introduction of Yugoslavian bees to the U.S. (Rinderer et al.1993) and later, Russian bees (Rinderer et al.2000). So far, the success of these bees in adapting to U.S. conditions has been limited. 18
28 Essential oils There have been many studies of the use of essential oils as control agents for varroa mites. Essential oils and their components offer advantages over synthetic acaricides such as low expense and few health risks. Of over 150 essential oils and components of essential oils tested, very few have proven successful in real hive situations. Thymol and thymol blended with essential oils offer the most promise. Thymol tends to be well tolerated by honey bees. Calderone and Spivak (1995) found that a blend of thymol, eucalyptus oil, menthol and camphor caused average mite mortality of 96.7%. Calderone et al. (1997) calculated a mite mortality of 56.4% and 49.1% in colonies treated with different applications of thymol and cineol. Imdorf et al. (1995) tested a product called Apilife VAR, which is another blend of thymol with eucalyptol, menthol and camphor. Apilife was found 95% effective against varroa under optimal conditions. Ellis et al. (2001) found Apilife VAR to have an efficacy ranging from %. Problems associated with these kinds of treatments include development of practical and effective delivery systems and the accumulation of residues in honey and in wax (Imdorf et al.1999). In addition, essential oil products such as Apilife may decrease brood production in treated colonies (Ellis et al.2001). This decreased brood production highlights a general problem: the common, false, assumption that essential oils are bad for pests, but perfectly safe for bees and humans. 19
29 Environmental Control According to Le Conte et al. (1990), varroa mites develop optimally at temperatures between 32.5 ο C and 33.4 ο C, a range that corresponds to the typical brood nest temperature of A. mellifera colonies. Mites exhibit slower reproduction at temperatures below 28 ο C and above 36.5 ο C, and mites begin to die without reproducing at temperatures above 38 ο C. Adult female varroa mites are more susceptible to higher temperatures than are honey bees (Rosenkranz 1987). Honey bees can withstand higher temperatures, at least for limited periods, for several reasons including a lower surface area to volume ratio than the smaller mites (Kommisar 1985). Heat treatment studies to control varroa mites have been done on capped bee brood (Marien 1995; Appel and Buchler 1991; Rosenkranz 1987) and on the whole colony or adult bees only (Harbo 2000; McArthur 1990; Hoppe and Ritter 1986; Kommisar 1985; Tabor and Ambrose 2000). Heat treatments usually involve short temperature spikes applied to the adult bees. Kommisar (1985) found a heat treatment of 47 ο C for 2-15 minutes to be 97-98% effective in killing mites on adult bees. Hoppe and Ritter (1986) tested temperatures ranging from 42 ο C 51 ο C, with treatments lasting up to 30 minutes and found that up to 86% of the mites were killed. McArthur (1990) showed 100% mite mortality with treatment of adult bees at 46 ο C 48C for minutes and Harbo (2000) found that 100% of the mites dropped from adult bees at 40 ο C. Tabor and Ambrose (2000) found that up to 96% of mites dropped off of adult bees after 5 days of treatment at 40 ο C, with minimal bee death. 20
30 Practical heat treatments by beekeepers are often prohibitively labor-intensive. In addition, most successful heat treatment tests have been done on adult bees and not on whole colonies with capped brood. Another disadvantage of this kind of varroa control is the lack of availability and expense associated with heating equipment. Bottom boards and pollen traps Varroa mite control using mesh bottom boards or using pollen traps both employ the same principle: Mites that fall to the hive floor are permanently separated from the bees while in an unmodified hive such mites have the opportunity to recombine with the bee population by climbing up from the hive floor back to the bees. Pettis and Shimanuki (1999) describe a hive modification in which the majority of the bottom board is replaced with wire mesh hardware cloth. Compared to colonies with normal bottom boards, the colonies with mesh bottom boards had approximately 14% lower mite levels in June and 28% lower levels in July. These results were not statistically significant however, and both treated and control colonies reached damaging mite levels by September. Pettis and Shimanuki (1999) also describe a variant of the mesh bottom board called a mesh insert. The mesh insert is installed above a normal bottom board and below the brood nest, allowing space for fallen mites to be trapped away from the bees. Ambrose et al. (2000) demonstrated reduced mite levels using mesh inserts, but these levels also rose to damaging levels by the end of the study. In addition to trapping varroa mites, pollen traps have the advantage of collecting pollen, which can provide additional income for beekeepers. Hart and Nabors (2000) found that pollen traps installed under the brood nest could reduce mite numbers by 43%, 21
31 a result that corroborated a similar study (Hart and Nabors 1999) a year earlier. Ambrose et al. (2000b) demonstrated that pollen traps can remove mites from bee colonies in numbers comparable to results using Apistan strips. Over the standard 56 days recommended for an Apistan treatment, an average of 32.5 mites per day were removed by pollen traps compared to an average of 38.5 mites per day in Apistan treated colonies. However, at the end of the study, mite levels in the pollen trap treated colonies remained at damaging levels. This lack of adequate mite control was attributed to the fact that Apistan does 90% of its work in the first twenty days of treatment while during that same period pollen traps removed only 50% of all the mites that would be removed over the 56 days. Ambrose et al. (2000b) suggest that pollen traps function to remove mites from a bee colony in a way that mesh bottom boards or mesh inserts cannot: Mites are removed when bees entering the hive pass through the screens in the pollen trap that were designed to remove pollen loads from foragers. The mesh bottom boards rely on normal mite fall (mites periodically dropping off adult bees) while the pollen traps add adult bee movement through the pollen traps. This idea is supported by the fact that the traps appeared to remove more mites when weather conditions favored bee flight activity. Trap comb and bee pupae destruction Calis et al. (1998) showed that use of trap-combs (frames of worker brood at the point just before capping) and formic acid treatment reduced varroa populations between 87-89%. The brood could be safely returned to the hive after the treatment. Fries and Hansen (1993) confined queens to specific combs for part of the season and then 22
32 removed the sealed brood combs to substantially reduce the number of mites in the test hives, but this practice may also reduce total bee populations. Shimanuki (2001) recommended cutting off the two bottom corners of brood frames so that the workers can replace those corners with drone comb. The resulting drone brood can then be selectively removed along with any mites that may be in those brood cells. This is a sound beekeeping practice not only because drone brood is more expendable than worker brood, but also because varroa mites prefer to reproduce on drone brood to worker brood. Hart and Nabors (2000) placed drone comb in the middle of brood chambers, which were removed for destruction when fully capped. This drone pupae destruction helped to reduce overall mite numbers in the test colonies. Note, however, that the practice is labor-intensive. Integrated pest management for varroa control It makes sense to adopt an IPM approach to varroa control. Individual measures such as mesh bottom board inserts, drone pupae destruction or Apilife treatment are insufficient to control varroa populations. Combinations of such measures in an overall management scheme will be helpful in a move away from dependency on regular applications of synthetic acaricides. Ellis et al. (2001) combined Apilife treatment with mesh bottom board inserts, and Hart and Nabors (2000) combined pollen traps with drone pupae destruction. Other elements of an IPM program might include installation of packages on foundation rather than on drawn comb (Ambrose 2000b) and use of natural products such as citrus leaves as smoker fuel (Eischen and Wilson 1997). 23
33 The consensus is that genetic resistance to mites should be a top priority in mite control research. In addition to resistance, any method that can delay chemical treatment or reduce the frequency of such treatments should be considered, and varroa populations must be monitored so that synthetic acaricides can be applied if mite levels get too high. Delaplane and Hood (1999) established an economic threshold for varroa mites in the southeastern United States. They found that bee colonies of average size (about 30,000 bees) can optimally benefit from a chemical acaricide treatment if an overnight bottom board insert yields mite levels of , or if an ether roll of 300 adult bee yields mite levels of The goal of IPM is not to eliminate chemical treatments, but to minimize and optimize pesticide use. Non-pesticide approaches to varroa mite control should be employed in combination with monitoring mite levels. With an economic threshold in mind, an IPM plan for varroa mite control can incorporate pesticide and non-pesticide measures. In addition, any IPM plan must be acceptable to beekeepers. In North Carolina, most beekeepers are hobbyists who will require a simple IPM plan. A complicated IPM plan with too many options will likely never be employed. However, the consequences of non-employment of an IPM plan are severe and may include the predominance of acaricide-resistant varroa mite populations. Such populations would have the potential to destroy any honey bee colonies that rely solely on regular acaricide treatments for mite control. 24
34 Pesticide Poisoning of Honey Bees Starting in the late 1800 s with the introduction of modern commercial pesticides, U.S. beekeepers have experienced losses due to pesticide poisoning. Typically, insecticides are sprayed on crops and bees are unintentionally killed by coming into contact with the poison in any of several ways. In the early days before growers accepted the need for insect pollination, losses were quite severe. The first pesticides were arsenical compounds such as calcium arsenate which were highly toxic to bees. Chlorinated hydrocarbons such as DDT were introduced and used extensively starting in the 1940 s. Since DDT was relatively safe for bees, the problem of bee poisoning was less severe until DDT was banned in 1973 (Atkins 1992; McGregor 1976). The development and popularity of chemicals, which happened to be more toxic to bees such as organophosphates and carbamates again, lead to extensive bee losses. Levin (1970) estimated that over 500,000 honey bee colonies were destroyed by pesticides in the US in 1967 alone. Growers now utilize a variety of pesticides with varying potential to harm honey bees. Consequently, beekeepers need to be aware of the pesticides being used by their neighbors. Bees can encounter pesticide-contaminated plants or water up to three miles from the hive. While some pesticides kill bees in the field, other pesticides are carried back to the colony where there is potential for even more damage. While some colonies die soon after a pesticide application, other colonies become severely weakened due to 25
35 bee losses. Such weakened colonies may fail to store up enough food to survive the winter, or they may endure enough stress to clear the way for pathogens to flourish. Different formulations of pesticides present different levels of danger to honey bees. Some formulations tend to drift more readily from their intended targets so that the pesticide can accidentally contact foragers or hives. More importantly, some formulations tend to be picked up more easily by foraging bees. The danger to honey bees is normally described in the following order (least hazardous first): granular formulation; soluble powder or liquid solution; emulsifiable concentrate; flowable; wettable powder; dust; microencapsulation (Johansen and Mayer 1990). A major contributor to the ease with which bees can pick up insecticides may be the branched body hairs that are adapted for picking up tiny grains of pollen. Microencapsulated methyl parathion The problem of the pollen-adapted hairs is at its worst when foraging bees encounter microencapsulated methyl parathion, which has been widely used to control orchard pests. The plastic-coated microcapsules are about the same size (30-50µ) as pollen grains. Microencapsulated methyl parathion has been implicated in many severe bee poisoning problems involving the kill of newly emerged adult bees and honey bee brood. In fact, along with carbaryl, microencapsulated methyl parathion is one of the two most common causes of pesticide-related honey bee poisoning (Mason 1986). In 1999, the Environmental Protection Agency accepted the voluntary cancellation of many significant food crop uses for methyl parathion. All fruits, including apples, were included on the list of cancelled uses. Starting in January of 2000, 26
36 use of methyl parathion in fruit orchards was officially banned. The rationale for the cancellation was that methyl parathion has been found to pose unacceptable dietary risks to children (Environmental Protection Agency 1999). The mode of action for bee kills appears to be that honey bees in the treated orchards do not distinguish between the microencapsulated pesticide particles and pollen grains on blooming ground plants, such as clover. Foraging honey bees therefore carry contaminated pollen back to the hives where the pesticide kills young adult bees that process the contaminated pollen for feeding to larval stages of the bees (Burgett and Fisher 1977; Johansen and Kious 1978; Stoner et al. 1978; Rhodes et al. 1979). Both adult hive bees and larval honey bees are killed, and in some cases there is a break in the brood cycle, the queen may be superceded, or the entire colony may be killed (Johansen 1978). For the grower, there are two main advantages of microencapsulating a toxic pesticide. One is a reduced hazard for pesticide applicators that may contact the material they are spraying (Ivy 1972). The second advantage is an increased residual time during which the chemical is still active after it is applied (Ivy 1972). The pesticide is released slowly as the microcapsules dry out (Graham 1980). However, these same qualities contribute to the increased hazard to honey bees. The plastic shell makes the pesticide safer for applicators, but also allows the material to be picked up by honey bee foragers. While other pesticides kill foragers in the field, microencapsulated methyl parathion does not generally kill the foragers that collect it. Mason (1986) found that less than 50% of bees sprayed directly with microencapsulated methyl parathion were knocked down within an hour of spray, while more than 50% of 27
37 bees were knocked down within an hour of being sprayed with several other common insecticides. Due to their long residual effects, the microcapsules remain hazardous even after they are stored in pollen cells inside the hive. In fact, microencapsulated methyl parathion is the only material used in commercial agriculture which has been proven to remain toxic to bees, in pollen stored in combs within the hive, from one season to the next (Johansen 1979). Rhodes et al. (1979) found that pollen contaminated with microencapsulated methyl parathion was still very deadly to honey bee colonies even after the pollen had been stored for over a year in the cells of wax combs. The mortality in the test colonies was 29 to 72 times higher than normal during the first 48 hours, and it took about a month for the mortality to return to normal. Foragers may continue to collect contaminated pollen for several days after the microencapsulated pesticide is sprayed. Burgett and Fisher (1980) found foragers carrying contaminated pollen loads up to nine days after a pesticide spray. In one study, almost 10% of all pollen storage cells in the affected colonies were found to contain microcapsules (Burgett and Fisher 1980), and the pesticide was found in trapped pollen, dead bees and sections of comb containing stored pollen or brood (Hanny et al. 1983). However, Hanny et al. (1983) found that no methyl parathion was found in sections of comb containing unripened nectar or capped honey from the affected hives. The presence of the pesticide is limited to pollen storage cells, so that the honey is unlikely to be contaminated. 28
38 Microencapsulated Pesticides in North Carolina The primary problem with microencapsulated pesticides in North Carolina has been the use of Penncap-M in apple orchards. Starting in 1993, there were a number of serious honey bee kills in apple orchards due to Penncap sprays, despite the fact that the label for Penncap had been modified in order to allow for better protection of bees. Several of these bee kills were documented by the Pesticide Division of the North Carolina Department of Agriculture and Consumer Services. Chemical analysis proved the presence of methyl parathion both in the dead bees and in nearby apple orchards. Penncap was being used to control apple pests such as the tufted apple budmoth, Platynota idaeusalis (Walker), and the coddling moth Cydia pomonella.. The label prohibited Penncap application while the apple trees were in bloom, so that bee kills were not a problem for colonies that were moved into orchards for pollination. In addition, apple growers agreed that they needed to take steps to help protect honey bee colonies that were established in the area. It was recognized that prior to sprays, apple growers needed to remove blooming ground cover from orchard floors and inform beekeepers maintaining hives within one mile of the orchard that the spray was to occur (Ambrose 2002). Despite the discussion and implementation of these steps, bee kills continued to occur near apple orchards in North Carolina. Starting in 1997, there was serious concern that the bee losses would result in the cancellation of the Penncap-M registration in N.C. A meeting between the Pesticide Division of the North Carolina Department of Agriculture and Consumer Services, a group of apple growers, beekeepers and N.C. State 29
39 University extension personnel was held. A new plan was developed to reduce honey bee kills by Penncap-M (Owings 2002). The apple growers agreed to discontinue use of Penncap in May and June. Previously, the May and June application was used against the first generation of tufted apple bud moth. However, it was decided that Penncap use would resume in August against the second generation of tufted apple bud moth. In addition, it was stressed that orchard floors must be free of flowering vegetation so bees would not be attracted to the treated orchards. The process of eliminating blooms from orchard floors turned out to be difficult because there were problems with both mowing and herbicide spray. Clover that has been mowed tends to bloom lower to the ground and out of the way of mower blades (Owings 2002). The only effective mowing regime would have been to allow the orchard floor to grow freely until just prior to the pesticide spray. Such a regime would be difficult at best for growers to follow. The herbicide clopyralid, under the trade name Stinger, was found to control white clover on orchard floors. However, that product was not labeled for that specific use. A Specific Exemption under Section 18 of FIFRA was requested for the use of Stinger on apple orchard floors for the protection of honey bees, but the exemption was not granted. Other suggestions such as moving beehives away from the area of spray, or covering the hives also presented problems. Covering or closing beehives for a Penncap application is not practical. The long residual period for the microencapsulated pesticide means that the hives would have to be covered for multiple days and honey bees require ventilation and must forage for water. Moving beehives is a difficult process under any 30
40 conditions but would be especially difficult at the time of the fall Penncap application. At that time of year in western N.C., hives tend to be heavy because they contain a surplus of honey. Importantly, that surplus is often composed of the premium sourwood honey (made from the nectar of sourwood trees, Oxydendrum arboreum) that is an important income source for many beekeepers. Another problem is the question of the destination of moved hives. Besides the difficulty in finding a practical apiary site, the value of sourwood honey results in intense competition for apiary locations in sourwood honey producing areas, which include much of the mountain region in western N.C. Pollen Traps Pollen traps were invented so that beekeepers could collect pollen for sale in the marketplace. All pollen traps operate on the premise that pollen loads can be dislodged from the corbiculae (pollen baskets) of incoming foragers and collected, or trapped, so that the bee-collected pollen can be easily obtained by the beekeeper. The pollen trap developed by the Ontario Agricultural College in 1962, known as the OAC trap, (Smith and Adie 1963) is the recognized standard for pollen traps. The OAC trap employs two 5-mesh wire screens through which incoming bees must pass in order to enter the hive. The screens extend horizontally over most of the area under the hive body and are placed cm to cm apart. This arrangement serves to dislodge 1/3 to ½ of incoming pollen loads. A pollen-collecting drawer is situated beneath the screens and small exit holes allow drones and many workers to leave the hive without going through the pollen barrier. Few bees find their way into the hive through the small holes. 31
41 A simple pollen trap designed only to sample for plant origin of the collected pollen loads is described by Stewart and Shimanuki (1970). Horr (1999) described a pollen trap that is very similar in design to the OAC trap, and showed various styles of screens. Wiser (1992) discussed advantages and disadvantages of different pollen trap designs and concluded that the model sold by the CC Pollen company was ideal. The CC Pollen trap is very similar to the OAC design, with the noticeable difference of the presence of small plastic tubes in the exit holes. Various studies have shown different effects of pollen traps on bee colonies. McLellan (1974) and Webster et al. (1985) review several of these studies from around the world. The effects of pollen traps are different depending on the style of the traps. Some pollen traps do more physical harm to the bees (Wiser 1992) and different traps collect varying amounts of pollen. Typical pollen traps currently in use in the US employ ¼ mesh wire screens and collect about 50% of incoming pollen loads (Horr 1999). McLellan (1974) found that pollen traps which collect 10% of incoming pollen had no significant effect on the amount of brood reared or on the amount of honey stored at the end of the season, but that fewer colonies treated with the traps survived the winter. Use of pollen traps may be useful for increased pollination efficiency by bee colonies for a desired crop. Bees specifically collecting pollen may be more effective in moving pollen from flower to flower (Webster et al. 1985). In a study in almond and prune orchards, colonies equipped with pollen traps were shown to have greater numbers of pollen foragers than did untreated colonies (Webster et al. 1985). Thorp and Loper (1984) found that pollen traps that remove about 16 percent of incoming pollen can 32
42 increase pollen collection by a factor of 1.8 in almond orchards, but caution that brood rearing is reduced when pollen traps that collect 60 percent of incoming pollen are used. Pollen traps have been used for purposes other than pollen collection. Pollen traps have been used for varroa mite control (see previous sections of this literature review: Bottom boards and pollen traps and Integrated Pest Management for varroa control). In addition, Matthenius (1973) used very simple screen pollen barriers to block entrance of pollen contaminated with Sevin-4-oil pesticide and found a substantial reduction in bee losses. Such blockage of contaminated pollen points to the potential use of pollen traps for the blockage of pollen contaminated with microencapsulated pesticides. Manuscript 1: Pollen Traps for the Reduction of Honey Bee Deaths Due to the Use of Microencapsulated Pesticides Introduction Note: The studies reported here were conducted in response to honey bee deaths that were caused by microencapsulated methyl parathion. Although microencapsulated methyl parathion is no longer in use, this research may be applicable to other microencapsulated materials that are currently on the market or that may become available in the future. Microencapsulated methyl parathion has been implicated in many severe bee poisoning problems involving the kill of newly emerged adult bees and honey bee brood. 33
43 In fact, along with carbaryl, microencapsulated methyl parathion has been one of the two most common causes of pesticide-related honey bee poisoning (Mason 1986). In 1999, the Environmental Protection Agency accepted the voluntary cancellation of many significant food crop uses for methyl parathion. All fruits, including apples, were included on the list of cancelled uses. Starting in January of 2000, use of methyl parathion in fruit orchards was officially banned. The rationale for the cancellation was that methyl parathion has been found to pose unacceptable dietary risks to children (Environmental Protection Agency 1999). The mode of action for bee kills appears to be that honey bees in the pesticide treated orchards do not distinguish between the microencapsulated pesticide particles and pollen grains on blooming ground plants, such as clover. Foraging honey bees therefore carry contaminated pollen back to the hives where the pesticide kills young adult bees that process the contaminated pollen for feeding to larval stages of the bees (Burgett and Fisher 1977; Johansen and Kious 1978; Stoner et al. 1978; Rhodes et al. 1979). Both adult hive bees and larval honey bees are killed, and in some cases there is a break in the brood cycle, the queen may be superceded, or the entire colony may be killed (Johansen 1978). For the grower, there are two main advantages of microencapsulating a toxic pesticide. One is a reduced hazard for pesticide applicators that may contact the material they are spraying (Ivy 1972). The second advantage is an increased residual time during which the chemical is still active after it is applied (Ivy 1972). The pesticide is released slowly as the microcapsules dry out (Graham 1980). 34
44 However, these same qualities contribute to the increased hazard to honey bees. The plastic shell makes the pesticide safer for applicators, but also allows the material to be picked up by honey bee foragers. While other pesticides kill foragers in the field, microencapsulated methyl parathion does not generally kill the foragers that collect it because the microcapsules are collected in pollen loads and not ingested by the foragers. Matthenius (1973) used simple screen pollen barriers to block entrance of pollen contaminated with Sevin-4-oil pesticide and found a substantial reduction in bee losses. Such blockage of contaminated pollen points to the potential use of pollen traps to minimize or eliminate the introduction of pollen contaminated with microencapsulated pesticides. Materials and Methods The honey bees used in this study were all of Italian-hybrid stock. The hives consisted of one brood chamber and one honey super and were populated with about 30,000 bees. The studies were carried out in four locations: A cooperator s apple orchard in Henderson County, North Carolina., the Simpson Research Farm in Clemson, South Carolina, the North Carolina State University Research Farm in Clayton, N.C. and another cooperator s apple orchard in Edneyville, N.C. The pollen traps used in these studies were model 525U purchased from CC Pollen company 1 and measure 50.8 cm x cm x cm (LxWxH). The traps were made of wood and house two 5-mesh wire screens through which incoming bees must pass in order to enter the hive. The screens extend horizontally over most of the area under the hive body and are cm apart. This arrangement serves to dislodge 35
45 Figure 1. Pollen trap with open collecting drawer and arrows pointing to modified bee exits 60-70% of incoming pollen loads. A pollen-collecting drawer is situated beneath the screens and four small exit holes fitted with short (7 10 cm) plastic tubes allow drones and workers to leave the hive without going through the pollen barrier. Except in Study 1, the exits were enlarged from 1.27 cm diameter holes (with cm inner diameter tubes) to cm holes (with 1.27 cm inner diameter tubes) (Figure 1). The tubes were modified by smearing a small quantity of petroleum jelly on the surface to discourage incoming foragers from landing and entering through the exit tubes. The dead bee traps used in all of these studies except for Study 1, were made according to the specifications described by Gary and Lorenzen (1984), but were modified to increase the overall height of the traps to cm. This height adds 5 inches to the original plans in order to account for the presence of the pollen traps. Latex 1 CC Pollen Co E. Indian School Rd. Suite 209 Phoenix, AZ
46 gloves were worn while taking samples that were potentially contaminated with pesticide. The gloves were removed and replaced by fresh gloves for each sample that was taken to reduce contamination of the residue analysis. The following five studies took place between August, 1997 and August, Henderson County, North Carolina, 1997 On 18 August 1997, 20 hives of honey bees were moved into a Henderson County, N.C. apple orchard. Ten of the hives were equipped with pollen traps, and ten were used as control hives. The test orchard had a substantial amount of clover (Trifolium repens) growing in the ground cover under and around the trees. Preliminary samples of clover growing near the hives and pollen from the pollen traps were collected and analyzed for the presence of methyl parathion. On the morning of August 19, the orchard was sprayed with Penncap-M per label directions. On the afternoons of August 20 and 21, samples of dead bees in and at the entrance of each of the hives, live bees from each hive, and pollen samples from the ten pollen traps were collected. These samples were tested by the North Carolina State University Pesticide Residue Laboratory (NCSU PRL) for the presence and amount of methyl parathion. The beekeeper that owned the hives was asked to monitor and report any changes in the bee colonies after the test. 37
47 2. Clemson, South Carolina, June 1998 On June 12, hives of honey bees were moved into a peach orchard on the Simpson Research Farm in Clemson, South Carolina. Preliminary samples of clover growing near the hives and pollen from the pollen traps were collected for methyl parathion residue analysis. One half (five) of the hives were equipped with pollen traps, and the other five hives were used as controls. In addition, dead bee traps were attached to all of the hives to collect any dead bees that died in the hives or at the hive entrances. There was some clover in bloom on the floor of the peach orchard, but conditions had been hot and dry with limited clover bloom. On June 16, 1998, the peach orchard was treated with Penncap-M per label directions. On June 17,18, 19, 20 and 24, 1998 the number of dead bees from each hive was counted. On each of those days, the dead bees, pollen from the pollen traps and clover samples were collected for pesticide analysis purposes. The hives were moved out of the orchard on June 24 and returned to the Clemson University apiary for ongoing study by the apiculturist at that institution. 3. Clemson, S.C. June 1999 On June 1, 1999, 10 hives of honey bees were moved into the same peach orchard used in the previous (1998) Clemson study. As with previous studies, one half of the hives were equipped with pollen traps and the other half of the hives were control hives. All of the hives were equipped with dead bee traps. There had not been any rainfall in the previous 2 ½ weeks, but the orchard floor was overgrown with weeds such as clover 38
48 and vetch. Preliminary samples of clover and vetch (Vicia spp.) growing in the orchards and pollen from the pollen traps were collected for methyl parathion residue analysis. On the morning of June 2, 1999, all of the hive entrances were covered with plastic bags prior to the pesticide spray in the orchard. Penncap-M was applied to the peach orchard according to the label directions. On June 2, 3, 4 and 7 the number of dead bees from each dead bee trap was counted. On each of those days, the dead bees, pollen from the pollen traps and clover and vetch samples were collected for pesticide analysis. 4. Clemson, S.C. July 1999 The same hives were used at the same location as in the previous study, using similar procedures. In addition to the samples taken in the previous study, live bees from inside the hives were sampled. On 7 July, 1999, clover from area surrounding the hives and pollen from the pollen traps were sampled. Dead bees, pollen from the pollen traps and clover from the orchard were all collected on July 8, 10 and 13 for analysis. Dead bees were also counted on July 20 and 23. On July 23, the traps were removed and the hives were left for ongoing study by the apiculturist at Clemson University. 5. Edneyville, N.C On 11 August hives of honey bees were moved into a Henderson County, N.C. apple orchard, while 6 additional hives had already been in place at the orchard. Six of the hives were equipped with pollen traps, and six were used as control hives. The test orchard had a substantial amount of clover growing in ground cover under and around the trees. 39
49 Preliminary samples of clover growing near the hives and pollen from the pollen traps were collected and analyzed for the presence of methyl parathion. On the morning of August 12, the orchard was sprayed with Penncap-M per label directions. On the afternoons of August 12, 13, 14, 17, 20 and 27 the number of dead bees from each dead bee trap was counted. On each of those days, the dead bees, pollen from the pollen traps, and clover samples were collected for pesticide analysis. These samples were tested by the NCSU PRL for the presence and amount of methyl parathion. The beekeeper that owned the hives was asked to monitor and report any changes in the bee colonies after the test. Total dead bee values and pesticide residue values were analyzed by analysis of variance, with the presence or absence of pollen traps as a factor, using SAS proc GLM. Residue values were log10 transformed to reduce variance heterogeneity (SAS Institute Inc. 1991). Analysis of Samples for Study 4 Ross Leidy Samples of bees, clover and pollen were brought to the Laboratory, logged in and frozen at 20 o C until analyzed. The following procedures were used to prepare samples for chromatography. Bees and Pollen: Whole bees (2.5 g) or 1.0 g of pollen were tared into a 250-mL Virtis blending jar (The Virtis Co., Gardiner, NY), ca. 5-g of Celite were added and the sample was blended with 100 ml of acetone for 7 min (5 min, pollen) using a Virtis Tempest homogenizer at low speed. Following settling, samples were filtered under vacuum 40
50 through a Whatman GF/B filter topped with ca. 10 g of anhyd. sodium sulfate into a 500- ml boiling flask. One hundred milliliters of acetone was added to the jar and the samples re-blended for 8 min (5 min, pollen) and filtered as described. The combined extract was evaporated to 23 to 5 ml under reduced pressure at 40 o C and transferred quantitatively with acetone to a 12-mL graduated tube. The sample was reduced to 0.2 ml under a stream of dry nitrogen and brought to 1.0 ml with hexane. The sample was transferred to a Florisil Sep-Pak (Waters Corp., Milford, MA), pre-rinsed with 10 ml of hexane. Parathion and paraoxon were eluted with 10 ml of petroleum ether followed with 20 ml of 50% ethyl ether in petroleum ether. Samples were reduced to <0.5 ml under a stream of dry nitrogen, diluted to 1.0 ml with ethyl acetate and transferred to a 2.0-mL GC vial. Clover: One gram of clover was tared into a 250-mL Virtis blending jar, ca. 5 g of Celite and 100 ml of acetone were added, blended twice and filtered as described above. Following concentration under reduced pressure at 40 o C, samples were brought to 1.0 ml with hexane and placed on a silica Sep Pak pre-rinsed with 10 ml of hexane. Samples were eluted with 8 ml of petroleum ether followed with 20 ml of 50% ethyl ether in petroleum ether. Samples were reduced to <0.5 ml, brought to 1.0 ml with ethyl acetate and transferred to a 2.0-mL GC vial. Chromatography: Samples were chromatographed on a Varian Model 3400CX gas chromatograph equipped with a Thermionic Specific Detector (TSD), Model 8200CX autosampler and Varian Star data system. The column was a 30 m by 0.53 mm fused- 41
51 silica capillary, DB-5 (1.0 µm) (J&W Scientific, Folsom, CA). Temperatures were as follows: inlet, 220 o C; Detector, 300 o C. A temperature program was run as follows: initial temperature, 180 o C, hold 1.0 min; to 220 o C at 8 o /min, hold 3 min. Helium was the carrier and makeup gas at flow rates of 3.3 and 22.4 ml/min, respectively. Gases to the detector were hydrogen and air at flow rates of 4.0 and ml/min, respectively. Injections were made in the splitless mode. Analytical standards were injected after every six samples. Data were quantitated against a 5-point standard curve. Fortified Control Samples: Two fortified recoveries were analyzed with each sample set by adding known amounts of methyl parathion and paraoxon to untreated controls and allowing solvent to evaporate for 2 h under a hood prior to extraction. RESULTS Study 1: Henderson County, N.C. August, 1997 Table 1 shows the results of the pesticide residue analysis carried out by the NCSU PRL. Table 1 also shows weather data for the location and time of study 1. Columns B and C of Table 1 list the average pesticide concentration in micrograms per gram of sample material for the two days following the pesticide spray from treated colonies, control colonies and nearby clover. Figure 2 shows these data graphically. The 42
52 Table 1. Penncap-M (methyl parathion) pesticide analysis of bees in Henderson County, N.C. August, 1997 A B C Type of sample collected Average Pesticide concentration (ug/g) 8/20/1997 8/21/1997 Live bees - pollen trap Live bees - control Dead bees - pollen trap Dead bees - control Pollen trap pollen Clover Residue differences are not significantly different (P < 0.05) Henderson County Weather 1 August - 21 August 1997 Av. Precipitation (inches) 0.01 Av. Min temp (deg. F) Av. Max temp (deg. F) Av. Mean temp (deg. F) values for pesticide residue reflect the presence of both methyl parathion and its Figure 2. Pesticide analysis of bees from Henderson County, N.C. - breakdown product which is methyl paraoxon. August, 1997 The values for all of the measurements except clover were substantially lower on Table 1. Pesticide analysis of bees in Penncap-M (methyl parathion) test in Henderson County, N.C. - August, 1997 the second day after the spray. On each of the two days, the average value for live bees A B C 2.5 from Type control of sample colonies collected was almost Average double Pesticide the value for live bees from pollen trap-treated concentration (ug/g) colonies. In addition, 2 on each day 8/20/97 the average 8/21/97 value for dead bees from control colonies Live bees - pollen trap Pesticide was Live substantially bees - control 1.5 higher than for dead 0.39 bees from 0.06 pollen trap-treated colonies. The concentration Dead bees - pollen trap Live pollen trap Dead bees - control differences (ug/g) in pesticide 1 residues were not significant for treated compared Live with control control Pollen trap pollen Dead pollen trap Clover colonies (P > ). Dead control 0 Henderson County Weather 1 August - 21 August 1997 Av. Precipitation (inches) Av. Min temp (deg. F) Av. Max temp (deg. F) Days after pesticide spray Av. Mean temp (deg. F)
53 The samples of clover blooms collected on day one and day two after the pesticide application were analyzed for methyl parathion residues. Clover from day one yielded ug/g and clover from day two yielded ug/g. Pollen from the pollen traps used on the test hives yielded ug/g for day one and ug/g for the second day. All of the 20 bee colonies in the study did survive the following winter. However, 4 out of the 10 control colonies did lose their queens which could have resulted in colony death if the queens were not replaced. The weather data included at the bottom of Table 1 was obtained from the State Climate Office of North Carolina and is included for comparison with the weather relevant to studies 2-5 listed below. Weather data is included for a period prior to the study in addition to the period that the study was conducted. Weather prior to the study period influenced the health of the clover that the bees were foraging. Complete pesticide analysis results are included in Appendix A of Master s Thesis: Pollen traps as a beekeeping integrated pest management tool: Their use in IPM for varroa mite control and for reducing the impact of microencapsulated pesticides on honey bee colonies. Complete SAS analysis results are included in Appendix B of the same thesis. Study 2: Clemson, S.C. June, 1998 Table 2 lists the total number of dead bees that were collected from the dead bee traps in the June 1998 Clemson study, which were installed on all 10 hives throughout the course of the study. Table 2 also lists the average dead bees per day over the eight day duration of the study as well as weather data for the location and time of study 2. 44
54 Table 2. Dead bee and weather data for Penncap-M study Clemson, S.C. 16 June, June, 1998 A B C D Pollen Trap Colony Dead bees per day Total Dead Bees NO NO NO NO NO YES YES YES YES YES Av. Dead bees - pollen trap Av. Dead bees - control Av. Dead bees per day - pollen trap Av. Dead bees per day - control Differences in dead bee values are not significantly different (P < 0.05) Clemson Weather 12 May - 24 June 1998 Av. Precipitation (inches) Av. Min temp (deg. F) Av. Max temp (deg. F) Av. Mean temp (deg. F) The low number of bee deaths and the limited amount of clover that was in bloom resulted in the decision not to spend the money needed for a pesticide residue analysis in this study. The weather was hot and dry and very few bees were observed foraging on the clover. Study 3: Clemson, S.C. June, 1999 Table 3 lists the total number of dead bees that were collected from the dead bee traps in the June 1999 Clemson study, which were installed on all 10 hives throughout the course of the study. Table 3 also lists the average dead bees per day over the six day 45
55 duration of the study as well as weather data for the location and time of study 3. Table 3. Dead bee and weather data for Penncap-M study Clemson, S.C. 2 June, June, 1999 A B C D Pollen Trap Colony Dead bees per day Total Dead Bees NO NO NO NO NO YES YES YES YES YES Av. Dead bees - pollen trap Av. Dead bees - control Av. Dead bees per day - pollen trap Av. Dead bees per day - control Differences in dead bee values are not significantly different (P < 0.05) Clemson Weather May 15 - June Av. Precipitation (inches) Av. Min temp (deg. F) Av. Max temp (deg. F) Av. Mean temp (deg. F) 70 The low number of bee deaths and the limited amount of clover that was in bloom resulted in the decision not to spend the money needed for a pesticide residue analysis in this study. The weather was hot and dry and very few bees were observed foraging on the clover. 46
56 Study 4: Clemson, S.C. July, 1999 Table 4 lists the total number of dead bees that were collected from the dead bee traps in the July 1999 Clemson study, which were installed on all 10 hives throughout the course of the study. Table 4 also lists the average dead bees per day over the sixteen day duration of the study as well as weather data for the location and time of study 4. Table 4. Dead bee and weather data for Penncap-M study Clemson, S.C. 8 July, July, 1999 A B C D Pollen Trap Colony Dead bees per day Total Dead Bees NO NO NO NO NO YES YES YES YES YES Av. Dead bees - pollen trap Av. Dead bees - control Av. Dead bees per day - pollen trap Av. Dead bees per day - control Differences in dead bee values are not significantly different (P < 0.05) Clemson Weather 15 June - 23 July 1999 Av. Precipitation (inches) Av. Min temp (deg. F) Av. Max temp (deg. F) Av. Mean temp (deg. F) The pollen trap-treated colonies yielded an average of 9,522 total dead bees and the control colonies yielded an average of 13,025 total dead bees. There was more rainfall in Clemson for this study (0.123 in. per day) than for the previous two studies 47
57 (0.088 and in. per day). The clover attracted more foragers than in the previous two studies. In this study, the dead bee numbers were high enough to justify pesticide residue analysis. Table 5 presents the residues measured in moles as well as the log10 transformed values for those measurements. Columns D, E and F of Table 2 show moles of pesticide. These mole values are the combined moles of methyl parathion and methyl paraoxon for each of the sample types listed. Columns G, H and I present the log10 transformed values for each of the residue values found in the previous three columns. The log transformed values are included because the statistical analysis to determine significance utilized log10 transformation to reduce variance heterogeneity. 48
58 Table 5. Pesticide residue analysis for pollen-trap pollen, dead bees and clover with log10 transformed values: Clemson, S.C. study - July, 1998 A B C D E F G H I Colony Pollen Date Pesticide in Pesticide in Pesicide in Log(pest. Log(pest. Log(pest in Trap pollen (mol) dead bees (mol) clover (mol) in dead) in clover) pollen) 4 NO 7/7/ E NO 7/7/ E NO 7/7/ E NO 7/7/ E NO 7/7/ E YES 7/7/ E YES 7/7/ E YES 7/7/ E YES 7/7/ E YES 7/7/ E NO 7/8/ E NO 7/8/ E NO 7/8/ E NO 7/8/ E NO 7/8/ E YES 7/8/ E YES 7/8/ E YES 7/8/ E YES 7/8/ E YES 7/8/ E NO 7/9/ E NO 7/9/ E NO 7/9/ E NO 7/9/ E NO 7/9/ E YES 7/9/ E YES 7/9/ E YES 7/9/ E YES 7/9/ E YES 7/9/ E NO 7/10/ E NO 7/10/ E NO 7/10/ E NO 7/10/ E NO 7/10/ E YES 7/10/ E YES 7/10/ E YES 7/10/ E YES 7/10/ E YES 7/10/ E NO 7/13/ E NO 7/13/ E NO 7/13/ E NO 7/13/ E NO 7/13/ E YES 7/13/ E E YES 7/13/ E E YES 7/13/ E E YES 7/13/ E E YES 7/13/ E
59 The statistical analysis shows that there is no significant difference between the residue values for the clover samples and the residue values for the pollen samples. There is also no significant difference between the residues found in the dead bees and the residues found in the pollen obtained from the pollen traps. Figure 3. Pesticide residue on clover sampled near hives in Clemson,S.C. - July, 1998 Residue (moles) Days from pesticide spray Residue on clover Figure 3 is a graph of the pesticide residue found on the clover samples. The graph shows residue on the clover the day before the pesticide spray, as well as the day of the spray, and one, two and five days after the spray. The residue values did not diminish substantially even five days after the spray. 50
60 Figure 4. Average pesticide residue in pollen from pollen traps in Clemson, S.C. - July, Pesticide residue (moles) Residue in pollen Days from pesticide spray Figure 4 is a graph of the average pesticide residue in the pollen that was collected from the pollen traps that were installed on 5 of the 10 hives used in the study. Pollen collected the day before the spray yielded a very small amount of pesticide residue ( mol). The residue values were a great deal higher on the day of the spray ( mol) and two days after the spray ( mol), but were much lower five days after the spray ( mol). 51
61 Figure 5. Average pesticide residue on dead bees from pollen traptreated and control colonies in Clemson, S.C. - July, Pesticide residue (moles) Dead bees from pollen trap-treated colonies Dead bees from control colonies Days from pesticide spray Figure 5 is a graph of the average pesticide residue in or on the dead bees that were collected from the dead bee traps in this study. On the day of the spray, the residue values for treated colonies ( mol) were significantly higher (P < 0.05) than the residue values for control colonies ( mol). The residue values for treated and control colonies were very similar two ( mol treated; mol control) and five days ( mol treated; mol control) after the pesticide spray. 52
62 Figure 6. Average dead bee counts for pollen trap treated versus control colonies in Clemson, SC July, Average dead bee count Control Pollen trap Days from pesticide spray Figure 6 is a graph of the dead bee counts listed in Table 5, but in Figure 6, the total counts are averaged for treated and control colonies for each of the five days that dead bee counts were taken. Heavy bee losses occurred in both treated and control colonies on the day of the pesticide spray, and two days after the spray. On the fifth day after the spray, control colonies experienced a loss similar to the first two measurements (4206 dead bees), while pollen trap-treated colonies experienced an average of only 1637 dead bees. By twelve days after the spray, dead bee numbers for all colonies were low, with an average of fewer than 400 dead bees both for treated and for control colonies. Although the dead bee counts appear dissimilar, the difference between treated and control colonies was not significant. 53
63 Study 5: Edneyville, N.C. August, 1999 Table 6 lists the total number of dead bees that were collected from the dead bee traps in the August 1999 Edneyville study, which were installed on all 10 hives throughout the course of the study. Table 6 also lists the average dead bees per day over the sixteen day duration of the study as well as weather data for the location and time of study 5. Table 6. Dead bee and weather data for Penncap-M study Edneyville, N.C. 12 August, August, 1999 A B C D Pollen Trap Colony Dead bees per day Total Dead Bees NO NO NO NO NO NO YES YES YES YES YES YES Av. Dead bees - pollen trap Av. Dead bees - control Av. Dead bees per day - pollen trap Av. Dead bees per day - control Differences in dead bee values are not significantly different (P < 0.05) Hendersonville Weather 15 July - 27 August 1999 Av. Precipitation (inches) Av. Min temp (deg. F) Av. Max temp (deg. F) The pollen trap-treated colonies yielded an average of 9,830 total dead bees and the control colonies yielded an average of 11,958 total dead bees, but the differences 54
64 were not significant. There was inches of rain per day and bees were seen foraging clover in impressive numbers. Pesticide residue analysis was initiated but due to internal problems, the residue data is not available. DISCUSSION The result of the apple orchard test in Study 1 clearly demonstrated that foraging honey bees were collecting microencapsulated pesticide (Penncap-M) with pollen grains from the blooming clover after the pesticide application and bringing the pesticide back to their colonies. Substantial amounts of pesticide were found in all of the pollen traps used in that study. The methyl parathion LD 50 for honey bees is ug. This amount equals moles. Figure 4 shows that the amount of residue in the collected pollen is greater than the LD 50 value for at least two days after the pesticide spray. The residue values in the figure reflect both methyl parathion and its more toxic breakdown product so that the residue values represent an even greater potential threat to foraging bees than the difference between the LD 50 and the amounts of methyl parathion in the pollen suggest. Pesticide residues on the orchard ground cover (clover) were present at least two days after the pesticide application. The presence of residues on the clover and in the incoming pollen loads supports the idea of a pathway from the pesticide spray to the clover to the pollen loads to the nurse bees that consume the contaminated pollen and are killed by poisoning. The clover residue data from study 4 make it clear that the pesticide was persisting in the field virtually undiminished for at least five days. This persistence 55
65 would be unexpected with most pesticide formulations, but is consistent with the intended performance of a microencapsulated pesticide. The differences between the pesticide residues found in the live bee samples in Study 1 compared with those found in the dead bee samples were substantial. These differences suggest that bee death can be attributed to pesticides entering the hives. The residue analysis of the pollen in Study 4 shows a diminished level after five days. The inconsistency between the presence of high levels of pesticide on the clover but lowered levels in the pollen on day 5 after the application can be explained by the bee deaths. If bees foraging on the contaminated clover succumb to the poison, then it makes sense that the incoming pollen loads contain a reduced amount of pesticide because at least some of the foragers may be visiting unsprayed pollen sources and this fraction may increase over the course of the study. The high number of bee deaths shown in Figure 6 supports this idea of diminishing foragers in the first few days after the spray. The presence of some pesticide residue both on the clover and in the pollen on the day before the spray can be explained by the fact that the experiment took place on an agricultural research farm. It is unsurprising that there was some pesticide residue in the area. There was no significant difference between numbers of dead bees coming from treated hives compared with controls. In three of the five studies, the numbers of bee deaths were very low. Assuming a typical colony in these studies had a population of 25,000 bees and that the typical bee has a 42 day life-span, then it could be expected that about 595 bees would die every day due to attrition. Although not all of these would die in the hive, this calculation still highlights the fact that with the low dead bees per day 56
66 values seen in these studies, it is unsurprising that there was no significant difference between treated and control colonies. Even in the Study 6, which had the highest dead bee per day values, the values were only 614 per day (treated colonies) and 747 per day (controls). Pollen traps failed to significantly reduce the number of dead bees in colonies equipped with pollen traps. Pollen traps also failed to reduce the amount of pesticide in dead bees. It may be that pollen traps are not as useful for these bee-aiding purposes as was hoped. The pollen traps are not a foolproof barrier against pesticide-contaminated pollen. In fact, they were designed to allow about half of the incoming pollen loads through to the interior of the hive. Further, the bees are surprisingly resourceful in finding ways to circumvent the intended path through the pollen traps into the hive. The exit tubes are necessary so that drones don't clog up the hive entrance, and for the most part work quite well as incoming foragers do not normally use the tubes as an entrance. However, under the conditions of these studies, with large numbers of bees were dying inside the hive, the already cramped entrance environment of the pollen trap probably became too cramped. Many bees were trying to get out of their hives while carrying their deceased nest mates. This clogging was foreseen and was the reason for expanding the diameter of the exit tubes. Incoming bees circumvented the entrance by forming bunches hanging from the exit tubes, despite the presence of the petroleum jelly put there to discourage bee contact with the outside of the tubes. The bunches of workers served as landing platforms for incoming foragers. Once she landed on a hanging bunch of workers, a forager could easily walk in through the exit tubes and circumvent the pollen traps. 57
67 These studies were intended to create conditions that would result in the pesticide poisoning of honey bees. The intent was to show that pollen traps could prevent the poisoning. Hot and dry conditions in studies 2 and 3 created a situation in which the bee colonies, despite being purposely placed in harms way, did not experience pesticide poisoning. Pollen traps didn't live up to the expectation of removing ample contaminated pollen, but the hot and dry weather found in Studies 2 and 3 did create conditions to sever the link between the pesticide and the bees. The lack of rain evidently kept the quantity of clover down and decreased the attractiveness of the available clover. Clover is known for its inability to survive periods of dry weather (Henning and Wheaton 1993). As a result, bee activity was either reduced or was concentrated on plants other than the clover. Drought, therefore, may actually be an IPM tool in some situations since it is barrier between microencapsulated pesticides and honey bees. A drought would not, however, prevent pest insects from visiting the orchard. Trees are better at weathering brief droughts than ground cover plants, and the trees continue to bear the fruit that attract the pests that require chemical control. Pesticides that drift to blooming ground cover microencapsulated or otherwise, are a potential threat to bees. These studies suggest that drought conditions may be another consideration (along with formulation, time of day, distance from hives, etc.) for making pesticide applications as safe as possible for honey bees. Two other approaches to decreasing bee death related to Penncap poisoning were use of clopyralid herbicide and mowing of the orchard floor. Although clopyralid was a promising solution to the problem of blooming weeds in orchards, the material was not 58
68 approved for orchard use by the EPA. Mowing the orchard floor isn't feasible for clover control because the clover will grow back closer to the ground soon after mowing and orchard floors tend to be composed of uneven terrain that is difficult to landscape perfectly (Owings 2002). Future studies could try to take overall weather patterns spanning a month before pesticide sprays into account. Another useful measurement for future studies may be bee activity as an indicator of blooming ground cover visits. 59
69 LIST OF REFERENCES Burgett, M., Fisher, G The contamination of foraging honey bees and pollen with Penncap-M. American Bee Journal. 117:(10): Environmental Protection Agency U.S. EPA EPA Methyl Parathion Risk Management Decision. [online] Available from: Accessed 2002 November 6. Gary, N.E. and K. Lorenzen Improved trap to recover dead and abnormal honey bees (Hymenoptera:Apidae) from hives. Environmental Entomology 13(3): Graham, J Penncap-M still a bee threat, but progress is being made. American Bee Journal. 120: Henning, J. C. and H. N. Wheaton White, ladino and sweet clover. University of Missouri Crops Publication G4639. Ivy, E.E Penncap-M: an improved methyl parathion formulation. Journal of Economic Entomology. 65(2): Johansen, C.A What is bee poisoning? Gleanings in Bee Culture. 5: Johansen, C.A., Kious, C.W Bee poisoning characteristics of microencapsulated methyl parathion. Gleanings in Bee Culture. 5: Mason, C.E Progression of knockdown and mortality of honey bees (Hymenoptera: Apidae) sprayed with insecticides mixed with Penncap-M. Environmental Entomology. 15: Matthenius, J.C Pollen trapping to prevent beehive contamination. Gleanings in Bee Culture. 9: Owings, M Personal Communication. Rhodes, H.A., Wilson, W.T., Sonnet, P.E., Stoner, A Exposure of Apis mellifera to bee-collected pollen containing residues of microencapsulated methyl parathion. Environmental Entomology. 8: SAS Institute Inc Product Support Manual, Version 12. SAS Publishing, Cary, NC. 60
70 Stoner, A., Sonnet, Wilson, W.T., Rhodes, H.A Penncap-M collection by honey bees. American Bee Journal. 118:
71 Manuscript 2: Pollen Traps as a Tool for Varroa Mite Control Introduction Since the introduction of Varroa mites (Varroa destructor) to the U.S. in 1986, Varroa mite infestation has been the most serious problem facing the U.S. beekeeping industry. Nearly all feral honey bee colonies have been lost due to varroa mites (Krause and Page 1995), and in addition, it is estimated that varroa mites are responsible for the deaths of at least 30% of the honey bee colonies managed by people (Ambrose 2000). Although effective pesticides to control the mites do exist, there are problems with each of them. Fluvalinate is the most commonly used acaricide, and is sold in a plastic strip formulation called Apistan. Apistan was the exclusive chemical means to combat varroa mites in the U.S. for a period of years, and frequent misuse during that time has accelerated the inevitability of fluvalinate-resistant mites. Fluvalinate resistance has been found in Europe (Lodesani et al.1995; Milani 1999) and in the U.S. (Elzen et al.1998; Elzen et al.1999). Such reports are becoming commonplace which is unfortunate since the product is highly effective and safe from a human standpoint. A plastic strip formulation of the organophosphate coumaphos (Checkmite ) is also effective for varroa control. However, concerns about the use of an organophosphate by the beekeeping industry include greater risk of contaminated hive products. Such contamination could cause a public health risk. As with any pest subjected to the repeated use of a given pesticide, varroa mites can become resistant to coumaphos. Some evidence of coumaphos-resistant mites has been shown in Europe (Milani 1999), and recently, Nasr (2002) reported mites showing resistance to coumaphos 62
72 in New Jersey. Another limitation of coumaphos is that it is made available only by EPA section 18 Emergency Exemption, and it is not labeled as a general use pesticide. A third chemical option for varroa control is formic acid. In February of 2000, a gel formulation of formic acid was approved and labeled for use in U.S. beehives. The new product has been shown to be about 70% effective against varroa mites, and is effective against tracheal mites (USDA Beltsville 1999). As of this writing, however, this formic acid product is unavailable due to problems with the formulation and packaging discovered after its public release. Due to the limitations of acaricides (resistant mites, honey and wax contamination), non-chemical options for varroa mite control are desirable. Nonchemical treatments such as screen bottom boards (Pettis and Shimanuki 1999) and pollen traps (Hart and Nabors 2000) may be most effective as part of an integrated pest management program. The goal of IPM is not to eliminate chemical treatments, but to minimize and optimize pesticide use. With an economic threshold for mite populations in mind (Delaplane and Hood 1999), an IPM plan for varroa mite control can incorporate pesticide and non-pesticide measures. Pollen traps were invented so that beekeepers could collect pollen for sale in the marketplace. All pollen traps operate on the premise that pollen loads can be dislodged from the corbiculae (pollen baskets) of incoming foragers and collected, or trapped, so that the bee-collected pollen can be easily obtained by the beekeeper. NCSU personnel and other researchers have observed that varroa mites are occasionally found in pollen trap collecting drawers along with the pollen loads. The expectation is that the screens in the pollen traps can fortuitously serve to remove varroa 63
73 mites from incoming foragers (older workers). The removal of mites from incoming foragers is a benefit that should be contrasted with the mode of action of chemical acaricides, which remove mites from the entire population of adult bees. In addition, pollen traps may remove varroa mites in a manner similar that accomplished by screen mesh bottom boards (Pettis and Shimanuki 1999) since pollen traps do provide a screen that covers most of the area under the hive body. The quantity of mites which happen to be removed from honey bee colonies by pollen traps, and the effect this removal may have on overall mite populations have not been studied in detail. The studies reported here were designed to evaluate the impact of pollen traps on varroa mite population reduction, and to compare these results with the standard Apistan treatment. Materials and Methods Study I On 15 November 1999, 16 honeybee colonies were sampled for mite levels. The colonies were of Italian-hybrid stock, and located in the NCSU apiary in Raleigh, NC. Eight of the colonies were assigned to a high mite infestation category (0.2 or more mites per bee). The other eight colonies were assigned to a low mite infestation category (.18 or fewer mites per bee). For each mite infestation category, 4 of the 8 colonies were installed over commercial pollen traps, while the other 4 colonies were treated with Apistan. The treatments were assigned randomly within each infestation category. Over the course of 56 days, the numbers of mites in the pollen trap collecting drawers were counted on November 16, 17, 18, 22, 23, 26, December 3 and January

74 The 56-day treatment period was chosen because it is the label-recommended duration of a full Apistan treatment. Mite kill was quantified at these same intervals. The number of mites knocked down was determined by using sticky boards made from smooth-finished cardboard coated with Pam cooking spray. The sticky boards were installed under 1/8 Figure 1. Pollen trap with open collecting drawer and arrows pointing to modified bee exits hardware cloth bottom boards. The spray was reapplied after each mite count was completed. The pollen traps used in this study were purchased from CC Pollen company 1 and measure 20 x16.25 x5 5/16 (LxWxH). The traps are made of wood and house two 5- mesh wire screens through which incoming bees must pass in order to enter the hive (see Figure 1). The screens extend horizontally over most of the area under the hive body and 1 CC Pollen Co E. Indian School Rd. Suite 209 Phoenix, AZ
75 are 7/8 apart. This arrangement serves to dislodge 60-70% of incoming pollen loads. A pollen-collecting drawer is situated beneath the screens and four small exit holes fitted with short (3-4 ) plastic tubes allow drones and workers to leave the hive without going through the pollen barrier. The exits were enlarged in this study from ½ diameter holes (with 3/8 inner diameter tubes) to 5/8 holes (with ½ inner diameter tubes). Very few bees found their way into the hive through the tubes, which were modified by smearing a small quantity of petroleum jelly on the surface to further discourage incoming foragers from landing and entering through the exit tubes. Mites per bee values and total mites collected values were analyzed by analysis of variance using SAS proc GLM (SAS Institute Inc. 1991). Study II Most aspects of this study were identical to the first study. The main differences were that Study II was larger (more colonies), and included untreated control colonies. For this study, about half of the colonies were of Italian-hybrid stock, while the other half of the colonies were of Russian stock. 35 colonies were sampled for mite populations on 12 July 2002, and placed in one of three infestation categories. Low infestation colonies had between 0.8 and 1.9 mites per bee, Medium infestation colonies had between 2.0 and 5.0 mites per bee and high infestation colonies had between 5.1 and 19.1 mites per bee. Within each infestation category, colonies were evenly subdivided into three groups: (1) no treatment, (2) Apistan treatment and (3) pollen trap treatment. The treatments were assigned randomly within each infestation category and put in place on 24 July Mite 66
76 samples were taken on July 25, 31, August 5, 9, 16, 30, and September 6 and 17. In addition, all colonies, including the control (no treatment) colonies, were sampled for mite levels on July 31, August 9, 30, and September 17. The mite-level assessment was done by scooping about 100 bees directly from honey-storage combs into a jar of 90% ethanol in order to determine the number of mites per bee. Mites per bee values and total mites collected values were analyzed by analysis of variance using SAS proc GLM (SAS Institute Inc. 1991). RESULTS Study 1: Effectiveness of pollen traps compared with Apistan for Varroa mite control on honey bees 1999 study Table 1 contains the data for the colonies, treatments, quantity of mites collected and initial and final mite per bee levels. Column D shows the starting mite per bee level, column E shows the final mite per bee level and column F shows the change in the mite per bee level for each colony. In almost all cases, the mite per bee levels decreased over the course of the study. The two colonies that did experience a slight increase in mite per bee level were both pollen trap-treated colonies. The change in the mite per bee level was in most cases greater for Apistan treated colonies, with the average change in mites per bee being about five times higher for Apistan treated colonies (-0.202) than for pollen trap-treated colonies (-0.041). None of the colonies involved died during this study. 67
77 Table 1. Effectiveness of pollen traps compared with Apistan for Varroa mite control on honey bees study A B C D E F G Colony Treatment Infestation Initial mites Final mites Change in Total mites per bee per bee mites per bee collected E11 Pollentrap High E10 Pollentrap High DC5 Pollentrap High R9 Pollentrap High E13 Pollentrap Low DCR3 Pollentrap Low DCS5 Pollentrap Low DCS2 Pollentrap Low N3 Apistan High R7 Apistan High E2 Apistan High DC2 Apistan High F5 Apistan Low DCR1 Apistan Low F1 Apistan Low DCR4 Apistan Low Average collected mites per colony treated with Apistan Average collected mites per colony treated with pollen traps Average Final Mites per Bee - Apistan Average final mites per bee -pollen traps Results with the same superscript are not significantly different (P < 0.05 ) Average final mites per bee values significant at (P < 0.01 ) level Average change in mites per bee - Apistan Average change in mites per bee - pollen traps [1] [1] [1] [2] The values in column E can be used to determine whether mite levels in each colony are above the economic treatment threshold. Delaplane and Hood (1999) established this threshold for the southeastern U.S. and report that a mite per bee level of 0.05 or above indicates that the bee colony can optimally benefit from a chemical acaricide treatment. Pollen trap-treated colonies were in all cases above the threshold, 68
78 while Apistan treated colonies were in all cases below the threshold. The average value for final mites per bee was significantly higher (P < 0.01) for pollen trap-treated colonies (0.139) than for Apistan treated colonies (0.006). Column G shows the total number of mites that were collected for each colony, either in the pollen traps or on the sticky boards that were installed under the Apistantreated colonies throughout the course of the study. The values in column G include mites that were dead and mites that were still alive but had been permanently removed from the colony environment. The average number of mites collected for Apistan (2248.9) and pollen trap-treated colonies (1836.4) was not significantly different (P < 0.05). However, the statistical analysis did show that the infestation category (column C) did have a significant effect on the number of mites collected. Colonies in the high infestation category, regardless of treatment, yielded significantly higher collected mite numbers (P < 0.05) than colonies in the low infestation category. 69
79 Figure 2. Cumulative Averaged Mites Collected 11/16/99 through 1/10/ Cumulative Mites * Day * Apistan Pollen Trap * = 50% of collected mites The average number of mites collected for Apistan (2248.9) and pollen trap-treated colonies (1836.4) was not significantly different (P < 0.05) Figure 2 shows the manner in which the values in column G were accumulated over time. The values for the Apistan treated colonies were consistently higher throughout the study. For the Apistan treated colonies, 50% of the mites were collected within six days (indicated by an asterisk) after the treatments were implemented. For pollen trap-treated colonies, 50% of the mites were not collected until 17 days after the treatments were implemented. Study 2: Effectiveness of pollen traps compared with Apistan for Varroa mite control on honey bees 2002 study Four out of the original 35 colonies died during the study. Data from the four colonies that died during the course of the study were not analyzed. Two of these four were control colonies, one was a pollen trap-treated colony and the fourth was an Apistan treated colony. The last mite per bee level that was taken for the control colonies were 0.11 for one and 0.09 for the other. The last mite per bee level taken for the pollen trap- 70
80 treated colony was 0.14 and the value for the Apistan treated colony was It is of interest to note that all of these infestation levels were above the recommended economic threshold levels (Delaplane and Hood 1999). In Table 2, column D shows the starting mite per bee level, column E shows the final mite per bee level and column F shows the change in the mite per bee level for each colony. The values in column F show that two out of the eleven of the pollen trap-treated colonies showed an increase in the mite per bee level. Also, one out of the eight Apistan treated colonies, and 11 out of the 12 control colonies showed a mite per bee increase from the start to the finish of the study. 71
81 Table 2. Effectiveness of pollen traps compared with Apistan for Varroa mite control on honey bees study A B C D E F G Colony Treatment Infestation Initial mites Final mites Change in Total mites per bee per bee mites per bee collected 2 Pollentrap High Pollentrap Medium Pollentrap Low Pollentrap High Pollentrap Low Pollentrap Medium Pollentrap Low Pollentrap High Pollentrap High Pollentrap Medium Pollentrap Medium Apistan Low Apistan Medium Apistan Medium Apistan High Apistan Medium Apistan High Apistan Low Apistan Medium Control High Control Medium Control High Control Low Control Low Control Low Control Medium Control Low Control Medium Control Medium Control Low Control Medium Average collected mites per colony treated with Apistan Average collected mites per colony treated with pollen traps [1] [2] Average Final Mites per Bee - Apistan Average final mites per bee -pollen traps Average final mites per bee - control [1] [1, 2] [2] Results with the same superscript are not significantly different (P < 0.05 ) Average change in mites per bee - Apistan Average change in mites per bee - pollen traps Avererage change in mites per bee - control
82 Although the final mite per bee levels differed significantly only when Apistan treatment is compared to the controls (P < 0.05), it is notable that both the Apistan and the pollen trap-treated colonies show average final mite per bee values that are below the economic treatment threshold while the average value for the control colonies is above the threshold. In fact, while only 3 out of the 12 control colonies ended up below the threshold, 7 out of the 11 pollen trap-treated colonies and 7 out of the 8 Apistan treated colonies had a final mite per bee level below the economic threshold. The infestation level shown in column D of Table 2 was statistically determined to have such a negligible effect that it could be ignored. Figure 3 shows the manner in which the values in column G were accumulated over time. The values for the Apistan treated colonies were consistently higher throughout the study. For the Apistan treated colonies, 50% of the mites were collected within six days (indicated by an asterisk) after the treatments were implemented. For pollen trap-treated colonies, 50% of the mites were not collected until approximately 18 days after the treatments were implemented. 73
83 Figure 3.Cumulative Averaged Mites collected 7/25/02 through 9/17/02 Cumulative Mites * * Day Apistan Pollen Trap * = 50% of collected mites DISCUSSION An important element in understanding the results of these experiments is the way in which the population of Varroa destructor normally fluctuates in a bee colony over the course of a normal year. De Jong (1987) explains that mite infestation levels increase dramatically as the year comes to a close. This population explosion is a well-known aspect of the varroa problem and it explains the main differences between Study I and Study II. Study I took place in December and January with starting mite per bee levels averaging over 0.19 while Study II took place in July and August with starting mite per bee levels averaging This almost fourfold difference in starting levels is unsurprising due to the different times of year that the studies were conducted. As the year comes to a close, bee populations decline and mite populations increase, so that the 74
84 mite per bee level increases rapidly. The resulting heavy infestation is often the cause of colony death around the fall season. In Study II, the control colonies exhibit this natural increase in mite population. While the control colonies started the study with an average of 0.04 mites per bee, they finished the study with an average of more than mites per bee. Eleven out of the 12 control colonies were at or above the 0.05 mites per bee treatment threshold (Delaplane and Hood 1999) at the end while only 3 out of the 12 were at or above the threshold at the start. The striking result of Study II is that both the Apistan and the pollen traps were able to slow the natural population explosion of the mites to the point of bringing many of the colonies below the treatment threshold. Seven of the 11 colonies treated with pollen traps ended the study below the treatment threshold. Therefore, the standard acaricide treatment could be delayed in those seven colonies. These and the other colonies used in Study II will be monitored for mite levels to determine the time at which acaricide treatment will be required. Compare this result with Study I in which none of the colonies treated with pollen traps ended the study below the threshold. This seeming inconsistency makes sense in the context of the different times of year in which the two studies took place. The most striking result in Study I was the similarity between the two different treatments in the number of mites that were removed from the colonies. Colonies treated with Apistan yielded an average of mites while colonies treated with pollen traps yielded an average of mites. On the surface, this similarity might indicate that pollen traps are just as good as Apistan at controlling varroa mites. However, Apistan 75
85 had a more immediate effect. The timing of mite removal seems to be even more important than the overall numbers of mites removed. The slow and steady culling of mites accomplished by the pollen traps leaves a relatively strong population of mites inside the bee colony to continue reproducing. By quickly removing a large quantity of mites, Apistan treatment results in an overall smaller mite population than the more sluggish pollen trap treatment. These observations point to future studies in which pollen traps are placed on colonies even earlier in the season. It would certainly be of interest to repeat this type of study a third time, but timed so that the treatments are implemented in a period such as September and October which is between the periods used in these studies. Earlier placement may retard mite populations sufficiently to make an even more pronounced delay in acaricide treatment possible. Further, slowed mite population growth could make reduce the necessary number of acaricide treatments per year. Delayed or reduced acaricide treatment would have important advantages to beekeepers. Since acaricide treatment protocols require the removal of honey supers during the treatment period, a delayed treatment would create a longer period for bees to take advantage of honey flows. The bees would have more time to collect, process and store honey surpluses. This extra time would be particularly valuable in areas that experience late-season honey flows such as from goldenrod (Solidago spp.) and aster (various species in family Asteraceae). Reduced numbers of acaricide treatments would save time, labor and money for beekeepers. A fluvalinate application to a single colony costs from $6.36 to $8.80 (Dadant and Sons 2000; Mann Lake Ltd. 2000). 76
86 Reduced numbers of acaricide treatments would also reduce the risks of pesticide contamination of the honey crop and the wax comb. Since it is a synthetic pyrethroid, fluvalinate is a lipophillic material and therefore presents a greater risk of wax comb contamination than of honey contamination. Another advantage of using pollen traps is the possibility of added income from sale of the collected pollen. The wholesale price that is paid to beekeepers for pollen is generally in the range of $4 - $15 per kilogram, depending on the quality of the pollen (Schmidt and Buchmann 1993). Consumers are often willing to pay high prices for pollen and pollen products so that profits for both beekeepers and retailers can be quite high. The production of a large variety of different products containing pollen for human consumption is rising. One company reported processing 500 tons of such products to yield gross sales of $13 million in 1987 (Schmidt and Buchmann 1993). Use of pollen traps for varroa mite control and a means to delay or reduce acaricide applications would be part of an integrated pest management scheme. Other researchers, such as Hart and Nabors (2000), have investigated the use of pollen traps in IPM. In their study, Hart and Nabors combined pollen traps with drone pupae destruction as an IPM measure for varroa mite control. The current research focuses on the role of pollen traps in varroa mite control. These studies indicate that pollen traps do have a practical value in an IPM approach to varroa mite control. This IPM approach should include monitoring honey bee colonies for mite per bee levels to determine if chemical acaricide treatment is warranted. In addition to monitoring mite levels, IPM could include pollen traps or other specialized screen bottom boards (Pettis and Shimanuki 1999), use of mite-resistant bee 77
87 stocks (Rinderer et al. 2000) or recently registered essential oil products. (Ellis et al. 2001). Pollen traps are a particularly attractive option since they offer potential for extra income and they remove mites from the colony both by catching falling mites and by removing mites from foragers as they return to their hives. 78
88 LIST OF REFERENCES Ambrose, J. T Varroa Mites. North Carolina Cooperative Extension Service Beekeeping Note #3B Dadant and Sons Dadant and Sons catalog. Dadant and Sons, Hamilton, IL. De Jong, D Mites: Varroa and other parasites of brood. In Honey Bee Pests, Predators and Diseases. Roger A. Morse and Kim Flottum, eds. A.I. Root Company: Medina, Ohio. Delaplane, K. S. and W. M. Hood Effects of delayed acaricide treatment in honey bee colonies parasitized by Varroa jacobsoni and a late-season treatment threshold for the south-eastern USA. Journal of Apicultural Research 36(3/4): Ellis, J. D The future of varroa control: integrating current treatments with the latest advancements. American Bee Journal 141(2): Elzen, P. J., F. A. Eischen, J. R. Baxter, J. Pettis, G. W. Elzen, and W. T. Wilson Fluvalinate resistance in Varroa jacobsoni from several geographic locations. American Bee Journal 138(9): Elzen, P. J., F. A. Eischen, J. R. Baxter, G. W. Elzen, and W. T. Wilson Detection of resistance in US Varroa jacobsoni Oud. (Mesostigmata: Varroidae) to the acaricide fluvalinate. Apidologie 30: Hart, T. and R. Nabors Pollen traps and drone pupae destruction as a method of varroa control.. American Bee Journal 140(2): 151. Kraus, B., and R. E. Page, Jr Effects of Varroa jacobsoni (Mesostigmata: Varroidae) on feral Apis mellifera (Hymenoptera: Apidae) in California. Environmental Entomology. 24: Lodesani, M., M. Columbo, and M. Spreafico Ineffectiveness of Apistan treatment against the mite Varroa jacobsoni Oud. In several districts of Lombardy (Italy). Apidologie 26(1): Mann Lake Ltd Mann Lake Catalog. Mann Lake Ltd., Hackensack MN. Milani, N The resistance of Varroa jacobsoni Oud. to acaricides. Apidologie 30(2): Milani, N The resistance of Varroa jacobsoni Oud. to acaricides. Apidologie 30(2):
89 Pettis, J. and H. Shimanuki A hive modification to reduce varroa populations. American Bee Journal 139(6): Rinderer, T. E., L. I. De Guzman, J. Harris, V. Kuznetsov, G. T. Delatte, J. A. Stelzer and L. Beaman The release of ARS russian honey bees. American Bee Journal. 140: SAS Institute Inc Product Support Manual, Version 12. SAS Publishing, Cary, NC. Schmidt, J.O. and S.L. Buchmann Other Products of the Hive, pp In J.M. Graham [ed.], The Hive and the Honey Bee, Dadant & Sons, Hamilton, IL, USA. USDA Beltsville Apicure brochure. 80
90 GENERAL REFERENCES Ambrose, J. T The importance of honey bees in North Carolina. NC Cooperative Extension and Consumer Services Beekeeping Note No. 1A. Ambrose, J. T Varroa Mites. North Carolina Cooperative Extension Service Beekeeping Note #3B Ambrose, J. T Personal Communication. Ambrose, J. T., M. Stanghellini, J. Keller, J. Rubinstein, and K. L. Tabor Presentation at North Carolina State Beekeeper's Association Spring Meeting. March 4, 2000, Lumberton, N.C. Anderson, D. L., and J. W. H. Trueman Varroa jacobsoni (Acari: Varroidae) is more than one species. Experimental and Applied Acarology. 24(3): Appel, H. and R. Buchler Heat-treatment of brood combs for Varroa control. Apidologie 22(4): Atkins, E. L Injury to honey bees by poisoning, pp In J.M. Graham [ed.], The Hive and the Honey Bee, Dadant & Sons, Hamilton, IL, USA. Ball, B Acute paralysis virus isolates from honey bee colonies infested with Varroa Jacobsoni. Journal of Apicultural Research 24(2): Buchler, R. and W. Drescher Variance and heritability of the capped developmental stage in European Apis mellifera L. and its correlation with increased Varroa jacobsoni Oud. Infestation. Journal of Apicultural Research. 29(3): Burgett, M., Fisher, G The contamination of foraging honey bees and pollen with Penncap-M. American Bee Journal. 117:(10): Burgett, M., Fisher, G.C Recovery of Penncap-M from foraging honey bees and pollen storage cells. Environmental Entomology. 9: Calderone, N. W. and M. E. Nasr Evaluation of a formic acid formulation for the fall control of Varroa jacobsoni (Acari: varroidae) in colonies of the honey bee Apis mellifera (Hymenoptera: Apidae) in a temperate climate. Journal of Economic Entomology 92(3): Calderone, N. and M. Spivak Plant extracts for control of the parasitic mite Varroa jacobsoni (Acari: Varroidae) in colonies of the Western Honey bee (Hymenoptera: Apidae). Journal of Economic Entomology 88(5):
91 Calderone, N. W., W. T. Wilson, and M. Spivak Plant extracts used for control of the parasitic mites Varroa jacobsoni (Acari: Varroidae) and Acarapis woodi (Acari: Tarsonemidae) in colonies of Apis mellifera (Hymenoptera: Apidae). Journal of Economic Entomology 90(5): Calis, J. N. M., W. J. Boot, J. Beetsman, J. van Den Eijnde, A. De Ruijter, and J. H. P. M. Van Der Steen Control of varroa by combining trapping in honey bee worker brood with formic acid treatment of the capped brood outside the colony: putting knowledge on brood cell invasion in practice. Journal of Apicultural Research 37(3): Currie, R. W Fluvalinate queen tabs for use against Varroa jacobsoni Oud.: efficacy and impact on honey bee, Apis mellifera L., queen and colony performance. American Bee Journal. 139(11): Dadant and Sons Dadant and Sons catalog. Dadant and Sons, Hamilton, IL. Danka, R. G., T. E. Rinderer, V. N. Kuznetsov and G. T. Delatte American Bee Journal De Guzman, L. I., T. E. Rinderer, and L. D. Beaman Survival of Varroa jacobsoni Oud. (Acari: Varroidae) away from its living host Apis mellifera L. Experimental and Applied Acarology 17: De Jong, D Mites: Varroa and other parasites of brood. In Honey Bee Pests, Predators and Diseases. Roger A. Morse and Kim Flottum, eds. A.I. Root Company: Medina, Ohio. De Jong, D., P. De Jong, and L. Goncalves Weight loss and other damage to developing worker honey bees (Apis mellifera) due to infestation with Varroa Jacobsoni. Journal of Apicultural Research 20: DeJong, D., J. Seiner, L. Goncalves, and R.A. Morse Brazilian varroa research rates current treatments too expensive. American Bee Journal. 124(2): Delaplane, K. S. and W. M. Hood Effects of delayed acaricide treatment in honey bee colonies parasitized by Varroa jacobsoni and a late-season treatment threshold for the south-eastern USA. Journal of Apicultural Research 36(3/4): Delfinado-Baker, M Acarapis woodi in the United States. American Bee Journal. 124(11): Eischen, F. A. and W. T. Wilson The effect of natural products smoke on Varroa Jacobsoni: an update. American Bee Journal 137:
92 Ellis, J. D The future of varroa control: integrating current treatments with the latest advancements. American Bee Journal 141(2): Elzen, P. J., F. A. Eischen, J. R. Baxter, J. Pettis, G. W. Elzen, and W. T. Wilson Fluvalinate resistance in Varroa jacobsoni from several geographic locations. American Bee Journal 138(9): Elzen, P. J., F. A. Eischen, J. R. Baxter, G. W. Elzen, and W. T. Wilson Detection of resistance in US Varroa jacobsoni Oud. (Mesostigmata: Varroidae) to the acaricide fluvalinate. Apidologie 30: Environmental Protection Agency U.S. EPA EPA Methyl Parathion Risk Management Decision. [online] Available from: Accessed 2002 November 6. Fries, I Treatment of sealed honey bee brood with formic acid for control of Varroa jacobsoni. American Bee Journal 131(5): Fries, I. and H. Hansen Biotechnical control of varroa mites in cold climates. American Bee Journal 133(6): Gary, N.E. and K. Lorenzen Improved trap to recover dead and abnormal honey bees (Hymenoptera:Apidae) from hives. Environmental Entomology 13(3): Graham, J Penncap-M still a bee threat, but progress is being made. American Bee Journal. 120: Guzman-Novoa, E., and R. E. Page. Jr The impact of Africanized honey bees on Mexican beekeeping. American Bee Journal. 134: Hanny, B. Loper, G., Harvey, J Chemical detection of Penncap-M capsules in pollen, and methyl parathion residues in honey bees (Apis mellifera L.) and bee products from colonies near Arizona cotton fields treated with Penncap-M American Bee Journal. 123: Harbo, J. R Heating adult honey bees to remove Varroa jacobsoni. International Bee Research Association 39(3/4): Harbo, J. R. and J. W. Harris. 1999a. Heritability in honey bees (Hymenoptera: Apidae) of characteristics associated with resistance to Varroa Jacobsoni (Mesostigmata: Varroidae). Journal of Economic Entomology 92(2): Harbo, J. R. and J. W. Harris. 1999b. Selecting honey bees for resistance to Varroa jacobsoni. Apidologie. 30:
93 Hart, T. and R. Nabors Pollen traps as a method of varroa control. American Bee Journal 139: Hart, T. and R. Nabors Pollen traps and drone pupae destruction as a method of varroa control.. American Bee Journal 140(2): 151. Henning, J. C. and H. N. Wheaton White, ladino and sweet clover. University of Missouri Crops Publication G4639. Hillesheim, E., W. Ritter, and D. Bassand First data on resistance mechanisms of Varroa jacobsoni (Oud.) against tau-fluvalinate. Experimental and Applied Acarology. 20(5): Hoff, F. L., and L. S. Willett The U.S. beekeeping industry. U.S. Dept. of Agriculture, Economic Research Service Agricultural economic report ; no Hopkins, D. I., C. A. Nalepa, G. D. Hackney, and K. A. Kidd Studies of the small hive beetle Aethina tumida in North Carolina. American Bee Journal. 139(7):536. Hoppe, H. and W. Ritter The possibilities and limits of thermal treatment as a biotechnical method of fighting Varroatosis. Apidologie 17(4): Horr, B. Z A pollen trap for the uni-bottom board. American Bee Journal. 139: Imdorf, A., S. B. Bogdanov, R. I. Ochoa, and N. W. Calderone. Use of essential oils for the control of Varroa jacobsoni Oud. in honey bee colonies. Apidologie 30: Ivy, E.E Penncap-M: an improved methyl parathion formulation. Journal of Economic Entomology. 65(2): Johansen, C.A What is bee poisoning? Gleanings in Bee Culture. 5: Johansen, C.A Bee poisoning survey. American Bee Journal. 119:315, 318. Johansen, C.A., Kious, C.W Bee poisoning characteristics of microencapsulated methyl parathion. Gleanings in Bee Culture. 5: Johansen, C.A. and D.F. Mayer Pollinator protection : a bee & pesticide handbook. Wicwas Press, Cheshire, CO, USA; 212 pp. 84
94 Keller, J. J Testing effects of alternative diets on reproduction rates of the small hive beetle, Aethina tumida. Master's Thesis, NCSU. Keller, J. J. and J. T. Ambrose. 2002a. Dispersion of Small Hive Beetle in the U.S by year as of June In The Yellow Book. North Carolina Beekeepers Association Annual Report. Raleigh, NC; 80 pp. Keller, J. J. and J. T. Ambrose. 2002b. Reported Incidents of Small Hive Beetles found in beehives in North Carolina as of June In The Yellow Book. North Carolina Beekeepers Association Annual Report. Raleigh, NC; 80 pp. Kommisar, A Heat treatment of varroa-infected honey bee colonies. Apiacta 20(4): Kralj, J. and G. W. Otis Practical selection to breed bees with rapid development to enhance resistance to Varroa mites. American Bee Journal. 139(3): Kraus, B., and R. E. Page, Jr Effects of Varroa jacobsoni (Mesostigmata: Varroidae) on feral Apis mellifera (Hymenoptera: Apidae) in California. Environmental Entomology. 24: Le Conte, Y., G. Arnold, and P. H. Desenfant Influence of brood temperature and hygrometry variations on the development of the honey bee ectoparasite Varroa jacobsoni (Mesostigmata: Varroidae). Environmental Entomology 19(6): Levin, M. D The effects of pesticides on beekeeping in the United States. American Bee Journal 110: 8-9. Lodesani, M., M. Columbo, and M. Spreafico Ineffectiveness of Apistan treatment against the mite Varroa jacobsoni Oud. In several districts of Lombardy (Italy). Apidologie 26(1): Mann Lake Ltd Mann Lake Catalog. Mann Lake Ltd., Hackensack MN. Marien, J Controlling varroasis by temperature treatment with an Apitherm heater. Apidologie 26(4): Mason, C.E Progression of knockdown and mortality of honey bees (Hymenoptera: Apidae) sprayed with insecticides mixed with Penncap-M. Environmental Entomology. 15: Matthenius, J.C Pollen trapping to prevent beehive contamination. Gleanings in Bee Culture. 9:
95 McArthur, A The treatment of honeybees infected by varroasis using the heating cabinet procedure and other methods. Brochure, 5th Edition. Mebourne House, Scotland. McLellan, A.R Some effects of pollen traps on colonies of honeybees. Journal of Apicultural Research. 13(2): McGregor, S. E Insect pollination of cultivated crops. U.S. Dept. Agr./Agr. Res. Serv. Agr. Hdbk Milani, N The resistance of Varroa jacobsoni Oud. to acaricides. Apidologie 30(2): Morse, R. A., and N. W. Calderone The value of honey bees as pollinators of US crops in Bee Culture 128: Morse, R. A., D. Miska, and J. A. Masenheimer Varroa Resistance in U.S. Honey Bees. American Bee Journal. 131: Nasr, M NJ varroa resistant to coumaphos. The Speedy Bee. 31(2):8. Oudemans, A. C Note VIII. On a new genus and species of parasitic acari. Notes from the Leyden Museum 24: Owings, M Personal Communication. Peng, Y., Y. Fang, S. Xu, and L. Ge The resistance mechanism of the Asian honey bee, Apis cerana Fabr., to an ectoparasitic mite, Varroa jacobsoni Oudemans. Journal of Invertebrate Pathology 49: Pettis, J. and H. Shimanuki A hive modification to reduce varroa populations. American Bee Journal 139(6): Rademacher, E How Varroa mites spread. American Bee Journal 131(12): Rinderer, T. E., L. I. De Guzman, J. M. Kulincevic, G. T. Delatte, L. D. Beaman, S. M. Buco The breeding, importing, testing and general characteristics of Yugoslavian honey bees bred for resistance to Varroa jacobsoni. American Bee Journal. 133:
96 Rinderer, T. E., L. I. De Guzman, V. A. Lancaster, G. T. Delatte, and J. A. Stelzer Varroa in the mating yard. I. The effects of Varroa jacobsoni and apistan on drone honey bees. American Bee Journal 139(2): Rinderer, T. E., L. I. De Guzman, J. Harris, V. Kuznetsov, G. T. Delatte, J. A. Stelzer and L. Beaman The release of ARS russian honey bees. American Bee Journal. 140: Rhodes, H.A., Wilson, W.T., Sonnet, P.E., Stoner, A Exposure of Apis mellifera to bee-collected pollen containing residues of microencapsulated methyl parathion. Environmental Entomology. 8: Robinson, W.S., R. Nowogrodzki, and R. A. Morse The value of honey bees as pollinators of US crops. American Bee Journal. 129: , Rosenkranz, P Temperature treatment of sealed worker brood as a method of controlling varroatosis. Apidologie 18(4): Sanford, Tom Aethina tumida New beehive pest in the western hemisphere. APIS Newsletter. 16(7): July SAS Institute Inc Product Support Manual, Version 12. SAS Publishing, Cary, NC. Schmidt, J.O. and S.L. Buchmann Other Products of the Hive, pp In J.M. Graham [ed.], The Hive and the Honey Bee, Dadant & Sons, Hamilton, IL, USA. Shimanuki, H. N Personal Communication. Shimanuki, H., N. Calderone, and D. Knox Parasitic mite syndrome: the symptoms. American Bee Journal 134(12): Smith, Barton, Jr New bee pest found in FL. American Bee Journal. 138(7):51. Smith, M.V. and A. Adie A new design in pollen traps. Canadian Bee Journal. 7:4-5, 8. Spivak, M Honey bee hygienic behavior and defense against Varroa jacobsoni. Apidologie 27(4): Stewart, J.D., Shimanuki, H Rapid-sample pollen trap for honey bees. Journal of Economic Entomology. 61:
97 Stoner, A., Sonnet, Wilson, W.T., Rhodes, H.A Penncap-M collection by honey bees. American Bee Journal. 118: Szabo, T. I Selective breeding of honey bee colonies for resistance to Varroa jacobsoni and the effects of management techniques on varroa infestation levels. American Bee Journal. 139(7): Szabo, T. I., C. R. T. Walker and A. E. Mueller Grooming Behavior as a Varroa resistance characteristic in honey bee colonies. American Bee Journal. 136: Tabor, K. L. and J. T. Ambrose The use of heat treatment for control of the honey bee mite Varroa jacobsoni. Submitted for publication to the American Bee Journal. Thorp, R. and G. Loper Bee colony management for improved pollination. Almond Facts. 49(1): USDA Beltsville Apicure brochure. Webster, T. C., R. W. Thorp, D. Briggs, J. Skinner, and T. Parisian Effects of Pollen Traps on Honey Bee (Hymenoptera: Apidae) Foraging and Brood Rearing During Almond and Prune Pollination. Environmental Entomology 14(6): Wiser, O. B The Ultimate Pollen Trap. Gleanings in Bee Culture. 11:
98 APPENDICES 89
99 APPENDIX A 90
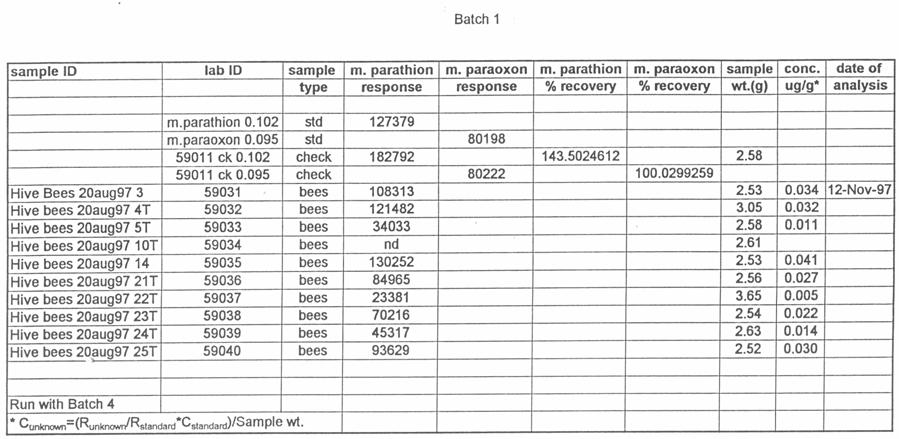
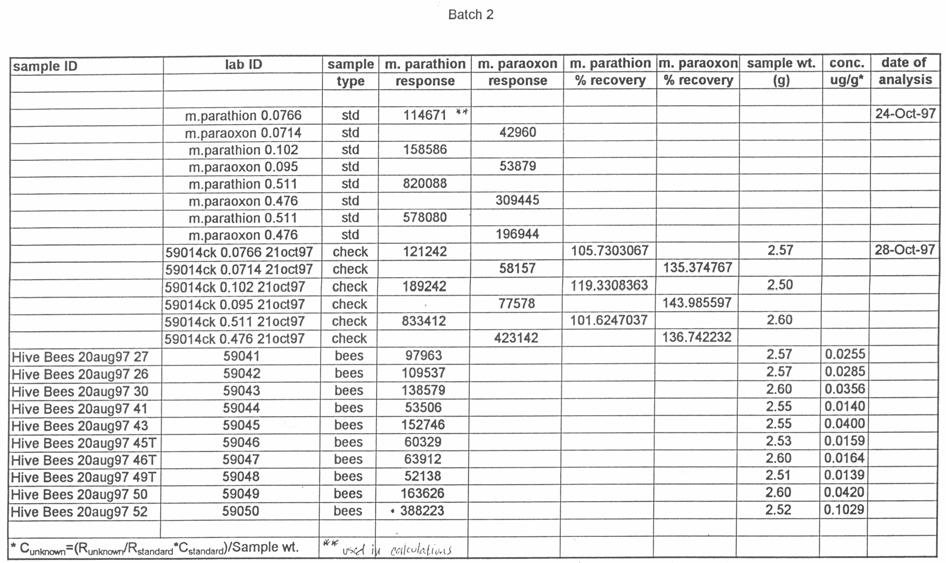
100 91
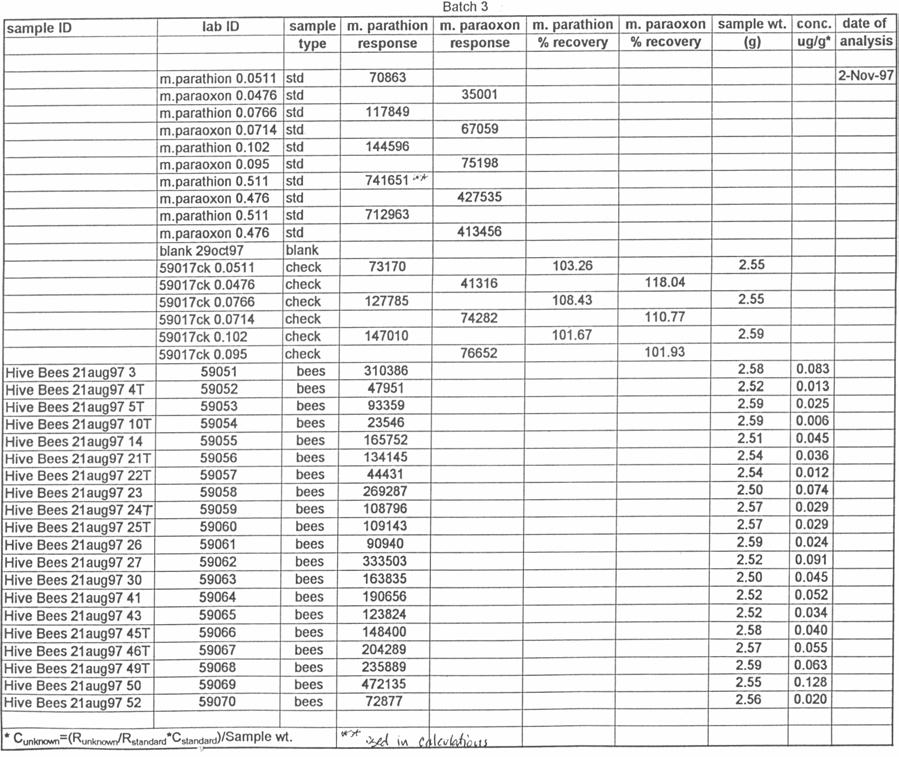
101 92
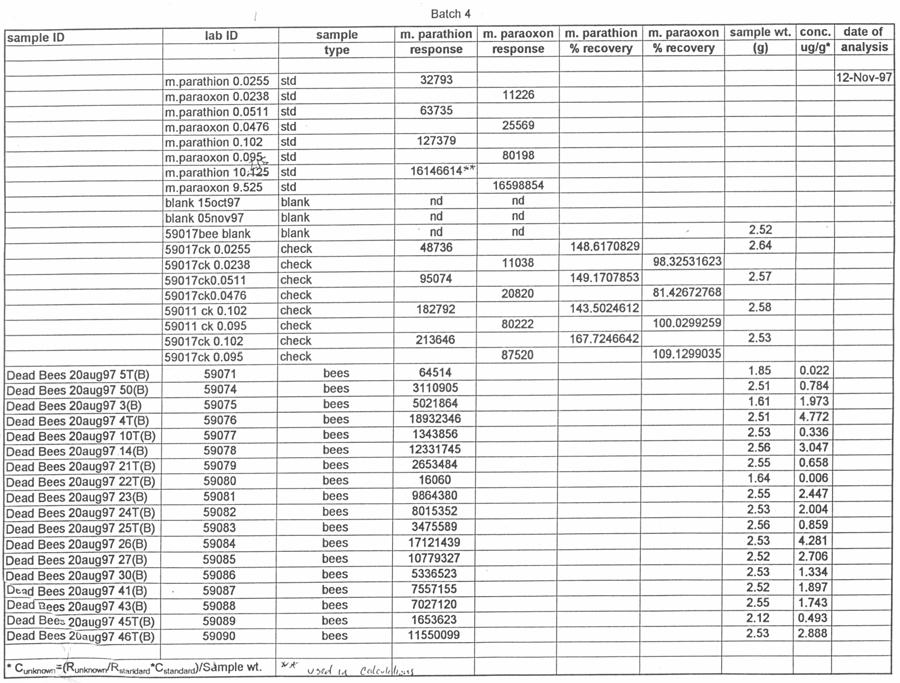
102 93

103 94
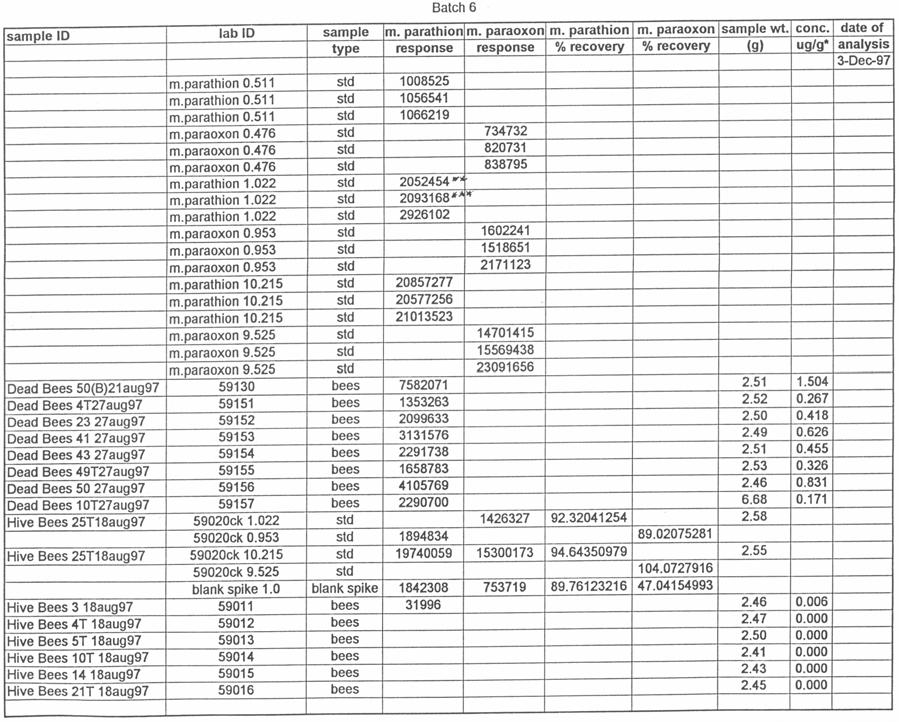
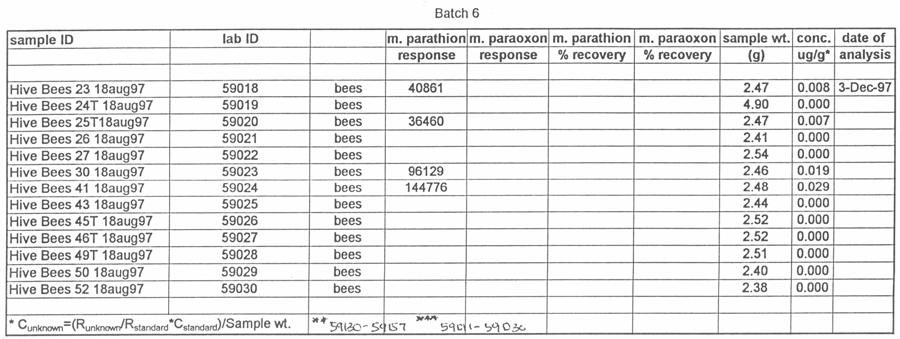
104 95
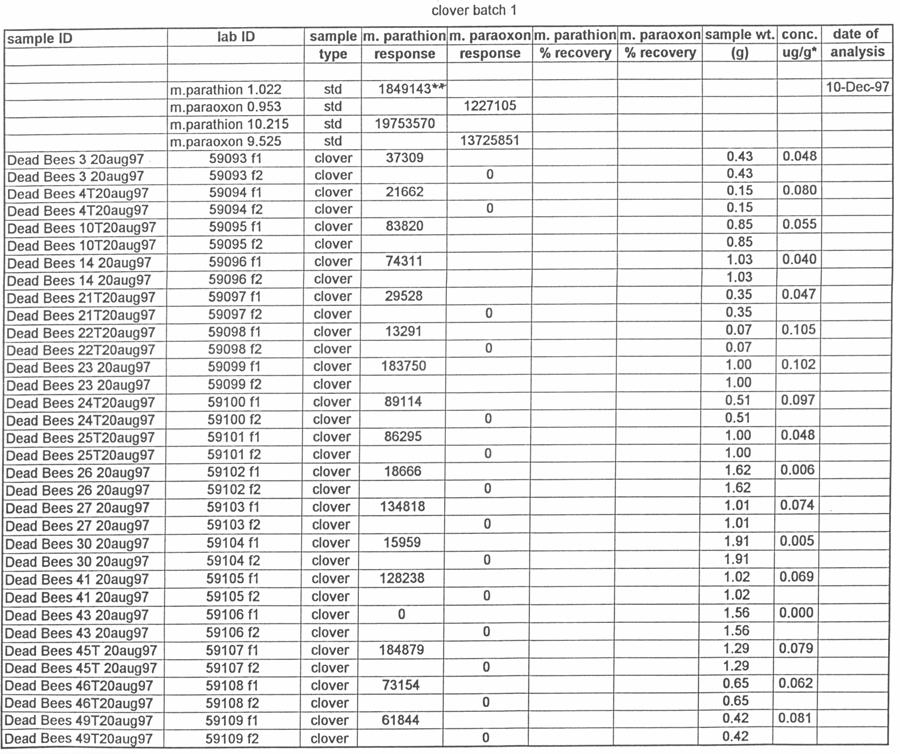
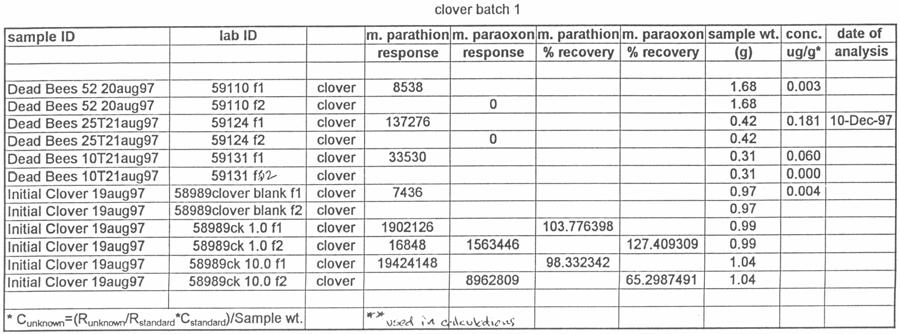
105 96
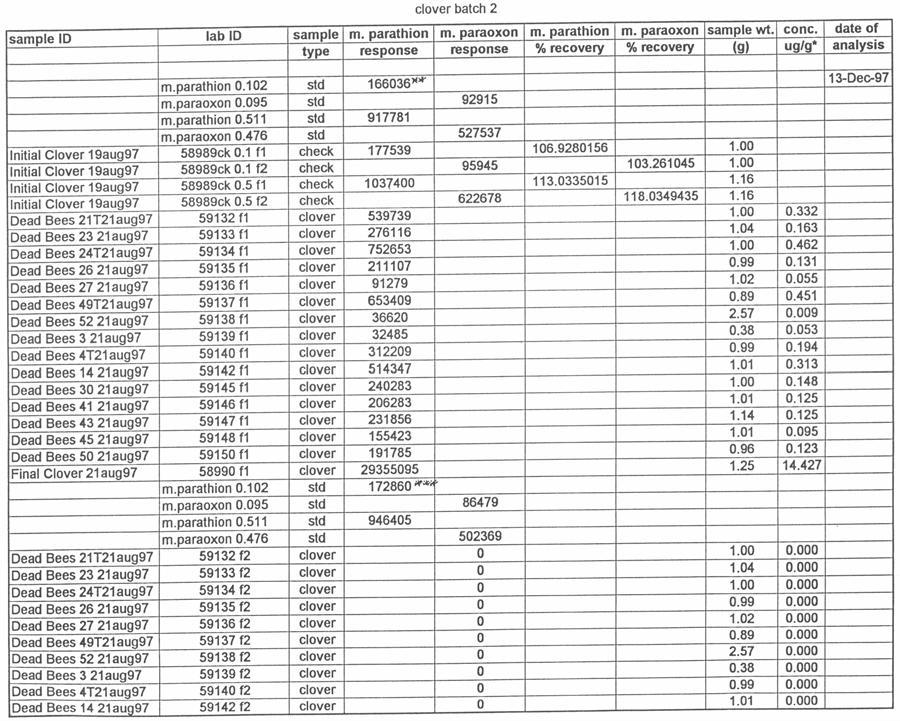
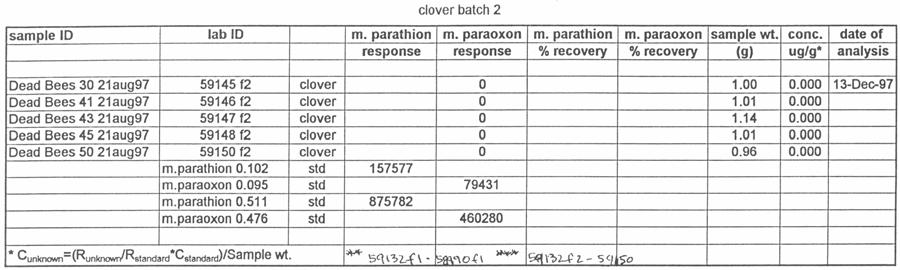
106 97

107 98