How might DNA-based information generate value in the beef cattle sector?
|
|
|
- Julianna Charla Garrett
- 5 years ago
- Views:
Transcription


1 How might DNA-based information generate value in the beef cattle sector? Animal Biotechnology & Genomics Cooperative Extension Specialist Department of Animal Science University of California, Davis Davis, CA, USA
2 Overview Where might DNA-information generate value? Value Proposition for each sector Seedstock breeder Nucleus > stud bulls to breed bulls Multiplier > stock bull to go to commercial sector Commercial cow/calf producers Feedlot Processor/Retailer Next Generation value if can solve structural and technological/logistical issues


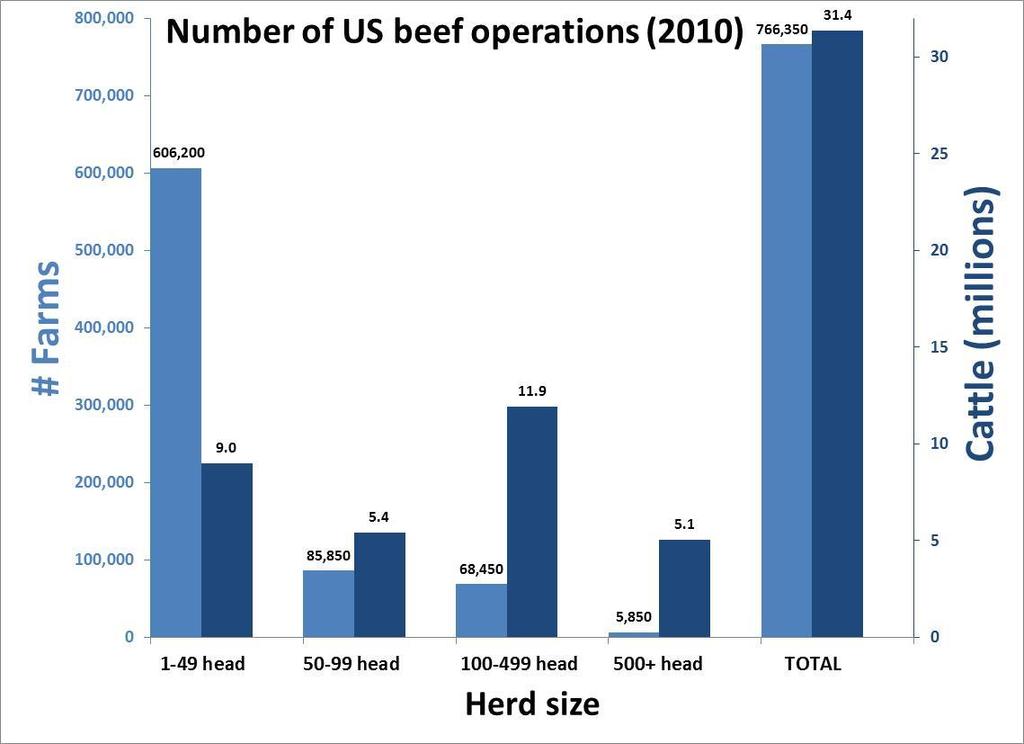
3 US cattle numbers (x 10 6 ) Breeder 1.1 Seedstock Cows # US Beef operations 766,350 Million Cows 31.4 Average herd size 122 Commercial cow/calf producer 35.7 Suckling herd Commercial Cows + replacements Feedlot Processing Retailer 13.6 (on feed at any one time) 25.6 (cattle fed per year in 2009) 43.2 Other Beef Animals (calves, steers, heifers and bulls)
4 Potential uses of genomic information for beef sectors ONLY THESE SECTORS PRODUCE NEW ANIMALS Use Seedstock Commercial Feedlot Processor DNA-assisted selection X X Parentage X X Recessive allele testing X X Control of Inbreeding X X Mate selection X X DNA-assisted management X X X DNA-based purchasing X X Product differentiation Traceability X X

5 Calving ease direct Birth weight Weaning weight Yearling weight Yearling height Mature weight Mature height Dry matter intake Residual feed intake Scrotal circumference Docility Calving ease maternal Milking ability Carcass weight Fat thickness Ribeye area Marbling score Tenderness Lead Today with 50K 50K SNP chip assays 50,000 SNPs spread throughout genome
 15. Heifer Pregnancy 16. Maternal Calving Ease 17. Direct Calving Ease 18. Docility 19. Average Daily Gain 20. Feed Efficiency 21.")
6 1. Dry Matter Intake 2. Birth Weight 3. Mature Height 4. Mature Weight 5. Milk 6. Scrotal Circumference 7. Weaning Weight 8. Yearling Weight 9. Marbling 10. Ribeye Area 11. Fat Thickness 12. Carcass Weight 13. Tenderness 14. Percent Choice (quality grade) 15. Heifer Pregnancy 16. Maternal Calving Ease 17. Direct Calving Ease 18. Docility 19. Average Daily Gain 20. Feed Efficiency 21. Yearling Height

7 American Angus Association performs weekly evaluations with genomic data recently updated to include new traits (updated 11/18/2011)
8 Potential Value of DNA information to the seedstock sector Estimate the value of using DNA test information to increase the accuracy of beef bull selection in a seedstock breeding program The expected returns from using a commercial sire sourced from a seedstock herd using DNA testing Additionally, the value of marker information in the selection of replacement stud males to be mated in a seedstock breeding program was also estimated. Van Eenennaam, A. L., J.H. van der Werf, and M.E. Goddard The economics of using DNA markers for beef bull selection in the seedstock sector. Journal of Animal Science. 89:
9 Feedlot $Index (Whole Industry Good index) Suitable for a self-replacing commercial herd in temperate Australia targeting the production of steers for the longfed markets that value marbling and 600 day growth. TRAIT FEEDLOT $INDEX PROFIT DRIVERS Calving ease direct Calving ease daughters Birth weight 600 day weight Mature cow weight Milk Days to calving Eye muscle area Retail beef yield (%) Intramuscular Fat %

10 High (h 2 ) and intermediate (½ h 2 ) accuracy DNA tests explaining genetic variation in all of selection criteria and traits in the breeding objective were used to test all male progeny from one calf crop Objective Trait h 2 Sale liveweight direct 0.31 Sale liveweight maternal 0.04 Cow weaning rate 0.05 Cow survival rate 0.03 Cow weight 0.41 Calving ease direct 0.10 Calving ease maternal 0.10 Dressing Percentage 0.33 Saleable meat Percentage 0.56 Fat depth (rump) 0.41 Marbling score 0.38 Selection criteria h 2 Birth weight d Weight d Weight d Weight 0.31 Scrotal Size 0.39 Days to Calving 0.07 Mature Cow Weight 0.41 P8 fat 0.41 RIB fat 0.34 Eye Muscle Area 0.26 Intramuscular Fat 0.25 Currently no selection criteria for many economically-important traits: Feed efficiency, feedlot performance, feedlot health, stayability/longevity, fertility, etc.
11 Value of improved selection response for stud bulls due to DNA-test increase in Long Fed / CAAB $Index accuracy Variable Unit Accuracy of DNA test used Long Fed / CAAB $Index Increased value derived from G in commercial sires AU$/ bull Intermediate 16,882 High 27,901
12 Value of improved selection response for commercial bulls due to DNA-test increase in Long Fed / CAAB $Index accuracy Variable Unit Accuracy of DNA test used Long Fed / CAAB $Index Increased value derived from G in commercial sires AU$/ Bull Intermediate 340 High 574

13 Where are returns from genetic gain ( G) in commercial bulls realized? $340 $574 Performance recording only Accuracy of DNA test used
14 Results: Value of genetic improvement (ΔG) per DNA test in commercial and stud sires Variable Unit Accuracy of DNA test used Long Fed / CAAB $Index Increased value derived from G in stud sires Increased value derived from G in commercial sires AU$/ test AU$/ test Intermediate 506 High 836 Intermediate 170 High 282
15 Are bull buyers willing to pay more for high indexing bulls? Long Fed/CAAB $Index* value was compared to bull purchase price from 645 bulls sold in Australia in 2011/2012. Six sales were examined four studs were included stud 1 (n=44), stud 2 (n=200), stud 3 (n=45); and stud 4 with 3 sales represented Southern 2011 (n=115), Northern 2011 (n=96), and Southern 2012 (n=145) 2/29/2012 Removed outlier bulls (>3 sd from average price) * 20Selection%20Indexes.pdf
16 All bulls included
17

18 Value of genomic information for recessive genetic defects Arthrogryposis multiplex (AM) is a lethal recessive deletion for which a DNA test was developed in 2008 In the 11 months following the release of the test, the American Angus Association posted the results of tests for AM on about 96,247 this amounts to $2.4 million in tests Of these, 20% (19,529) were carriers of AM. That leaves 23,638 bulls and more than 53,000 heifers which tested as free of AM. At $4K/bull and $2K/heifer ~$200 million
19 Estimates of US and Australia genetic testing costs (Angus) US AUSTRALIA AMF (Arthrogryposis multiplex) 113,526 12,021 NHF (Neuropathic Hydrocephalus ) 77,067 9,936 CAF (Congenital Contractural Arachnodactyly) 28,837 2,532 TOTAL NUMBER 294,054 34,991 COST (@ $25/test) $7,351,350 $874,775 Numbers kindly shared by Bryce Schumann, American Angus Association; and Carel Teseling, Angus Australia; current as of 5/2011
20 Break even cost of DNA testing to eliminate randomly selected carrier sires from entering a herd over a range allele frequencies (p) for a recessive lethal allele (assuming herd frequency of allele is also p). The value increases substantially if the sire is very likely to be a carrier. Allele frequency (p) Cost of calf loss if DNA testing of yearling bulls not performed (US$) Breakeven cost DNA test if testing yearling bulls entering herd (US$) All bulls tested Carrier bull <0.01 < <
21 Cost of commercially-available DNA tests for US beef cattle Seedstock producers are using DNA information for pedigree verification, genetic defect testing, and genomic enhanced EBVs. Sometimes these analyses are sent to three different laboratories, and costs can be in excess of $200 per animal. At the current time the costs of DNA extraction and genomic analyses tend to exceed the value that is returned to any single sector. Type/Purpose of DNA Test Species Cost ($US) Microsatellite or SNP-based parentage test Cattle ~$ Genetic Defects/Single gene tests Cattle ~$ Illumina Bovine 3K (just genotypes - no prediction equation)/research Cattle ~$ 38 Illumina Bovine 50K (just genotypes)/research Cattle ~$ 80 Affymetrix Bovine 650K (just genotypes)/research Cattle ~$200 Illumina Bovine 770K (HD) SNP Test (just genotypes)/research Cattle ~$ SNP Angus Profile (Igenity US/AGI)/Selection Beef Cattle ~$ 65 Illumina Bovine 50K (Pfizer Animal Genetics US/AGI)/Selection Beef Cattle ~$139


22 Extracting DNA multiple times in different labs for different applications makes about as much sense as simultaneously paying to have access to all of the following communication devices

.")
23 New genotyping platforms and technologies will mean a single DNA sample can be assayed for multiple purposes (Parentage, genetic defects, disease diagnostics, imputation to high density for predictions of genetic merit estimates, mate selection decisions to avoid inbreeding, and minimize matings between heterozygote carriers for deleterious recessive alleles, product traceback, differentiation, traceability). All in one LD plus product from GeneSeek Genomic Profiler ~ US$35-40 (+ recessive lethal royalty fees if assayed).


24 Cost of sequencing a genome What will happen when next generation sequencing meets next generation technology? Next generation VALUE derived from DNA testing Next generation thinker
25 TECHNOLOGICAL CHALLENGE: How do we collect phenotypes and DNA on all animals and make genotype information available to all sectors? ONLY THESE SECTORS PRODUCE NEW ANIMALS Use Seedstock Commercial Feedlot Processor DNA-assisted selection XXXX X XXXX XXXX Parentage XX X Recessive allele testing XX X Control of Inbreeding XX X Mate selection XX X DNA-assisted management/purchasing Product differentiation Traceability X XX XX XXXX XX
26 Ideally cattle would be genotyped ONCE early in life and genotypes shared with downstream production sectors to derive the maximum value from the fixed DNA collection and extraction costs Cattle industry Sector Mobile Device// Data Access Plan Type of DNA product // DNA information access required Cost? (US$) Nucleus seedstock/ai bulls ipad Full genome sequence $250 Seedstock/bull multiplier iphone HD 770 K genotype $50 Registered females and stock bulls for commercial sector Talk and text smart phone 50K genotype + parentage + single gene traits/recessives $25 Commercial cattle Markerassisted management (MAM), replacement heifer selection Feedlot cattle purchasing, sorting and marker-assisted management (MAM) Traceability for voluntary labelling e.g. Angus beef Prepaid cellular phone Pay as you go contract Friends and family plan Imputation LD chip + parentage + single gene traits/recessives Access genotypes from supplier (subset of LD imputation chip). Access genotypes from supplier (subset of LD imputation chip). $10 <$1 <$1 Traceability for disease outbreak/contaminated meat Emergency only phone (911 calls) Access genotypes from supplier (subset of LD imputation chip). <$1
27
28 STRUCTURAL CHALLENGE : Many cattle operations have fewer than 100 head, and most sell their cattle at auction prior to feedlot entry Whole industry selection indexes are developed to maximize the profitability of the whole supply chain In reality most producers financial returns are tied very closely to the number of calves, a function of reproduction, and less if at all to feedlot performance (e.g. feed efficiency) and carcass traits, and even less to feedlot health (e.g. respiratory) and mortalities. To incentivize the inclusion of traits that provide value in downstream sectors in selection decisions, a mechanism to equitably share some of the value derived from improved feedlot performance and carcass quality is needed to compensate breeders and producers for collecting DNA and genomic information to improve these traits, and for including them in their breeding objectives with concomitant decreased selection pressure on production traits that return value directly to producers.
29 Industry structure may evolve to enable the exchange of information and value between the different sectors. Genetics Value Proposition Price signals and performance feedback For widespread technology adoption, breeders need to be adequately rewarded for making DNA investments and selection decisions for traits that benefit the different sectors of the beef industry. Parnell, P.F Effective value chain partnerships are essential for rapid adoption of beef genetics technology. Association for the Advancement of Animal Breeding and Genetics
30 Concluding thought. Breeds/groups that can organize themselves and technologically and structurally to seamlessly obtain and marry entire supply chain phenotypes and genotypes and take advantage of the rapidlydeclining cost of genotyping to capture the cumulative value derived from using genomic information for multiple purposes (selection, parentage, genetic defects, marker-assisted management, product differentiation, traceability) will be ideally positioned to fully realize the nascent potential of genomic information.


 from the USDA National Institute of")
31 Thanks for inviting me! Value proposition work supported by National Research Initiative competitive grant no ( Integrating DNA information into beef cattle production systems ) from the USDA National Institute of Food and Agriculture Animal Genome Program.
32
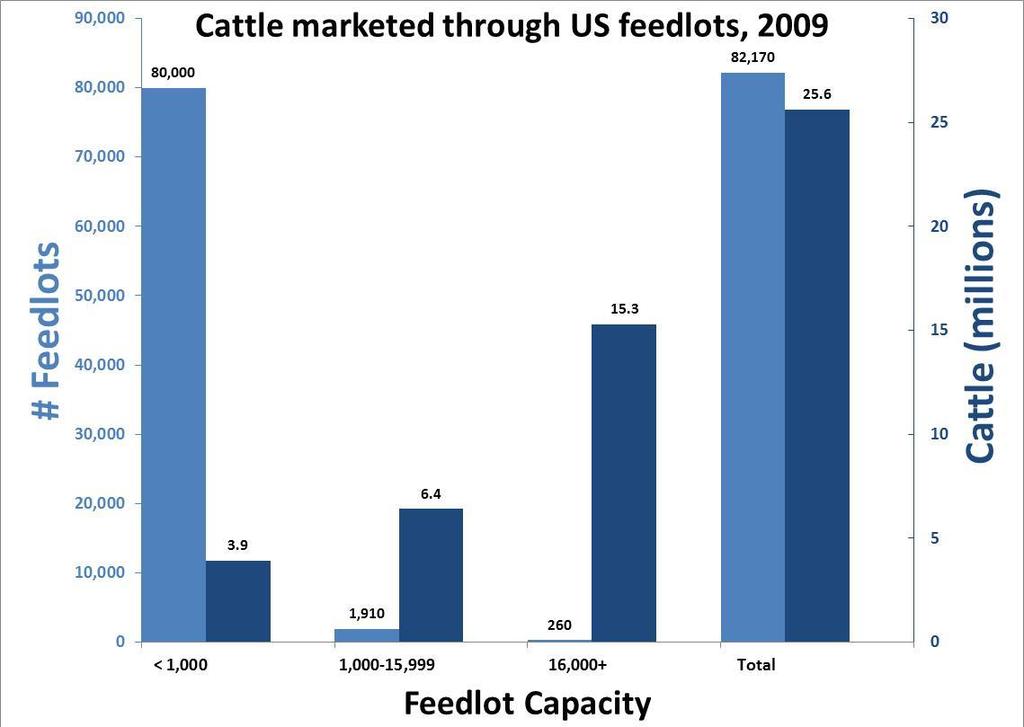
33 There are 260 feedlots with a one time capacity of >16,000 cattle
34
35 Count of calving beef cows in various categories of cow size on the ICBF database and with at least one cow calving record in the period May 2007 to May There were 6.5 million cattle in Ireland; according to the June livestock survey on the 30th June 2011 Evans et al Developments in National and International beef evaluations; some experiences from Ireland. INTERBULL Meeting Niagara Falls, NY, June 16 th -19th, 2008
36 Different herd classifications based on type of beef cows calved for herds with at least one cow calving record in the period May 2007 to May 2008 in ICBF database. Type of herd on ICBF database Count of herds Count of cows calved Average number of cows per type of herd Pedigree Crossbred Crossbred beef cows only 40, , Pedigree beef & crossbred beef cows Pedigree beef, crossbred beef & dairy cows 5, , , Pedigree beef cows only 702 5, Pedigree beef and dairy cows 5 1, TOTAL 48, , Evans et al Developments in National and International beef evaluations; some experiences from Ireland. INTERBULL Meeting Niagara Falls, NY, June 16 th -19th, 2008