Incentives for Animal Traceability in the U.S.
|
|
|
- Christina Nash
- 5 years ago
- Views:
Transcription

1 Incentives for Animal Traceability in the U.S. Ted Schroeder Agricultural Economist Kansas State University July 20, 2010

2 Benefit-Cost Analysis of the National Animal Identification System NAIS Benefit-Cost Research Team: Dale Blasi, Kansas State University Gary Brester, Montana State University Chris Crosby, Kansas State University Kevin Dhuyvetter, Kansas State University Jennifer Freeborn, Kansas State University Dustin Pendell, Colorado State University Gary Smith, Colorado State University Ted Schroeder, Kansas State University Jeri Stroade, Kansas State University Glynn Tonsor, Michigan State University APHIS Project Coordinator: Dr. John Wiemers Full Report available at: NAIS Benefit-Cost Analysis Study Results


3 1. - Literature - Expert opinions - Industry meetings - Private and public data - Statistical analyses 2. Direct cost estimates Price " P r P r " P f P f B S r " S f " S r S f D r 3. Economic model Equilibrium Displacement Model A Q 2 Q 0 D f ' D f Quantity 4. Net Benefits or Costs Allocated to: - Producers - Wholesale - Retail - Consumers NAIS Benefit-Cost Analysis Study Results

4 What Creates Product Demand? or what will encourage someone to buy your product instead of a competitor s, even if your product has a higher price??
5 What Creates Product Demand? or what will encourage someone to buy your product instead of a competitor s, even if your product has a higher price?? Perceived Value of Product: 1. Intrinsic product attributes (freshness, quality, visual, tenderness, color, flavor, purge, convenience, etc.) 2. Trust (certifications, inspections, traceability, reputation, labeling, past experience, advertising, public information, health etc.)
6 Global Perceptions Interviews of CEOs and food directors gatekeepers in Europe (UK, Germany, Netherlands, Greece, Italy) in the eyes of the food channel members interviewed, New Zealand is in the fortunate position of being perceived as less risky than many other countries, as a direct result of the efforts that have been made to institute the best quality control and traceability systems and technology available. Knight, Holdsworth, and Mather 2007 Journal of International Business Studies
7 U.S. August 2009 Newswire: 8/20/2009 8/20/2009 8/19/2009 8/13/2009 8/7/2009 8/7/2009 8/5/2009 Taiwan bans Creekstone beef plant Russia considering ban of 15 U.S. beef exporters Russia bans Iowa pork plant Mexican commission recommends halt on JBS-Swift ground beef Russia bans six U.S. poultry plants Columbia blocks imports of Minnesota poultry China bans U.S. pork, poultry plants Source: Meatingplace.com
8 U.S. August Newswire: 8/20/2009 8/20/2009 Taiwan bans Creekstone beef plant Russia considering ban of 15 U.S. beef exporters 8/19/2009 8/13/2009 Russia bans Iowa pork plant Does US have a Trust problem in the global meat market? Mexican commission recommends halt on JBS-Swift ground beef 8/7/2009 8/7/2009 8/5/2009 Russia bans six U.S. poultry plants Columbia blocks imports of Minnesota poultry China bans U.S. pork, poultry plants Source: Meatingplace.com
9 U.S. Recent Newswire: 7/01/2010 6/30/2010 6/28/2010 House subcommittee cuts NAIS funding to zero Experts lay out challenges for U.S. beef exports Lack of US traceability noted Canada-China beef deal opens industry s eyes 6/17/2010 6/14/2010 6/02/2010 Poultry weathering export problems with help from USDA Russian and Chinese import restrictions Russia throws another wrench in U.S. prepared meat exports Russia suspends meat imports from JBS plants Source: Meatingplace.com
10 Industry Benefits of Tracing Systems 1. Market Access 2. Enhanced animal (and human) health management

11


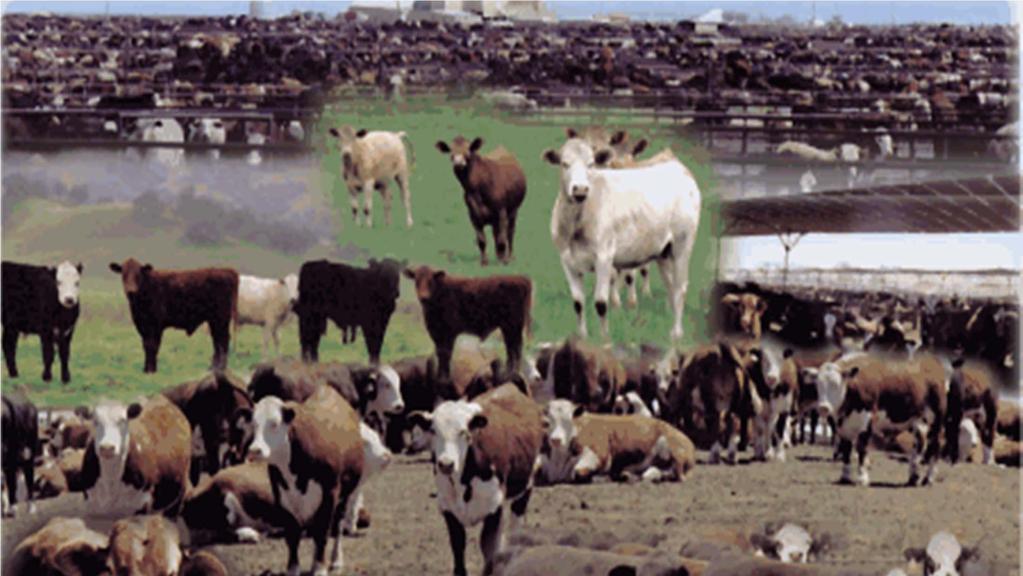
12 4 to 4.5 Million Head of Cattle Shipped into KS Annually (80,000+ hd/wk)
13 Market Access
14 Market Access 2004 alone cost US beef industry $3.2 to $4.7 billion
15 Market Access Estimated Economic Loss To Producers: 1-Day Export Market Closure (2007 Export Levels) Beef Export Market Closure for 1 year beef producer loss $9.1 million per day = $3.3 billion per year Pork Export Market Closure for 1 year pork producer loss $3.1 million per day = $1.1 billion per year


16 Market Access Approximately 75% of recently emerging infectious diseases affecting humans are diseases of animal origin; approximately 60% of all human pathogens are zoonotic. -Centers for Disease Control
17 Animal ID & Tracing Systems becoming the Global Standard Cattle Population Premises Individual Group Electronic Record Country (mln head) ID Cattle ID Lot ID ID Movement Australia 28.6 M M V M M Brazil M V M V M Canada 14.8 V M M V Uruguay 12.0 M M V M M Japan 4.4 M M V V M South Korea 2.5 M M V V M European Union 90.4 M M V V M Mexico 28.6 V V V V V United States 96.7 V V V V V Source: Bowling et al. (2008) M = mandatory, V=voluntary
")
18 Animal identification and product traceability from the farm to the fork must be progressively implemented worldwide Bernard Vallat Director General World Organization for Animal Health (OIE) July 2008
19 What if we do nothing? Net Annual Gain in Total Beef Producer Revenue Less Variable Costs Export Market Loss Status Quo 0% 10% 25% 50% ($/head sold) $0.00 -$7.31 -$ $36.47
20 What if we do something? Export Demand Increase 40% 35% 30% 25% 20% 15% 10% 5% Increased Beef Export Demand Needed so that Wholesale Beef, Slaughter Cattle, and Feeder Cattle Sectors Do Not Lose Any Cumulative Present Value 10-Year Surplus of Full Tracing by Adoption 8.0% 14.9% Rates 23.7% 34.9% 0% 30% 50% 70% 90% NAIS Full Tracing Adoption Rate
21 2003 Beef Export Market Shares 1% 10% 26% Canada 2% 2% Mexico Japan Canada China (Taiwan) Hong Kong Japan South Korea Mexico Russia S. Korea 32% 2008 Beef Export Market Shares 24% 3% Canada 21% 34% Mexico Japan China 5% 2% Canada China (Taiwan) Hong Kong Japan South Korea Mexico Russia S. Korea 8% 12%
22 What if we do something? 2.0% Increased Domestic Beef Demand Needed so Wholesale Beef, and Slaughter and Feeder Cattle Sectors Do Not Lose Cumulative Present Value 10-Year Surplus of Full Tracing by Adoption Rates Domestic Demand Increase 1.5% 1.0% 0.5% 0.25% 0.44% 0.69% 0.98% 0.0% 30% 50% 70% 90% NAIS Full Tracing Adoption Rate
23 So What Now? Information age with gatekeeper demand driven by intrinsic product quality and trust Global protein market is very competitive and traceability is global standard If we do nothing, we will find global market access increasingly more difficult and lose global markets -trust - animal health - zoonotics human health If we adopt traceability, considerable potential economic value
24