Not your usual SPAM but the Spatial Production Allocation Model. Ulrike Wood-Sichra IFPRI, Washington DC
|
|
|
- Nigel Norris
- 5 years ago
- Views:
Transcription


1 Not your usual SPAM but the Spatial Production Allocation Model Ulrike Wood-Sichra IFPRI, Washington DC ESRI User Conference San Diego, July 20-24, 2015
2 SPAM How it works and challenges encountered 1. What is SPAM 2. The SPAM process 3. Crop list and statistical data coverage 4. Visualization of downscaling 5. SPAM results 6. Equations behind SPAM 7. SPAM on the Web 8. Challenges & Issues 9. Validation 10. Users


3 1. SPAM?
4 1. Spatial Production Allocation Model (SPAM) Drawing on a variety of inputs SPAM uses an entropy-based, data-fusion approach to plausibly assess cropping system distribution and performance at a meso-gridded scale: 5-minute globally 30-seconds at country level (if data is available). continue
5 . continue 1. Spatial Production Allocation Model (SPAM) Major input layers for SPAM SPAM uses an entropy-based, data-fusion approach to National and subnational production statistics: area, yield (production) Production system Rural population density Cropland extent Irrigation map Crop suitability Existing crop distribution maps Crop prices
6 2. The SPAM process Sub-national area (crop) irrigated_ land 42 crops crop_land simultaneously suitable_area (crop) crop distribution (crop) other data: production systems,... (crop) PRIOR irrigated PRIOR subsistence PRIOR rainfed_high PRIOR rainfed_low pixelized area (crop) SPAM. continue
7 . continue 2. The SPAM process Behind the scene adjustments/calculations FIXED!! Sub-national area (crops) Sum >= irrigated_ land Preprocess pix = max(ag,irr) Sum >= pix = f(suit,ag,irr) Sum >= crop_land suitable_area (crop) irrigated subsistencerainfed-high PRIORS rainfed-low
8 3. SPAM2005 Crop List and... 1 wheat 14 dry beans 28 sugarcane 2 rice 15 chickpea 29 sugar beet 3 maize 16 cowpea 4 barley 17 pigeon pea 30 cotton 5 pearl millet 18 lentils 31 other fibres 6 finger/small millets 19 other pulses 32 arabica coffee 7 sorghum 33 robusta coffee 8 other cereals 20 soybeans 34 cocoa 21 groundnuts 35 tea 9 potato 22 coconuts 36 tobacco 10 sweet potato 23 oil palm 37 banana 11 yam 24 sunflower 38 plantains 12 cassava 25 rapeseed 39 tropical fruit 13 other roots & tub. 26 sesame seed 40 temperate fruit 27 other oil crops 41 vegetables 42 all the rest

9 3. and... Statistical Area Coverage subnational 1

10 3. and... Statistical Area Coverage subnational 2

11 4. Visualization of Downscaling example: Ghana harvested area rice per region
12 4. Visualization of Downscaling... continued layer 1: Northern Region - harvested area rice
13 4. Visualization of Downscaling... continued layer 2: Northern Region irrigated area harvested area rice irrigated area
14 4. Visualization of Downscaling... continued layer 3: Northern Region agricultural area harvested area rice irrigated area cropland area
15 4. Visualization of Downscaling... continued layer 4: Northern Region rural population harvested area rice irrigated area cropland area rural population
16 4. Visualization of Downscaling... continued layer 5: Northern Region suitable irrigated area rice harvested area rice irrigated area cropland area rural population suitable irrigated area rice

17 4. Visualization of Downscaling... continued layer 6: Northern Region suitable rainfed high area rice harvested area rice irrigated area cropland area rural population suitable irrigated area rice suitable rainfed high area rice
18 4. Visualization of Downscaling... continued layer 7: Northern Region suitable rainfed low area rice harvested area rice irrigated area cropland area rural population suitable irrigated area rice suitable rainfed high area rice suitable rainfed low area rice
19 4. Visualization of Downscaling... continued result 1: Northern Region allocated irrigated area rice some more data


20 4. Visualization of Downscaling... continued result 2: Northern Region allocated rainfed high area rice some more data


21 4. Visualization of Downscaling... continued result 3: Northern Region allocated rainfed low area rice some more data


22 4. Visualization of Downscaling... continued result 4: Northern Region allocated subsistence area rice some more data
23 4. Visualization of Downscaling... continued result 5: Northern Region allocated rice area total some more data scaled to FAO Country Totals

24 5. SPAM Results Crop Distribution Vegetables 2005

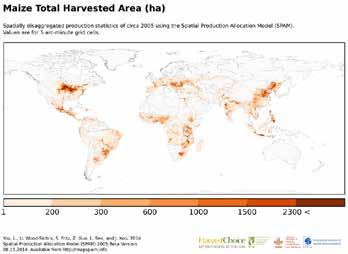
25 5. SPAM Results Crop Distribution Maize 2005
26 where potential revenue is a function of percentage of crop area, crop price, rural population density and potential yield 6. Equations behind SPAM Minimize difference between prior and allocated area share for all pixels, crops and production systems in a cross entropy equation subject to constraints (limits) dictated by existing cropland area irrigated area suitable area crop area statistics and solve in GAMS But first calculate the priors for each pixel, crop and production system as a function of potential revenue, irrigated area and agricultural land,


27 7. SPAM on the Web: MapSpam.info
28 8. Challenges & Different sources -> contradictory information Raster data not at same scale Sub-national data complete, at least level1, better level2 Conform national crops -> FAO/SPAM crops Consistencies between layers constraints met crop_land >= stats, irr >= crop_irr, suit_land >= crop_land >= stats Cropping intensities & production systems shares not consistent with data and model Validation of results (lack of established validation data, methods, and protocols)
29 8. and Issues Unreliable, often carelessly processed/validated statistics Statistics do not match admin. area shape files Unreliable cropland extent/area intensity estimates Lack of data on cropping patterns and systems (e.g. cropping intensity converting harvested to physical land footprint) Unsatisfactory data on location-specific biophysical conditions (e.g., soils) and economic behaviour (e.g., prices and risks) Lack of established validation data, methods, and protocols Scientific peer review does not imply data are fit-for-purpose Unspecified reliability of results Consistency of approach has potential tradeoff with reliability (e.g. patchwork of best national data vs consistent regional data)
30 9. Validation Validation process by other CGIAR centers (e.g. IRRI, CIAT, ILRI, CIP, CYMMT). Each focuses on their mandate crops. Crop map view parties attended by local experts and agronomists Crowd-sourcing on a dedicated website (MapSPAM.info)
31 10. Users and Applications CGIAR centers such as IRRI, CYMMT, CIP, CIAT, ILRI. FAO, World Bank, and universities. HarvestChoice, Agricultural Water Management, AgFutures Fill the gaps between micro-macro linkage, between biophysical models and economic models Widely applied in country strategy work within IFPRI, regional priority settings such as ASARECA, CORAF, and in ReSAKSS, CAADP, AGRA.

32 Thank you!