Sustainable Aquaculture
|
|
|
- Cuthbert Armstrong
- 5 years ago
- Views:
Transcription

1 Sustainable Aquaculture
2
3 Production (million t) Inland Vs. marine aquaculture Marine Crustaceans Marine molluscs Inland Production Marine Fishes Seaweeds

 Indigenous Finfish")


4 Species Groups Metric Tons Carps 19,122, % Aquatic plants 14,357, % Filter Feeding Bivalves 8,562, % Misc (Mostly) Indigenous Finfish 5,477, % Crustaceans 5,009, % Gastropods & Eichinoderms 3,875, % Salmonids 3,657, % Tilapias 2,797, % Omnivorous Catfishes 2,599, % Misc Marine Carnivores 1,591, % Other Aquatic Vertebrates 1,296, % 68,348, % FAO 2010
5 Percent of Total by Sub-Sector 45% Culture Capture 40% 35% 30% Anchovies + Farmed Salmon 25% 20% 15% Wild Salmon 10% 5% 0% Trophic Level Source: FAO (2012), FishBase (2012)
6 Sustainability indicators of animal protein production systems Protein Efficiency (%) N Emissions (kg/ton protein produced) P Emissions (kg/ton protein produced) Land (tons edible product/ha) Consumptive Freshwater Use (m 3 /ton) Beef Chicken Pork Finfish (average) Bivalve Mollusks ( ,000)* not fed * Consumptive use is difficult to compare across the wide spectrum of aquaculture production systems. In the vast majority of cases, water outfalls from aquaculture are much cleaner and more easily recycled than for land animals. (Phillips et al. 1991, FAO 2003, Hall et al. 2011, Bouman et al. 2013)

7 Edible Output per 100g Feed Input
8 Pelletier et al Ann Rev. Env. Resources

9 Source: University of Victoria & Lenfest (2010)


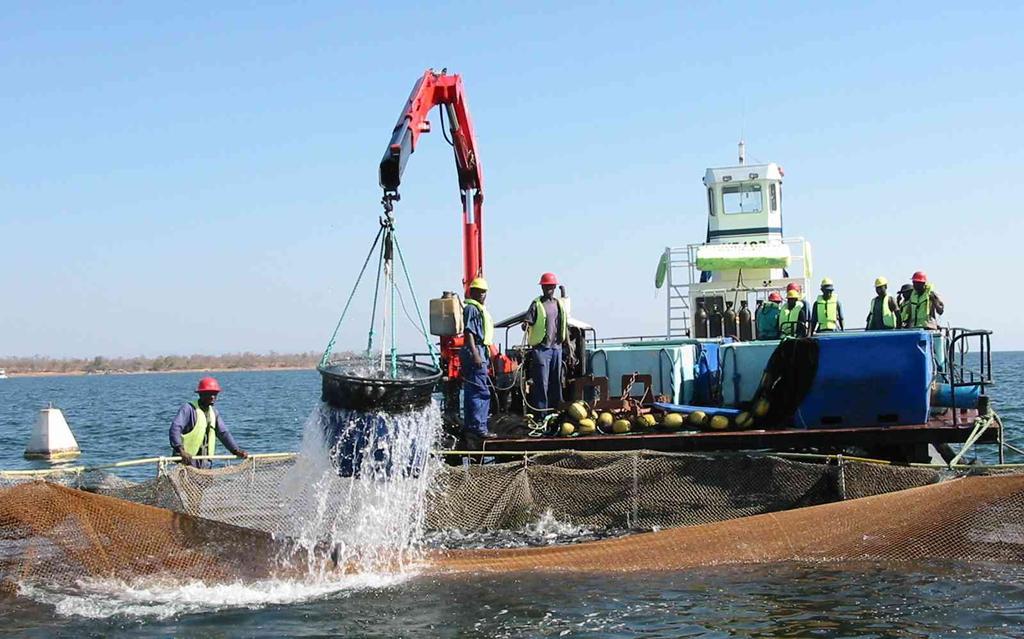
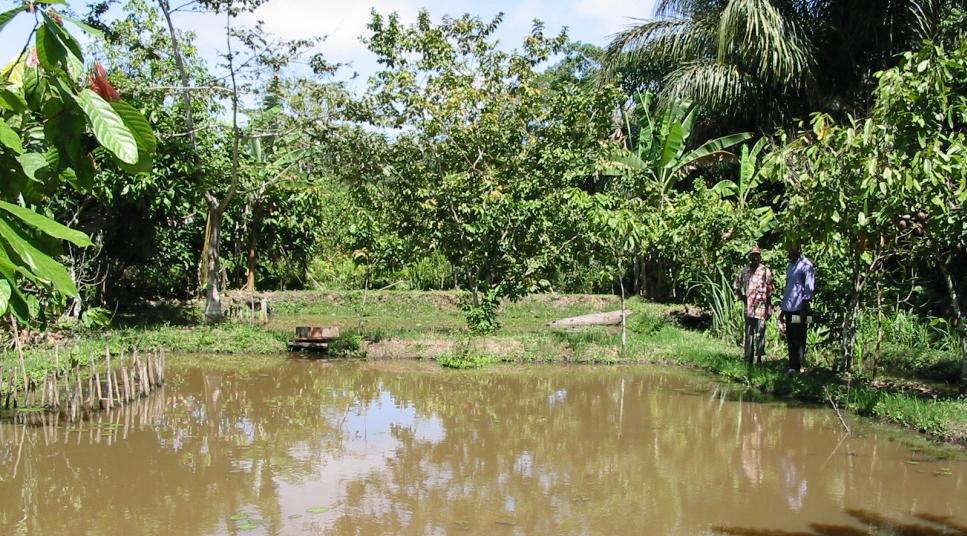
10 Who are the Producers?

")


11 23.4 million workers; 17 million (74%) small-scale, 92% in Asia; Livelihoods for 117 million (FAO)
12 Small is Beautiful Region 18,000 16,000 14,000 Aquaculture Employment (thousands) Productivity (2010) Tons of fish per farmer Africa ,000 Asia ,000 Europe 8, LAC 6, ,000 N America ,000 Oceania World Total
13 Who are the Consumers? Data (000 tons) Projection (000 tons) Share in global total % Change (Projection) Total 111, , , , % 100.0% 27.0% ECA 16,290 15,488 15,720 16, % 11.0% 8.1% NAM 8,151 7,966 9,223 10, % 7.0% 34.0% LAC 5,246 4,900 5,165 5, % 3.4% 6.1% EAP 3,866 2,975 3,068 2, % 1.9% -1.1% CHN 35,291 44,094 52,867 57, % 37.8% 30.1% JAP 7,485 8,180 7,926 7, % 4.9% -9.0% SEA 14,623 14,175 17,160 19, % 12.7% 36.3% SAR 4,940 5,063 7,140 9, % 6.1% 84.3% IND 5,887 6,909 8,688 10, % 6.6% 45.5% MNA 3,604 3,571 4,212 4, % 3.1% 32.5% AFR 5,947 5,980 6,758 7, % 5.1% 29.7% ROW % 0.1% 15.7%


14 86% of consumption in LDCs Fish is essential for > 1 billion people >50% of animal protein for 400 million in the poorest countries
15 Price Projections 100% 90% 80% 70% 60% 50% 40% 30% 20% 10% 0%


16 Space Constraining Sustainable Growth Capital Feed


17 Technical Efficiency Asia: 0.64; US/Europe: Vs 20,000 kg/ha/yr 12% Vs 1% breeding gain Energy???
18 Protecting Environments, Fish Health & Investments Ecological Issues Siting identify zones that are good for aquaculture; away or downstream of important ecosystem and biodiversity assets. Carrying Capacity measure how fast the ecosystem is moving towards the limit. Institutional Issues Setting Limits - set with the local community key criteria for impact assessment. Enforcement - establish regulatory framework, local authority and trade association that represents the interests of the aquaculture value chain.


19 Back from the Brink: Lessons from Chile
20 13 million Tons of Forage Fish 70,000,000 60,000,000 50,000,000 Aquaculture Fishmeal 40,000,000 30,000,000 20,000,000 10,000,000 0 FAO

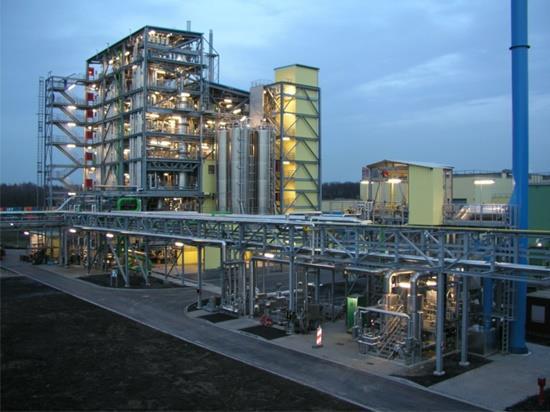
21 Price Driving Innovation


22 Plant Proteins 3% fishmeal + 40% SPC + 30% SBM 40% SPC + taurine 64% fishmeal


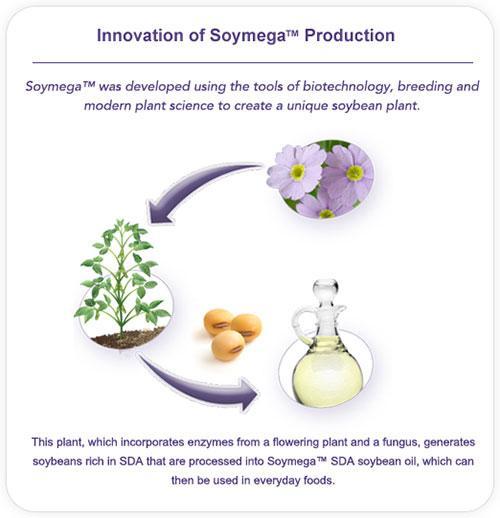
23 Fish Oil


24 Moving Off Shore Zones Easier to Implement Low Energy Systems No Land or Freshwater Established Hatchery & Culture Technology Turn Carnivores to Herbivores Keeping the small-scale players in the game?

25 Thank You!

 Lowered market appeal")
26 Symptoms of Unsustainability Massive disease outbreaks Declines in water quality Loss of biodiversity Loss of recreation, capture fisheries Reduced efficiency due to stress, inbreeding Increasing operation costs (medicines) Lowered market appeal INCREASED RISK
27 Defining Ecological Sustainability Sustainability is multidimensional incorporating physical resources, biodiversity AND people. Sustainability is context specific; priorities differ between the Maldives and Mississippi. Sustainability is an attribute of ecosystems, not individual farms.

 and disincentives (e.g.")
28 Practicalities: Clearly defined area Meaningful and visible indicators Ease and repeatability of measurements Incentives (e.g., collective certification) and disincentives (e.g., credible penalties) to manage free ridership

29 We measure this. We are concerned about this. Shouldn t we be measuring what we care about: biodiversity, clean water and beaches?

30 Lowering Risk Ecological Issues Siting identify zones that are good for aquaculture; away or downstream of important ecosystem and biodiversity assets. Carrying Capacity measure how fast the ecosystem is moving towards the limit. Institutional Issues Setting Limits - set with the local community key criteria for impact assessment. Enforcement - establish regulatory framework, local authority and trade association that represents the interests of the aquaculture value chain.


31 Mangroves (actually salt-flats) and Shrimp
 1990 s - R&R shrimp explosion 2000 government regulation of shrimp farming 2008 620,250 ha of shrimp farms")
32 Evolution of Mangrove Loss in Vietnam > 1 million ha of brackishwater forests 1899 most large trees already gone 1911 efforts to regulate deforestation begin ,000 ha of mangroves left War agent orange Post-War massive conversion to rice and urban infrastructure (salinization) 1990 s - R&R shrimp explosion 2000 government regulation of shrimp farming ,250 ha of shrimp farms in Vietnam Sources: GTZ, Soc Trang Provincial People s Committee (2010); UNEP 1998, De Silva (2012) Biodiversity Conservation
33
34 An aquaculture landscape?

35
36 and Tamil Nadu Source: Jayanthi et al

37 Getting the Facts Straight Myth: 198 kg of CO 2 eq per 100 g shrimp cocktail due largely to mangrove destruction Laugh Test: 3.3 billion tons of CO 2 = 6 X emissions of the world s motor vehicle fleet Reality: 3-12 kg CO 2 eq/kg*; <10% of shrimp farms converted mangroves; little direct conversion; almost none since * Compared to 3-32 for land animals Sources: Boyd & Clay (1998) Scientific American; Cao et al (2011) Environ. Sci. Tech. Sonesson et al. (2009) Swedish Institute for Food & Biotechnology, US EPA (2012).


38 Constraints to Sustainable & Equitable Growth Double supply in the next 2 decades Competition for land and water Need >$100 billion in new capital Must lower risk to attract investors

39