Evaluating Vegetation Evapotranspiration (VegET) Modeling Results in South Dakota
|
|
|
- Shannon Russell
- 5 years ago
- Views:
Transcription
 Center for Earth Resources Observation and Science (EROS); South Dakota State University (SDSU) Work performed under USGS contract 3CRCN1 senay@usgs.")
1 Evaluating Vegetation Evapotranspiration (VegET) Modeling Results in South Dakota Gabriel Senay 1 and Geoffrey Henebry 2 1 SAIC, contractor to the U.S. Geological Survey (USGS) Center for Earth Resources Observation and Science (EROS); South Dakota State University (SDSU) Work performed under USGS contract 3CRCN1 senay@usgs.gov 2 Geographic Information Science Center of Excellence (GIScCE), South Dakota State University Geoffrey.Henebry@sdstate.edu U.S. Department of the Interior U.S. Geological Survey
2 Outline Summary of results VegET modeling background and objective VegET model outputs VegET evaluation Soil Moisture (NRCS: SCAN) Crop Yield (NASS County) Flux Data (AmeriFlux) Vegetation Water content (AMSR-E VWC ) NDVI Conclusion
3 Summary VegET is a water balance model that produces landscape ET (water use) on a pixel-by-pixel basis on rainfed systems. Correlated well with AmeriFlux latent heat flux (ET) and SCAN soil moisture data. Promising results with crop yield data. Show interesting relationship with AMSR-E Vegetation Water Content. Operational setup of VegET is possible for crop and grassland monitoring.
4 VegET Modeling: Background and Objective VegET is a new modeling approach that integrates Land Surface Phenology (LSP) and commonly used water balance modeling algorithms to estimate actual vegetation ET (water use) in primarily non-irrigated crop and grassland environments for agro-hydrological applications. Key inputs to the model: 1) Daily rainfall data at 5-km resolution from NOAA/NWS (a new product since 25, a blend of NEXRAD and station data) 2) Daily reference ET calculated at EROS for global applications from the Global Data Assimilation (GDAS) climate parameters 1 km, downscaled to 1 km 3) Climatological remotely sensed NDVI time series to define optimum water- use patterns of landscapes throughout the year; 1-km resolution 4) Soil water holding capacity from STATSGO (in case of US) from 1:25, scale soils map Objective: Produce daily ETa and soil moisture to monitor crop and grassland performance for early assessment of yield and biomass production.


 Series1")
5 PRECIPITATION Reference ETo VegET ETa = Ks * Kp * ETo SOILS PPT i Soil Stress Coefficient Water Balance ETa i LSP Water-Use Coefficient.8 "Climatological" NDVI Pattern:Nebraska -97.8, Water Balance Model WHC Surplus Runoff SW i ETa = ETp ETa = Kp * ETo ETa < ETp ETa = Ks * Kp * ETo Drainage SW i = SW i-1 + PPT i ETa i RF i -DD i NDVI dekad ( 1-36) Series1 Series2 Series3 Series4 Series5 Series6 Land Surface Phenology (LSP)
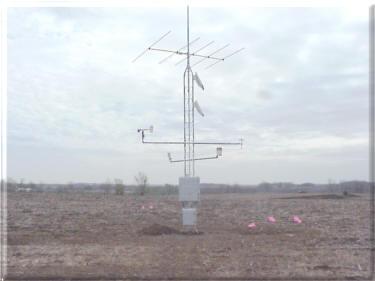
6 Evaluation Datasets Soil Moisture (vol/vol) Soil Climate Analysis Network (SCAN): Soil moisture (hourly, July 25, point), EROS, South Dakota Crop Yield (Bu/ac) National Agricultural Statistics Service (NASS): (yearly, 25, 26, county-average), South Dakota. Latent Heat Flux (ET) AmeriFlux (daily, 25, Point) Brookings, South Dakota; also Arizona Vegetation Water Content (kg/m 2 ) AMSR-E (daily, 25: 25 Km), Faulkton, South Dakota NDVI AVHRR: (weekly, 25,26; 1 km), Faulkton, SD
7 VegET Model Outputs Conterminous USA South Dakota
8 Illinois Flash Drought in 25?
9 26 drought in much of South Dakota, Nebraska, Southeastern US?
10 Yearly total shows more water use in the western US.

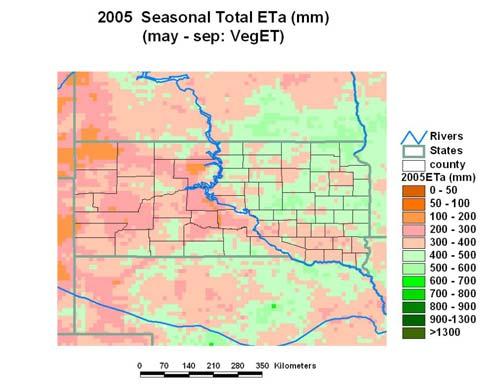
11 Seasonal and annual ETa show similar spatial patterns. Seasonal patterns show more differences in magnitude between the two years.
12 VegET: May Sep
13 VegET: May Sep Major ETa reduction
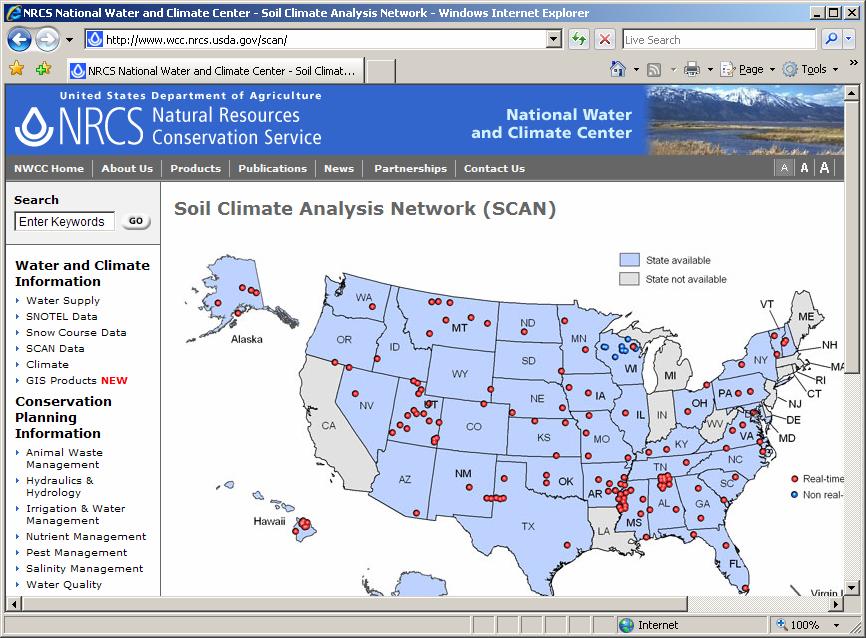

14 VegET Evaluation Soil Moisture: SCAN Data
15 Hourly Soil Moisture: EROS SCAN Hourly Average SM data SCAN EROS 34 SM (v/v) storm event Day Day 12 Hours hours on on July 11 and 1112, and July, 12, 25 25
16 9 VegET Soil Water vs SCAN soil moisture South Dakota Site, EROS SCAN Site 34 VegET SW (mm) VegET SW (mm) SCAN SM (V/V) Days in July, SCAN Soil Moisture (v/v) SCAN: Avg of 2, 4, 8, 2 and 4 inch depth data VegET soil water level change captures the temporal variations in soil moisture as measured by the SCAN Site. Note: VegET (5 km), SCAN (Point)
17 SCAN Soil Moisture (6 am) vs VegET Soil Water Estimate South Dakota/EROS Site (SCAN ID 272) (31 days in July 25) VegET Soil Water (mm) 9 y = x R 2 = SCAN Soil Moisture (vol/vol) Senay, 27

18 Evaluation: Crop Yield USDA: NASS Data
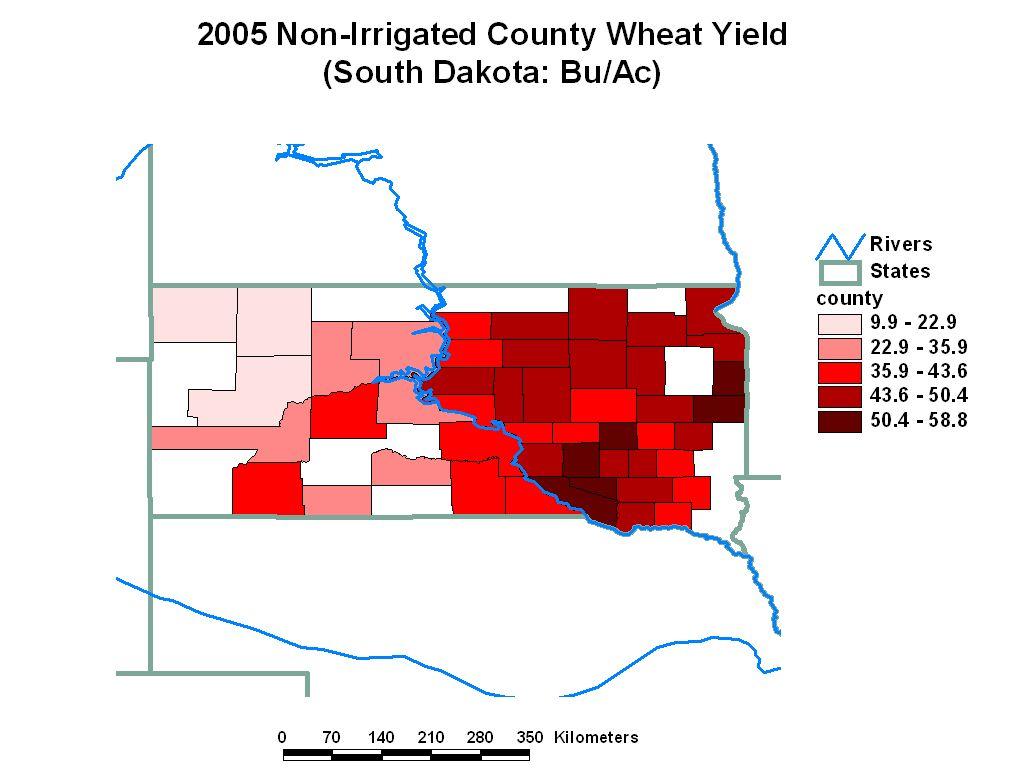
19 25 County Wheat Yield vs Seasonal Total ETa 48 counties in South Dakota County Wheat Yield vs ETa South Dakota: 25; n = 48 Wheat Yield (Bu/Ac) y =.945x R2 = VegET ETa (mm) (May Sep) Some counties had ETa more than 4 mm
20 26 County Wheat Yield vs ETa 46 counties in South Dakota Wheat Yield (Bu/ac) y =.235x R2 =.5 County Wheat Yield vs ETa South Dakota 26; n = VegET ETa (mm) (May Sep) Almost all counties showed ETa less than 4 mm ETa is better correlated with yield when water is a limiting factor.
21 25/26 County Wheat Yield vs ETa Counties in South Dakota Yield (Bu/ac) y =.1433x R2 =.5 County Wheat Yield vs ETa South Dakota: 25 & 26; n = VegET ETa (mm) (May Sep) ETa is reliable spatially and temporally
22 Comparing Yield and ETa Differences (between 25 and 26, county level) Yield Difference (Bu/Ac) [26-25] Wheat Yield Difference vs ETa difference: 26 minus 25 (South Dakota County Average, n = 36) ETa Difference (mm) [26-25] Most counties showed a large drop both in Yield and ETa from 25 to 26
23 Wheat Planted Area Distribution
24 25
25 26
26 Possible Sources of Error Spatial mismatch ETa = county-wide average Yield = sub-county aggregate, not all of the counties produces wheat Proposed Solution: use crop layers to redefine ETa average Temporal mismatch ETa = May Sep Yield = (all seasons total: winter wheat, spring wheat) Solution: analyze spring and winter wheat data separately Management differences in yield that is not reflected in ETa (water-base) Solution: develop temporal relationship using more years of historical data and work with yield anomalies.


27 Evaluation: Latent Heat Flux (ET) AmeriFlux Data
28 Latent heat flux (ET) from AmeriFlux tower and VegET ETa South Dakota, Brookings VegETa vs Flux LE: South Dakota 25 Cover: crop/grassland ETo/ETa (mm) Flux LE (ETa) GDAS ETo VegETa-5k Flux Rain Rainfalll (mm) Days (25) VegETa captured both the magnitude and temporal variations of measured flux at the tower site, including gross primary production (data not shown)
29 Latent heat flux (ET) from AmeriFlux tower and VegET ETa Arizona, 25 VegETa vs Flux LE: Arizona 25 cover: grassland 12 1 ETo/ETa (mm) Flux LE (ETa) GDAS ETo VegETa-5k Flux Rain Rainfalll (mm) Days (25) A stronger correspondence between VegETa and tower latent heat flux.
 =>passive microwave data")
 =>acquired twice daily: pre-dawn and early afternoon => 25-km")
30 Evaluation Vegetation Water Content (AMSR-E) The Advanced Microwave Scanning Radiometer - EOS (AMSR-E) =>passive microwave data (brightness temperature) converted into Vegetation Water Content (VWC) =>acquired twice daily: pre-dawn and early afternoon => 25-km resolution
 1-Sep 1-Oct 1-Nov 1-Dec 25 3 ddvwc = dvwc - avwc Large negative difference between dvwc and avwc seems to occur during optimum water supply")
31 VegET ETa vs AMSR-E VWC Faulkton, South Dakota, 25 AMSR-E VWC vs VegET ETa Faulkton, SD 25 8 ETa (mm), VWC (kg/m2) Rainfall ETa ddvwc dvwc avwc rainfall (mm) Jan 1-Feb 1-Mar 1-Apr 1-May 1-Jun 1-Jul 1-Aug Days (7-day Interval) 1-Sep 1-Oct 1-Nov 1-Dec 25 3 ddvwc = dvwc - avwc Large negative difference between dvwc and avwc seems to occur during optimum water supply and high ET
32 VegET ETa vs AMSR-E VWC, NDVI Faulkton, South Dakota, 25 VegET ETa vs AMSR-E VWC, NDVI Faulkton, SD 25 8 ETa (mm), NDVI (x1), ddvw (kg/m2) Jan 1-Feb Rainfall ETa NDVI ddvwc 1-Mar 1-Apr 1-May 1-Jun 1-Jul Low ETa 1-Aug 1-Sep 1-Oct Days (7-day interval based on weekly NDVI) 1-Nov 1-Dec rainfall (mm) ddvwc = dvwc - avwc -Both ETa and ddvwc show immediate stress to low rainfall -NDVI show similar stress at a lesser degree with a lag time
33 VegET ETa vs AMSR-E ddvwc Faulkton, South Dakota, July 25 Faulkton: VegET daily ETa vs ddvwc (kg/m2) 25, July (31 days) 7 ETa (mm), VegET y = x R 2 =.8465 Physical significance of this relationship needs to be investigated ddvwc (kg/m2)
34 Evaluation: NDVI ETa vs NDVI Faulkotn, SD (25 & 26) Faulkton, SD (25 & 26) ETa (mm) ETa25 ETa26 NDVI25 NDVI NDVI (-) 3-Jan 3-Feb 3-Mar 3-Apr 3-May 3-Jun 3-Jul 3-Aug Days (7-day interval) 3-Sep 3-Oct 3-Nov 3-Dec -Both ETa and NDVI show a reduction in 26 -The relative reduction of ETa is much higher and immediate than the reduction in NDVI.
35 Relative Reduction of ETa and NDVI w.r.t to Crop Yield NDVI (x 1) / ETa (mm) NDVI (avg) vs ETa (sum) Faulkton, SD (25 & 26) 78% of Year 95% of 25 ETa NDVI Faulk County: Wheat yield reduction from 25 to 26 = 61% ETa more sensitive to wheat (crop) yield reduction than NDVI
36 Conclusion VegET ETa showed encouraging performance with respect to: SCAN soil moisture AmerifFlux Latent Heat Flux from Brookings and Arizona Non-irrigated county wheat yield Interesting relationships between VegET and AMSR-E VWC was observed. The diel difference VWC (ddvwc) showed a strong negative relationship with ETa. Further research is required to understand the physical relationship between ddvwc and ETa VegET ETa was shown to be more sensitive than NDVI in detecting yield reduction from 25 to 26. Use of historical crop yield data will improve the yield prediction capability of VegET. VegET can be setup to provide daily estimates of sub-county soil moisture, ETa and crop yield performance and general plant biomass production. Caution should be taken in applying VegET on irrigated areas and forested landscapes that draw water from ground sources or transported surface water.