What is the role of gender in smallholder farming?
|
|
|
- Hollie Crawford
- 5 years ago
- Views:
Transcription
1 What is the role of gender in smallholder farming? Libor Stloukal FAO, Rome, Italy ICRISAT s 40 th Science Symposium Patancheru, September 2012
2 Key messages 1) Significant gender disparities continue to exist in smallholder farming. 2) Reducing those disparities would strengthen the smallholder sector and generate broader welfare benefits. 3) Gender transformative development is possible and needs to be supported.
3 Key dimensions of gender disparities in smallholder agriculture: HH decision-making, domestic work access to land and other resources credit and insurance markets labour markets support/protection systems institutions and organizations
4
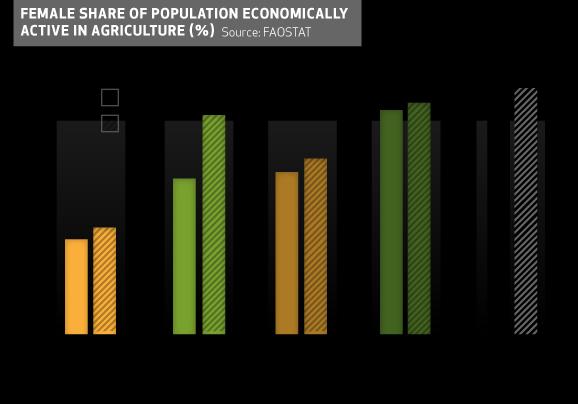
5 Female share of agricultural labor force (%) Female share of the agricultural labour force East and Southeast Asia Near East and North Africa Sub-Saharan Africa Latin America and the Caribbean South Asia Source. FAOSTAT.
6
7
8
9
10
11
12 Women as a share of individual holders of agricultural land 35.0% 30.0% Malaw i Chile 25.0% Thailand 20.0% 15.0% Zambia 10.0% 5.0% 0.0% Source: Eastern and Southern Africa Guatemala Bangladesh Senegal Mali Latin America Asia Western and Central Africa Lebanon Saudi-Arabia Near East and North Africa FAO Gender and Land Rights Database Regional differences are indicative given the few country data available.
13
14
15
16
17

18
19

20 Sources: World Development Indicators, World Bank, 2011 OECD 2012 Gender, Institutions and Development Database
21 Potential gains from closing the gender gap in agriculture Productivity gains 20 to 30 percent on women s farms 2.5 to 4 percent at national level Food security gains significant reduction in the number of hungry Broader economic and social gains better health, nutrition and education outcomes for children improved human capital, which promotes economic growth
22

23 Meet Valiben of Gujarat, India

24 Organizing (social capital)


25 Building natural assets (land, livestock)

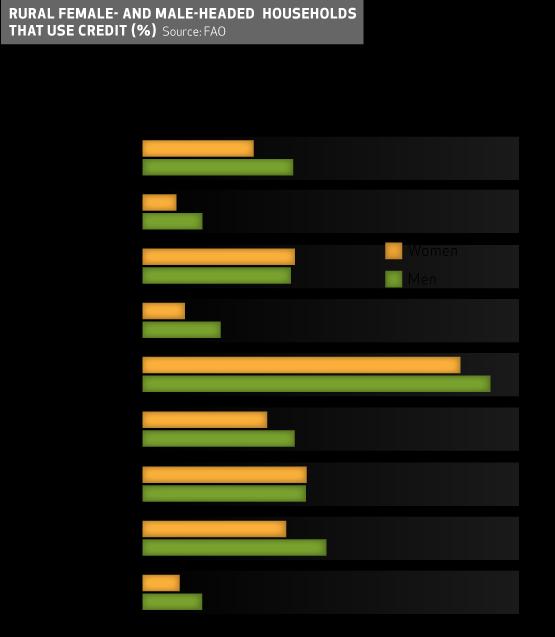
26 Accessing financial services (savings, credit and insurance)

27 Building physical assets and accessing technologies

28 Accessing information and services

29 Adding value and increasing employment

30 Accessing markets
31 Valiben s story shows that: The 5 capitals matter: natural physical financial human social Rural women are part of the solution Organizations enable small producers
32 What needs to be done? End gender discrimination under the law Free rural women for lucrative activities Build human capital of women and girls Strengthen rural organizations Improve analytical concepts, evidence Make gender-aware agric. policies Bundle interventions
33 Towards a social relations approach From: Towards: static dynamic formulaic nunaced Remember: gender is about social structure gender relations are dynamic and negotiable men and women have multiple identities people have not only individual interests gender relations are intrinsically ambiguous Avoid: cataloguing differences, seeking gap-filing solutions recycling orthodox generalizations about men and women
34 Thank you
35
36
37
38
39 % of total male and female population Males Females Males Females Males Females Males Females Males Females Males Females 90% 80% 70% 60% 50% 40% 30% 20% 10% 0% Female employment rates vary by region but are always lower than men s Developing countries Sub- Saharan Africa Latin America and the East and Southeast Asia Near East and North Africa South Asia Industry Services Source: ILO, Key Indicators of the Labour Market (KILM, 6th Edition). Note: The ILO, KILM data covers only a subset of the countries in each region. Definitions of adult labour force differ by country, but usually refers to the population aged 15 and above. Employed includes self-employed, employed, employers as well as contributing family members. There is no distinction between formal sector employment and informal sector employment.


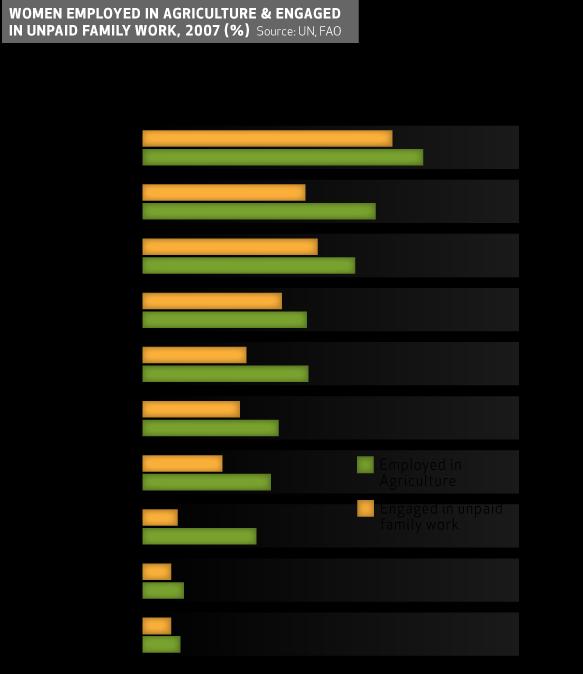
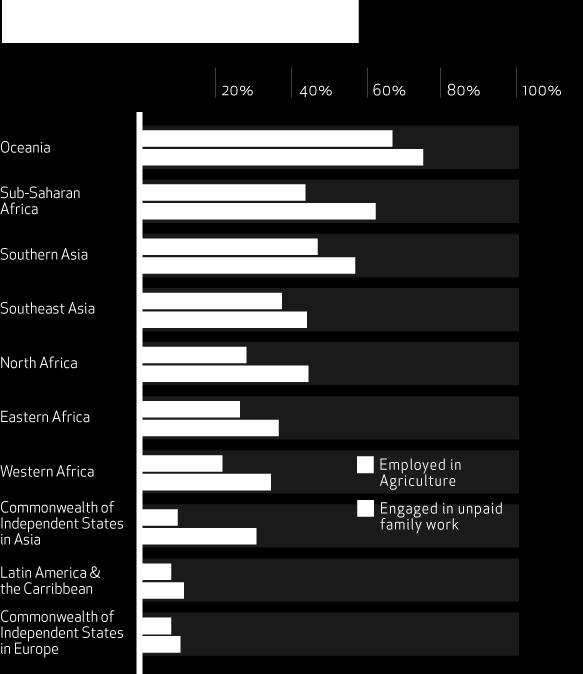
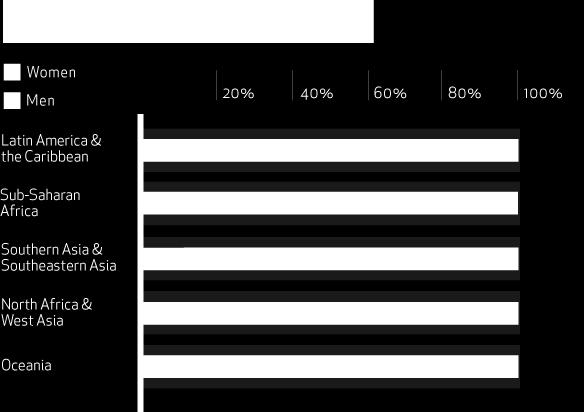
40 Women are more likely to be employed in agriculture than men Source: ILO, Key Indicators of the Labour Market (KILM, 6th Edition). Share of employed population by sector and gender Note: The ILO, KILM data covers only a subset of the countries in each region. Definitions of adult labour force differ by country, but usually refers to the population aged 15 and above. Employed includes self-employed, employed, employers as well as contributing family members. There is no distinction between formal sector employment and informal sector employment.
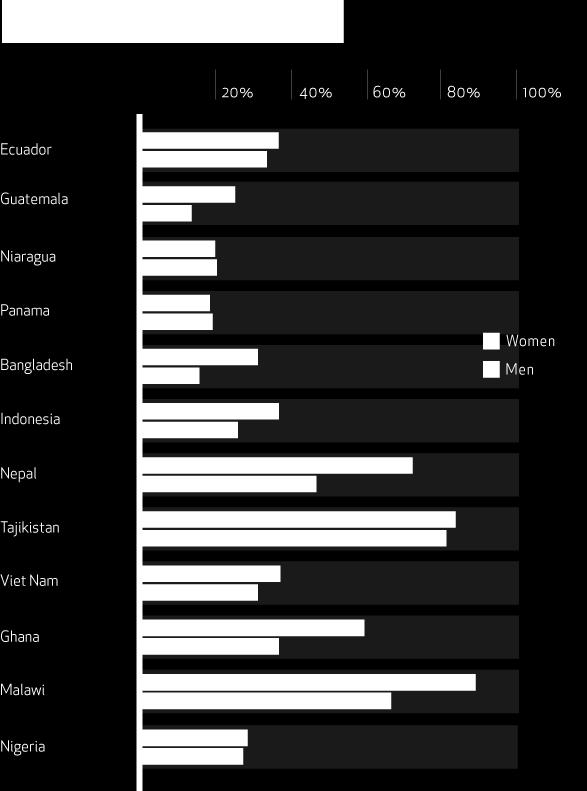
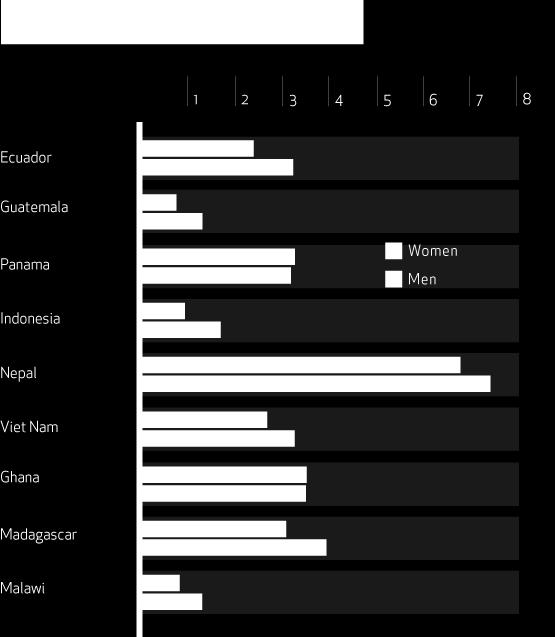
41 Women are less likely to participate in rural wage employment than men Panama Nicaragua Guatemala Ecuador Viet Nam Tajikistan Nepal Indonesia Bangladesh Nigeria Malawi Ghana Men Women Note: Refers to percentage of the adult population working for a wage. Source. FAO RIGA database
42 but are more likely to be in part-time work Panama Nicaragua Guatemala Ecuador Viet Nam Tajikistan Nepal Indonesia Bangladesh Nigeria Malawi Ghana Men Women Source: FAO RIGA database
43 or seasonal employment Panama Nicaragua Guatemala Ecuador Viet Nam Tajikistan Nepal Indonesia Bangladesh Malawi Men Women Source: FAO RIGA database
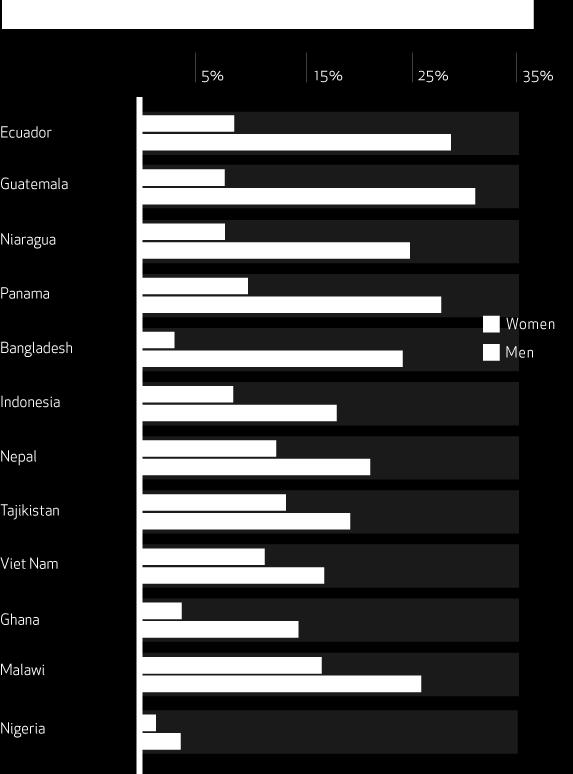
44 and more likely to hold low-wage jobs* Panama Nicaragua Guatemala Ecuador Viet Nam Tajikistan Nepal Indonesia Bangladesh Nigeria Malawi Ghana Men Women Source: FAO RIGA database *Low-wage jobs are defined as those that pay less than the median agricultural wage
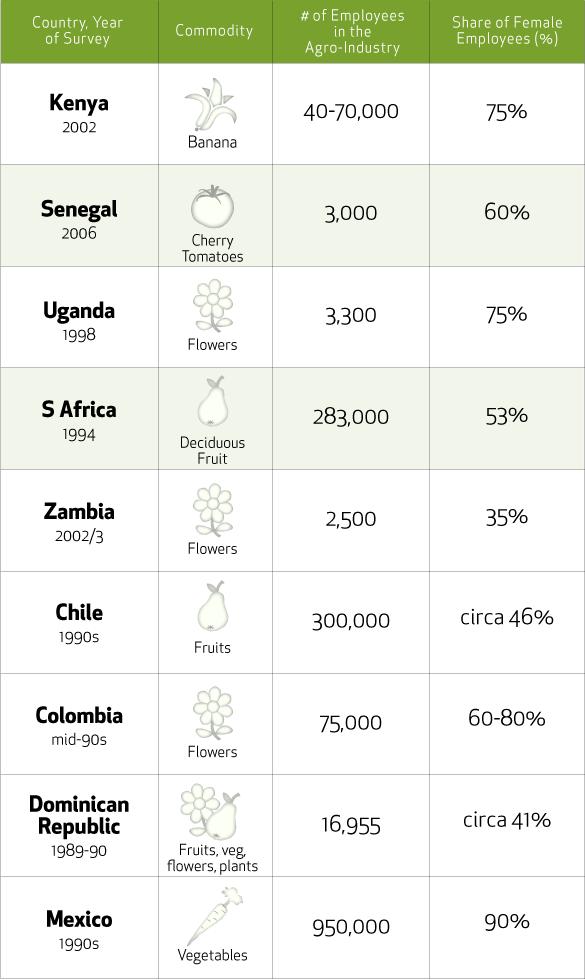
45 Women dominate employment in many of the high-value agro-industries Country Commodity Year of survey No. employees in ag-industry Cameroon Banana ,000 Côte d'lvoire Banana and pineapple ,000 Share of female workers Kenya Flowers ,000 70,000 75% Senegal French beans ,000 90% Cherry tomatoes ,000 60% Uganda Flowers ,300 75% Zambia Vegetables 2002/3 7,500 65% Flowers 2002/3 2,500 35% South Africa Deciduous fruit ,000 53% Mexico Vegetables 1990s 950,000 90% Colombia Flowers mid-90s 75, % Chile Fruits 1990s 300,000 ca 46% Dom. Republic Fruits, veg., flowers ,955 ca 41% Sources: Maertens and Swinnen (2009), Deere (2005)
46 Individual holders of agricultural land in selected countries, by gender Malawi Chile Thailand Mozambique Zambia Burkina Faso Guatemala Egypt Mali Bangladesh 0% 20% 40% 60% 80% 100% Female Male Source: FAO Gender and Land Rights Database
47 Women as a share of individual holders of agricultural land 35.0% 30.0% Malaw i Chile 25.0% Thailand 20.0% 15.0% Zambia 10.0% 5.0% 0.0% Source: Eastern and Southern Africa Guatemala Bangladesh Senegal Mali Latin America Asia Western and Central Africa Lebanon Saudi-Arabia Near East and North Africa FAO Gender and Land Rights Database Regional differences are indicative given the few country data available.
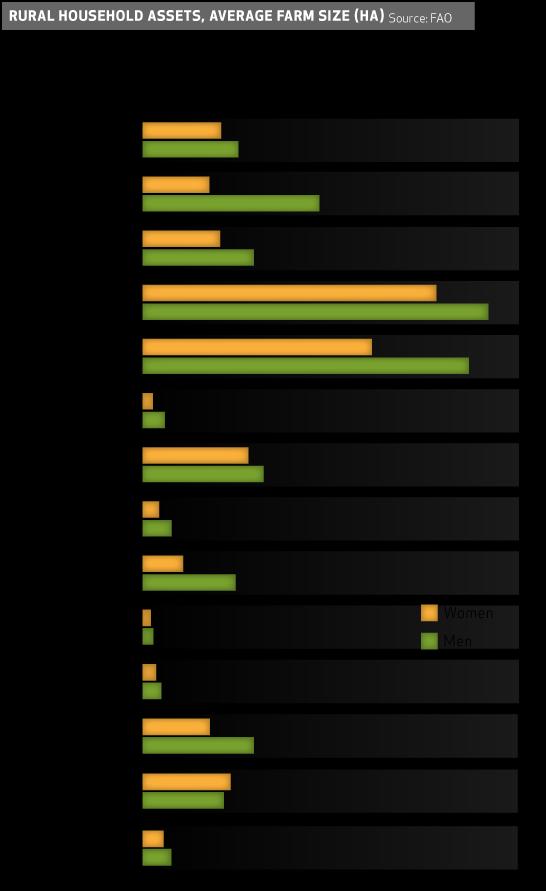
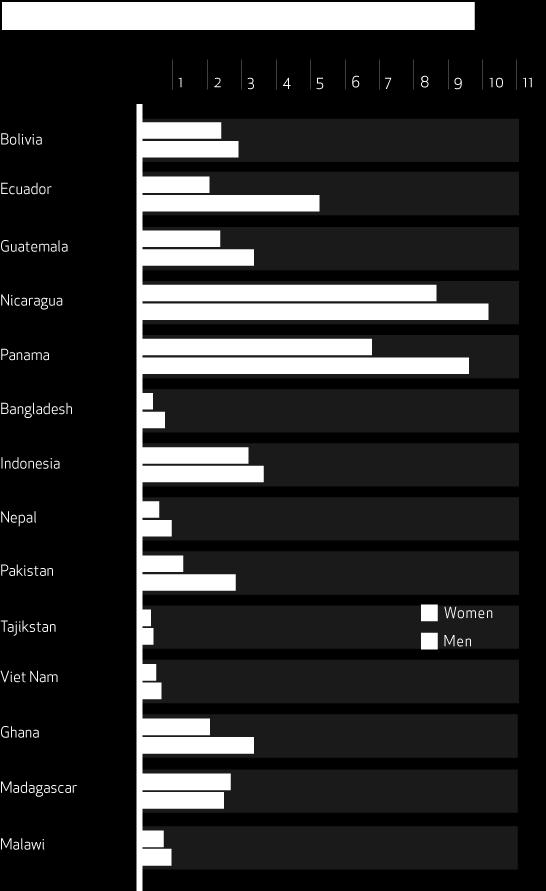
48 Women control less land Bolivia Guatemala Ecuador Nicaragua Panama Banglades Indonesia Nepal Pakistan Tajikistan Viet Nam Ghana Madagasc Malawi Average farm size (ha) Male-headed households Female-headed households
49 and produce less per unit of land... Percentage 0 Sorghum Vegetables All crops Gap between yields on male- and female-controlled plots in Burkina Faso
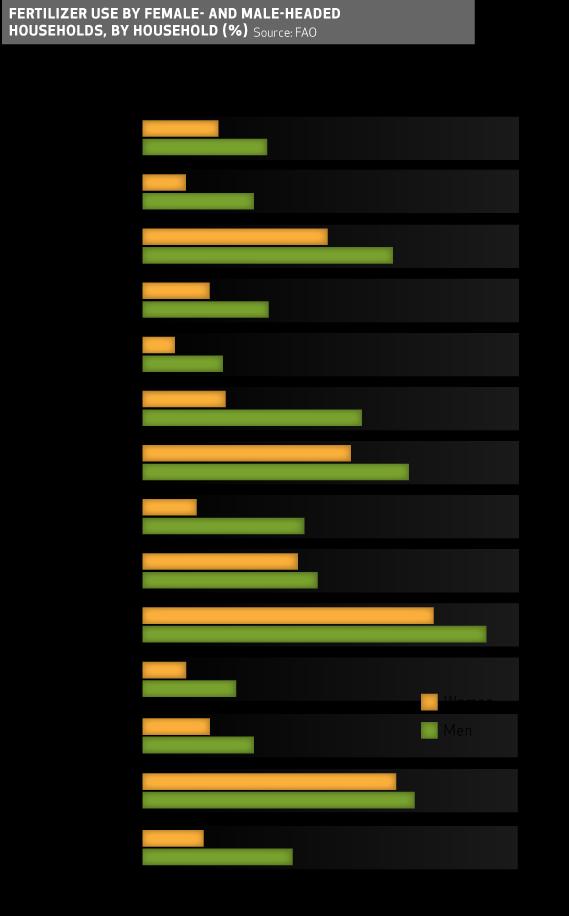
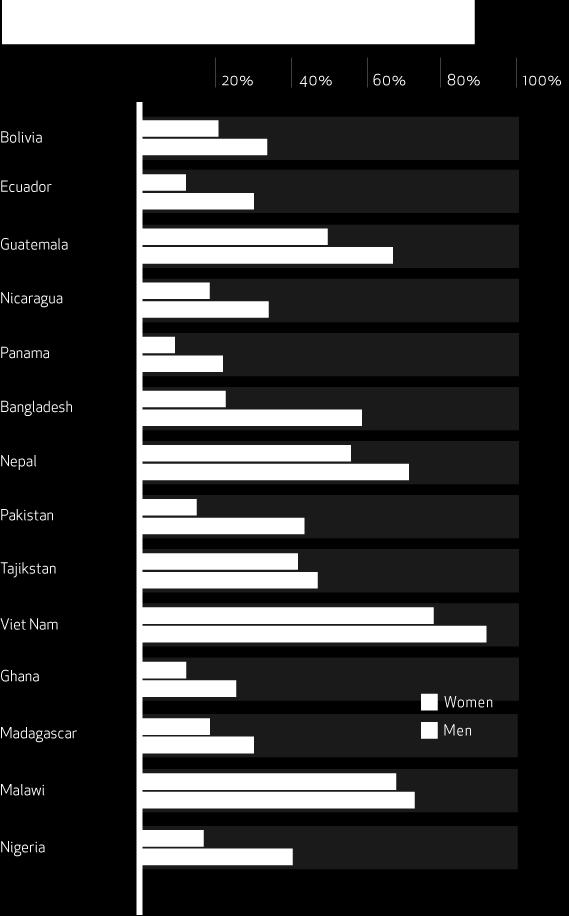
50 because they use fewer inputs (e.g. fertilizer) Bolivia Ecuador Guatemala Nicaragua Panama Bangladesh Nepal Pakistan Tajikistan Viet Nam Ghana Madagascar Malawi Nigeria Percentage of households using fertilizers Male-headed households Female-headed households

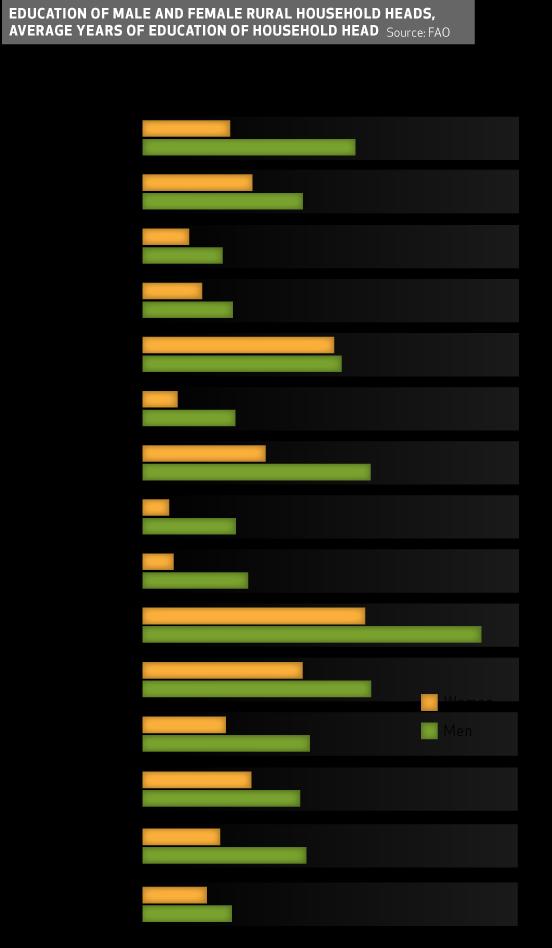
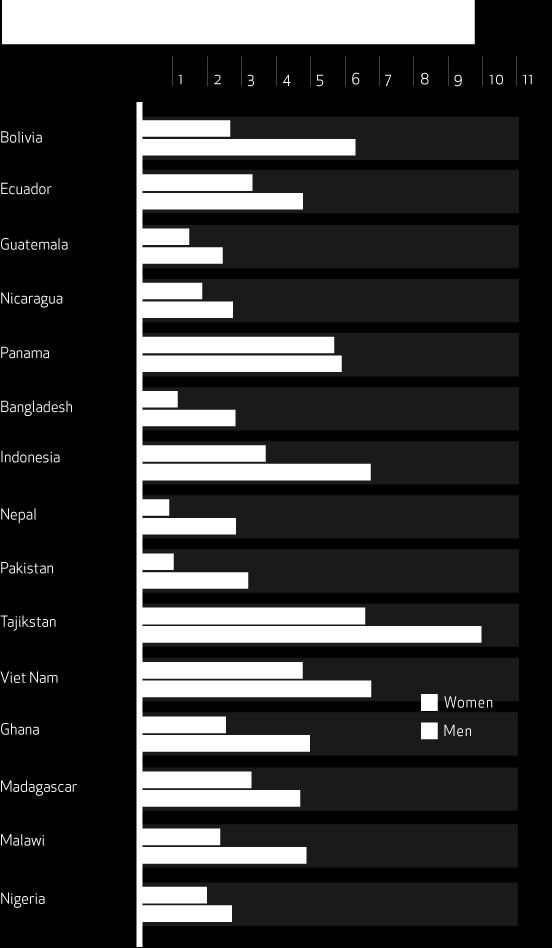
51 Female-headed households are hit harder by high food prices Bangladesh Ghana Guatemala Malawi Nicaragua Pakistan Vietnam Rural National Urban Note: The graph shows the differential change in welfare between FHH (female-headed households) and MHH (male-headed households).