Agricultural Drought Monitoring in India
|
|
|
- Jasper Wilkinson
- 5 years ago
- Views:
Transcription


1 Agricultural Drought Monitoring in India with special emphasis on NADAMS Government of India Ministry of Agriculture & Farmers Welfare Department of Agriculture, Cooperation & Farmers Welfare Mahalanobis National Crop Forecast Centre, New Delhi Shibendu S. Ray


2 MNCFC: An Introduction Established in 23 rd April, 2012 Attached office of Department of Agriculture, Cooperation & Farmers Welfare With Technical Support & Human Resources Support from ISRO Mandate: Use of Geospatial Technology for Agricultural Assessment Major Programmes: FASAL, NADAMS, CHAMAN, KISAN 2

3 Drought Occurrence Frequency
4 Central Agencies involved with Drought Monitoring/Management in India Ministry of Agriculture & Farmers Welfare Overall coordination, Inter-Ministerial Crop Weather Watch Group (CWWG), Leading IMCT for Drought Assessment India Meteorological Department Weather Forecasting, Rainfall Data MoWR,RD&GR (CWC, CGWB) Monitoring Reservoirs and Ground water situation Indian Space Research Organization Space based inputs ICAR- CRIDA Contingency planning DOLR/ MOWR/DAC&FW PMKSY-Watershed Development-Water Harv. Str. /Irrigation/Water Use efficiency Mahalanobis National Crop Forecast Centre Agricultural Drought Monitoring : NADAMS
5 Crop Weather Watch Group Partners Additional Secretary, DAC&FW & Central Drought Relief Commissioner Economics & Statistical Advisor, DAC&FW Agriculture Commissioner Animal Husbandry Commissioner India Meteorological Department Central Water Commission & Central Ground Water Board Ministry of Power Indian Council of Agricultural Research National Centre for Medium Range Weather Forecasting Mahalanobis National Crop Forecast Centre Indian Space Research Organisation Tasks Chairperson of the Group: overall coordination Report behavior of agro-climatic and market indicators Crop conditions: Availability of Inputs; Contingency Planning Livestock health; Fodder availability Rainfall forecast and monsoon conditions. Monitoring data on Important reservoirs / groundwater. Availability of power Technical input and contingency planning Provide medium-term forecasts Agricultural Drought Information Technical inputs on drought parameters
6 Parameters for Drought Declaration (Drought Manual, 2016) Levels Category Parameters Trigger 1 (Cause) Trigger 2 (Impact) Rainfall Based 1. RF Deviation or SPI 2. Dry Spell 1. Remote Sensing 2. Crop Situation 3. Soil Moisture 4. Hydrological 1. NDVI & NDWI Deviation or VCI 2. Area under sowing 3. PASM or MAI 4. RSI/GWDI/SFDI Verification Field Data GT in 5 sites, each, of 10% of Villages RF Rainfall SPI Standardized Precipitation Index NDVI Normalized Difference Vegetation Index NDWI Normalized Difference Wetness Index PASM Plant Available Soil Moisture MAI Moisture Adequacy Index RSI Reservoir Storage Index GWDI Ground Water Drought Index SFDI Stream Flow Drought Index GT Ground Truth
.")
7 National Agricultural Drought Assessment & Monitoring System (NADAMS) Operational Drought assessment during Kharif using Remote Sensing (Methodology developed by ISRO). Monthly/fortnightly District/Sub-District level drought assessment for 14 Agriculturally Dominant states of India (6 at Sub District level). Satellite based indices, Rainfall data, Soil moisture, Ground information on Sowing progression and Irrigation Statistics are used for drought assessment. Drought Warning (Normal, Watch & Alert) is given in June July & August, while Drought Assessment (Mild, Moderate & Severe) in September & October. Many states, proactively, use NADAMS assessments for support in Drought Declaration.
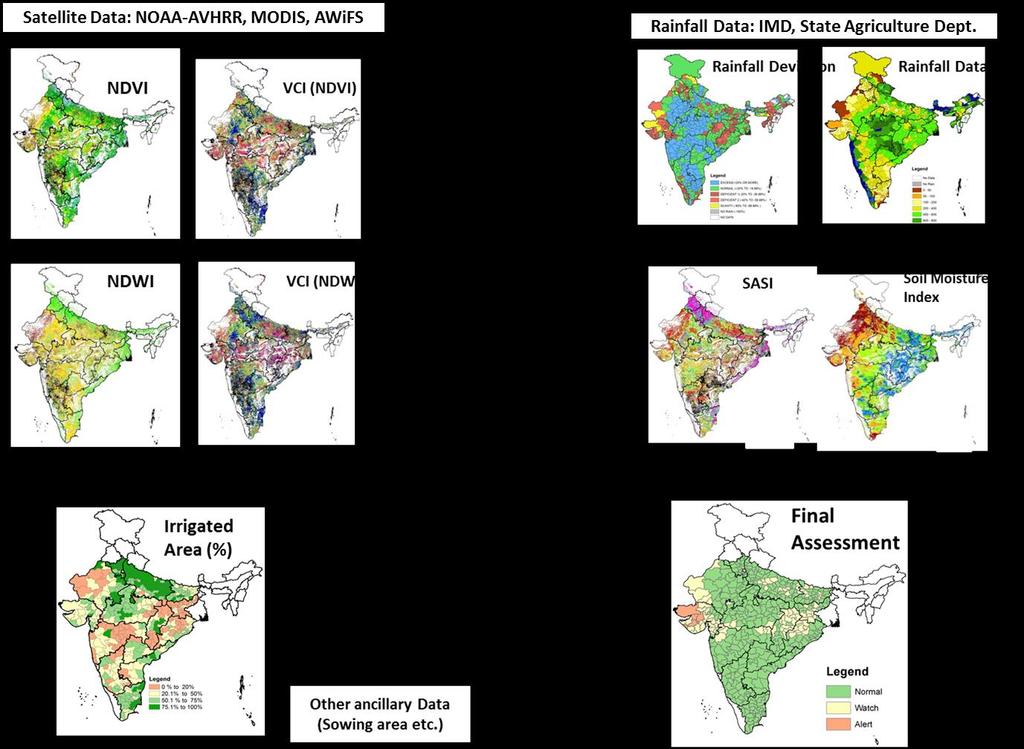
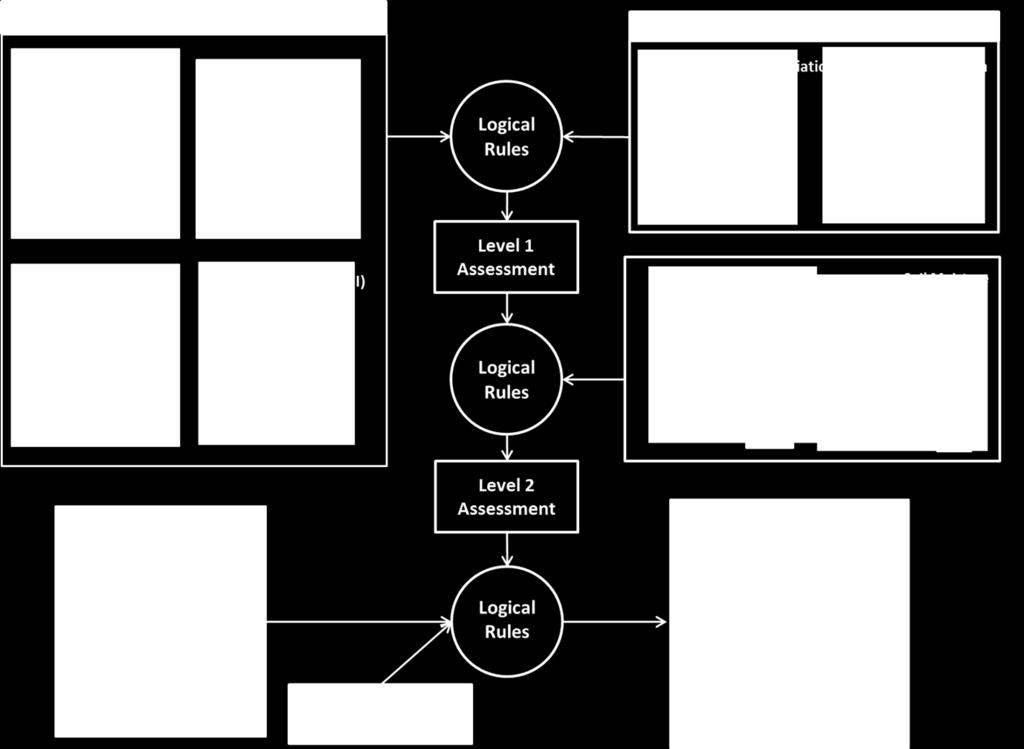
8 NADAMS: Multi-parameter Integrated Approach

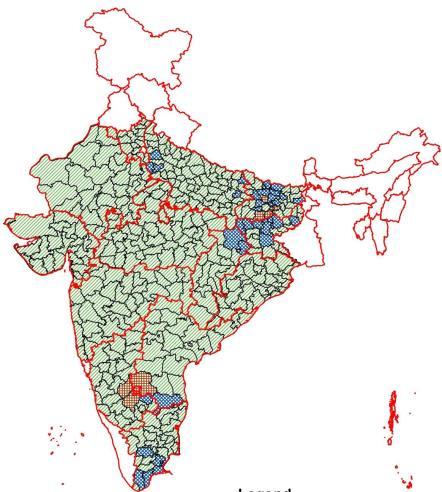
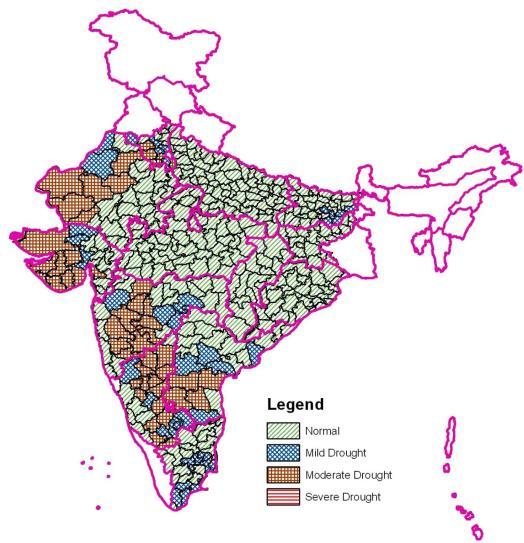
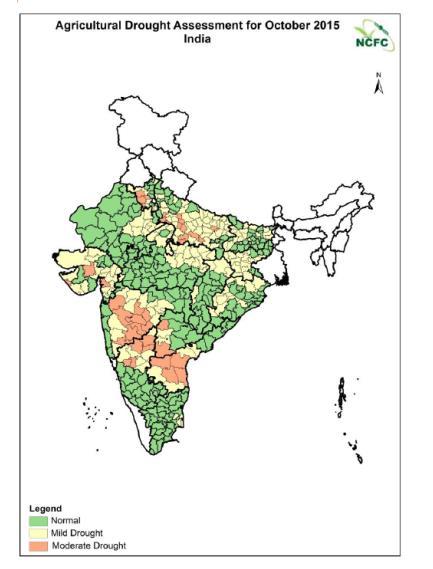
9 NADAMS: Drought Assessment,
10 100% Matching between State Declarations band NADAMS Assessments State Average Andhra Pradesh 77% 92% 85% 85% 85% Bihar 84% 50% 95% 61% 72% Chhattisgarh 100% 89% 100% 22% 78% Gujarat 77% 100% 65% 35% 69% Haryana 38% 100% 52% 43% 58% Jharkhand 100% 58% 96% 67% 80% Karnataka 83% 40% 80% 47% 63% Madhya Pradesh 100% 100% 94% 40% 84% Maharashtra 86% 97% 60% 74% 79% Odisha 100% 100% 100% 47% 87% Rajasthan 76% 12% 88% 30% 52% Tamilnadu 34% 84% 78% 91% 72% Telangana 80% 100% 90% 70% 85% Uttar Pradesh 100% 92% 72% 82% 86% Total 14 state 84% 79% 82% 58% 76% Matching % Matching % No. of Cases < 50 % 11 (19.6%) 50 % -60 % 4 (7%) 60 % -70 % 4 (7%) 70 %- 80 % 7 (12.5%) 80 % -90 % 11 (19.6%) 90 % -100 % 19 (33.9%) Total 56 Total 14 States, 4 years = 56 Cases 80% 60% 40% 20% 0% Average
 VHI = 0.")

11 Agricultural Condition Assessment in Rabi Season (upto 16 th Jan, 2017) Vegetation Condition Index Temperature Condition Index Vegetation Health Index (VHI) VHI = 0.5*VCI + 0.5*TCI Though the vegetation condition is very good in Northern temperature stress, thereby affecting overall vegetation health. and central states, there is
12 Future Needs Monitoring at dis-aggregated level (Block/GP) Early Warning of Droughts Composite Indicator: Integrated, Implementable, Acceptable Vulnerability Assessment towards drought mitigation Rabi season drought assessment Development of products (long-term, calibrated and real-time) for drought monitoring Assessment Climate Change Impacts vis-à-vis drought vulnerabily