Ag and Hort Update. Gordon Groover, Extension Economist Emeritus and Lex Bruce, Senior Research Associate
|
|
|
- Winfred Mitchell
- 5 years ago
- Views:
Transcription
1 Ag and Hort Update Gordon Groover, Extension Economist Emeritus and Lex Bruce, Senior Research Associate Department of Agricultural & Applied Economics Virginia Tech (540) (540) Website: July 11, 2018

2 TY2018: Counties/Cities* with usevalue assessment ordinances
3 Updates: Personnel Matt Holt, AAEC Department Lex and I are still working Maybe one more year? The search for our replacements will start soon? There is support for an orderly transition
4 Updates: Cap Rates Updated Cap Rate data averaging long-term interest (Federal Land Bank) Property tax rates (Department of Taxation) Now use a 7 years straight average Previous years used a 10 year straight average
5 Cap Rate Background First Q of 2007 Federal Reserve began stimulating the economy by reducing federal fund rates Not directly related to Federal Land Bank rates but help reduce rates (2007 to 2016) The interest rate competent of the cap rate is larger relative to the local tax value Thus interest rates drive the Cap Rate
6 Federal Land Bank Rates Long-term Interest % %
7 Federal Land Bank Rates Long-term Interest % 10 yrs 7 yrs %
8 Average Virginia Tax Rates by Year Rates Years
9 Tax and Cap Rates by Year Rates Cap Rate Average State Tax rate
10 Cap Rates Summary Changing from a 10-year ( ) to a 7-year ( ) cap rate averaging results in a lower cap rate, fewer higher years ( ) averaged. Decreases in capitalization rates increase use-value estimates. For example If a county s net returns remained at $50 for the new year capitalization rates decreased from 0.06% to 0.05%. Estimates would increase from $50/0.06 = $833 to $50/0.05 = $1,000
11 Updates: Model In TY2018 updated the non-irrigated land capability classes acreages data for land class I-VII Data obtained from the Web Soil Survey
12 Update: Census Deadline was February 5, 2018 Farmers are still completing forms (June) Selected farm visits by USDA (summer) Response rate at this time is lower than 2012 (June) Hope county level data is out by May 2019 Concerned about D nondisclosure in urbanizing counties
13 Questions from the Field Soils data, how is it used? Can local government set maximum values? Why are estimates still high, too high? Open space, if its not a golf/racquet club, then what is it, valuations based on? When can values be updated, during general reassessment, or annually? What about the Farm Bill, implications? Apples/Grapes estimates?
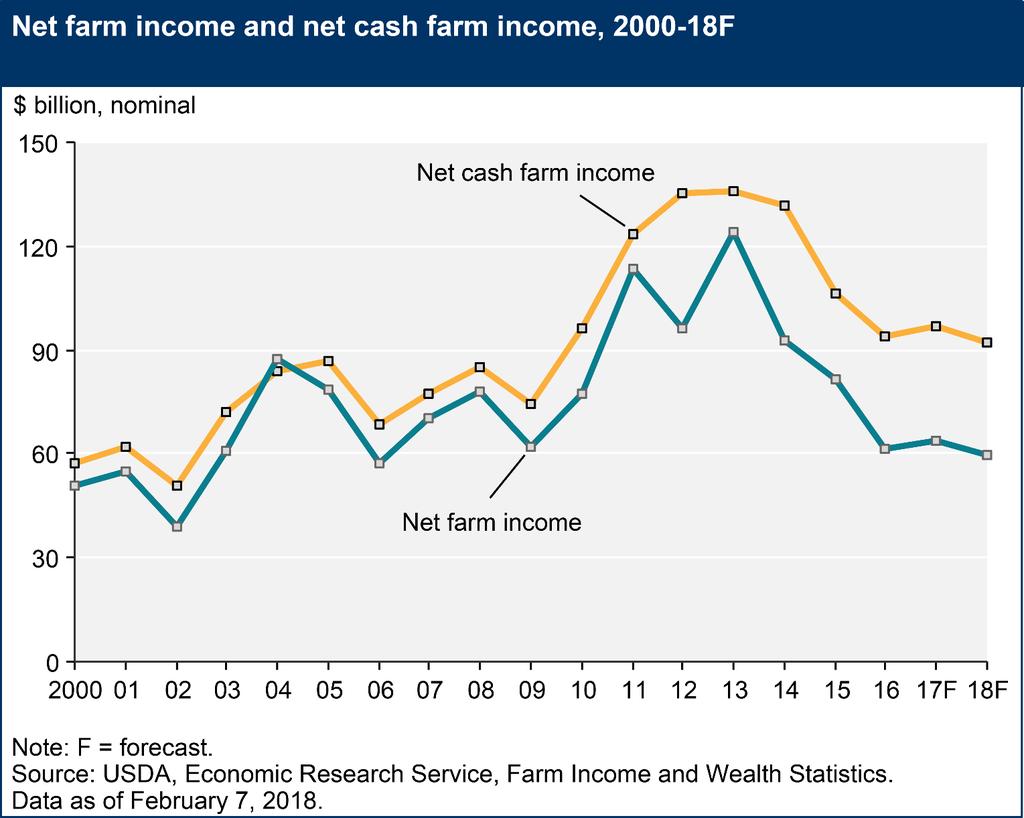
14 Profits?
15 Thanks! & Discussion & Questions? usevalue.agecon.vt.edu See site for presentations
16
17 Procedures for Estimating Agricultural and Horticultural Values in Use
18 Two Approaches 1. Net income Capitalized (Income Approach) Original model developed by Marshal (VT), Fraher, (TAX), Seward (VDACS), Poole (VT Grad Student) ~ Rental rates Capitalized (Rental Rate Approach) Implemented in 2010 by Groover and Bruce
19 Crop Budgets Income Approach Ag Census Composite Farm Capitalizatio n Rate Soil Index Use-value Estimates Federal Payments Income approach for each County Task: How to create an annual stream of net income that will be capitalized? How? Build on secondary/published data Use Net Returns = Income - Costs How? Define a representative farm (composite farm) based on current Ag Census for each county Create an enterprise budget for each crop to yield Net Returns (NR) Identify crop-based federal payments Define Capitalization Rate Apply soil index Final Estimates
20 Crop Budgets Income Approach Ag Census Composite Farm Capitalizatio n Rate Soil Index Federal Payments Baseline Data - Ag Census Conducted and published by National Agricultural Statistics Service (USDA/NASS) Published every 5 years Current Ag Census 2012 (released in 2014) Use the following for each county Number of farms reported Individual crops grown e.g., corn, wheat, pasture Acres reported for each crop grown Use-value Estimates
21 Crop Budgets Income Approach Ag Census Composite Farm Capitalizatio n Rate Soil Index Federal Payments Composite Farm Define - Composite Farm (CF) A.K.A. Average Farm For each reported crop: Divide acres by number of farms (Acres Farms) If the values is >0.50 ac, included in the CF If 0.50 ac, excluded from CF Statewide there are 16 crops that are included in at least one county reported farms => more land owners Five CF crops, e.g., corn+silage, hay+haylage, pasture, soybeans, and wheat. Use-value Estimates
22 Crop Budgets Income Approach Ag Census Composite Farm Capitalizatio n Rate Soil Index Federal Payments Composite Farm AgCensus Crop Reported Acres Alfalfa 0 Barley (D) Corn 4,637 Cotton 0 Hay 1,300 Pasture 699 Peanuts 0 Potatoes (D) Pumpkins (D) Snap Beans (D) Soybeans 5,843 Sweet Corn (D) Tobacco 0 Tomatoes (D) Watermelons 23 Wheat 3,183 Double-cropped (-) 3,183 Total Cropland Harvested 12,502 Based on 73 farms Composite Farm Acres Example for Corn = 4,637 ac / 73 farms = 64 acres of corn in the Composite Farm (CF) (-) Use-value Estimates
23 Crop Budgets Income Approach Ag Census Composite Farm Capitalizatio n Rate Soil Index Use-value Estimates Federal Payments Crop Budgets Created for all CF crops Based on VCE enterprise budget format Yields and Prices -> NASS Seeding and lime rates > VCE recommendation N,P, & K inputs are based on yielddriven nutrient removal rates (International Plant Nutrition Institute) AgFrist -> short-term interest
24 Crop Budgets Income Approach Ag Census Composite Farm Capitalizatio n Rate Soil Index Use-value Estimates Federal Payments Crop Budgets Pesticides -> Pest Management Guidelines (PMG) Application costs > custom rates Machinery usage and costs -> A. Society of Ag and Biological Engineers equations Fuel prices -> U.S. Dept of Energy Crop insurance -> USDA-RMA Labor hours function of machinery hours Labor rate -> NASS Note: Budgeted Net Returns lag 2 years, e.g., Tax Year 2018 reflects 2016 data
25 Income Approach Ag Census Composite Farm Example Budget Corn Grain no-till TY2018 Corn: Yield = bu/ac * Price = $3.75/bu = $ Net Crop Insurance = $44.74 Total Income = $ Crop Budgets Capitalizatio n Rate Soil Index Use-value Estimates Federal Payments Net Returns = Income - Costs NR = $598 - $535 = $63/ac Pre-Harvest Costs: N 144 Lb Price = $0.44/lbs = $63.28/ac Harvest Costs: Labor, fuel & oil, drying, hauling = $77/ac Fixed Costs: Machinery and Overhead = $83/ac Total Costs = $535/ac
26 Crop Budgets Income Approach Ag Census Composite Farm Federal Payments Olympic Averaging The Net Return for each CF crop requires 7 - years of crop budgets 7-year Olympic Averaging drops the highest and lowest values and then straight averages the remaining 5 values Corn Grain example Capitalizatio n Rate Soil Index Use-value Estimates Corn Crop Budget TY2012 $86.76 TY2013 $ TY2014 $ TY2015 $ TY2016 $18.91 TY2017 $ TY2018 $62.52 Olympic AVG $ Highest Lowest
27 Income Approach Federal Payments Crop Budgets Ag Census Composite Farm Capitalizatio n Rate Soil Index Use-value Estimates Federal Payments USDA-FSA provides data for program crops by county receives payments for corn, soybeans, and wheat. Annual payments = Payment/crop acreage For example in TY2018, received $23,646 in federal payments for corn. TY2017 $163,626.54/8,239 ac = $19.86/ac TY2018 $23,645.93/8,239 ac = $2.87/ac
28 Income Approach Olympic Averaging Crop Budgets Ag Census Composite Farm Capitalizatio n Rate Soil Index Use-value Estimates Federal Payments Corn Grain example Corn Federal Payment TY2012 $14.53 TY2013 $25.40 TY2014 $25.67 TY2015 $31.82 TY2016 $0.00 TY2017 $19.86 TY2018 $2.87 Olympic AVG $17.67 Highest Lowest Corn Budget $86.76 $ $ $ $18.91 $ $62.52 $ Corn Net Return for TY2018 Oly AVG Fed Pay + Oly AVG Budget $ $ = $ Highest Lowest
29 Income Approach Ag Census Composite Farm Crop Budgets and Federal Payments Tax Years OLY AVG Corn $62.52 $ $18.91 $ $ $ $86.76 $ Fed Pay $2.87 $19.86 $0.00 $31.82 $25.67 $25.40 $14.53 $17.67 Total $ Crop Budgets Federal Payments Hay -$ $ $ $ $ $ $46.16 $0.00 Pasture $22.89 $ $ $16.18 $76.64 $ $6.17 $18.80 Capitalizatio n Rate Soybean $79.08 $59.10 $ $ $ $ $ $ Fed Pay $31.73 $19.86 $0.00 $12.72 $16.47 $15.82 $9.39 $14.85 Total $ Soil Index Use-value Estimates Wheat $7.03 $42.94 $21.85 $75.90 $ $ $68.06 $74.27 Fed Pay $19.87 $19.86 $0.00 $19.39 $25.72 $25.57 $14.94 $19.93 Total $94.20 Final Net Return (Weighted AVG) $163.32
30 Income Approach Ag Census Composite Farm Final Net Returns County TY2018 Composite Farm weighted NR by crop acreage Crop Budgets Capitalizatio n Rate Federal Payments Crop Estimated Net Return Corn $ Hay $0.00 Pasture $18.80 CF acres Weight (e.g. corn 64/172=0.37) Final$ $ $ $1.05 Soil Index Use-value Estimates Soybeans $ $79.72 Wheat $ $23.98 Final Net Return (per acre) 172 $ Reflects double-cropped wheat (44 ac)
31 Crop Budgets Income Approach Ag Census Composite Farm Capitalizatio n Rate Soil Index Federal Payments Capitalization Rate Why use Capitalization Rate? Cap Rate = Net Return Value Farmland Farmland Value = NR Cap Rate $100 per year 10% = $1,000 Cap Rate = Interest Rate + Property Tax Federal Land Bank long term interest rate - AgFirst (10 year average) Effective Tax Rates for all counties - VA Department of Taxation (10 year average) Use-value Estimates
32 Crop Budgets Income Approach Ag Census Composite Farm Federal Payments TY2018 Cap Rate Components Interest Rate statewide (10yr Avg) Property Tax (10yr Avg) Total without risk Crop loss due to Flooding 5% Total With risk Capitalizatio n Rate Soil Index Use-value Estimates Use Value TY2018 Use Value = Use Value without risk = Use Value without risk = Net Returns Cap Rate $ $2, Use Value with risk $
33 Income Approach Ag Census Composite Farm Adjustments for Soil Capabilities USDA Land Classes for Ag use Land Capability Classes Productivity Index Class I - Excellent cropland 1.50 Crop Budgets Federal Payments Class II - Good cropland 1.35 Class III - Average cropland 1.00 Capitalizatio n Rate Soil Index Use-value Estimates Class IV - Below average cropland strip cropping only, hay 0.80 Class V Good Pasture, hay 0.60 Class VI Pasture 0.50 Class VII Very limiting - Pasture only 0.30 Class VIII Not suitable to agriculture steep or wet 0.10
34 Crop Budgets Income Approach Ag Census Composite Farm Capitalizatio n Rate Soil Index Federal Payments Indexing for Soil Productivity Land Class Reported Acreage Productivity Index Weighted Acreage 1 3, , , , , , Total 20,154 25,953 Use-value Estimates Soil Index Factor 25,953 20,154 = 1.288
35 Crop Budgets Income Approach Ag Census Composite Farm Capitalizatio n Rate Soil Index Use-value Estimates Federal Payments Adjusting to Class III land Why? Data reflects average soil productivity for each county Values are adjusted to reflect Class III productivity Use Value TY2018 Use Value = Use Value Soil index Without risk = $2, Without Risk Class III = $2, With risk $2, With Risk Class III = $1,939.72
36 Final Estimates Cropland TY2018 Weighted Cropland AVG Pastureland Weighted Pasture land AVG Weighted Ag. Land AVG I II III IV I-IV V VI VII V-VII I-VII VIII w/out Risk 3,060 2,750 2,040 1,630 2,690 1,220 1, , w/ Risk 2,910 2,620 1,940 1,550 2,560 1, , Note: Final estimated values are rounded to the nearest $10 The Class III w/out risk estimate of $2, is reported as $2,040
37 Rental Rate Approach TY2018 Starting 2009 NASS published rental rate data annually* for Cropland Irrigated cropland Pasture land County rental rates for TY2018 (NASS) Cropland = $1,020 Eastern District (Combined County) Pastureland = not published *Sometimes biennially based on NASS funding
38 Rental Rate Use Value Rental Rate TY2018 Cap Rate = Value Cropland $ = $1,020 Pasture Not Published 1 Eastern District Cropland combined county Rental Rate Estimates are published annually not averaged over time
39 Income Approach and Rental Rate Approach: Compared Income Approach (w/out risk) Rental Rate Approach TY2018 Cropland (I-IV AVG) $2,690 Cropland $1,020 Pastureland (V-VII AVG) $710 Pastureland ---
40 Thanks! & Discussion & Questions? usevalue.agecon.vt.edu