Supplementary Fig. 1 Identification of Nedd4 as an IRS-2-associated protein in camp-treated FRTL-5 cells.
|
|
|
- Lewis Wilkinson
- 5 years ago
- Views:
Transcription
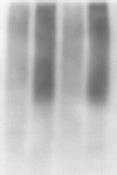
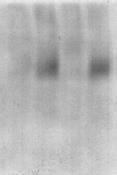
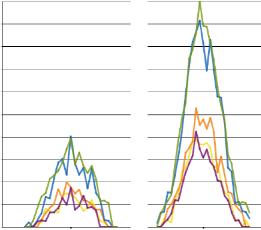
 FRTL-5 cells were treated with 1 mm dibutyryl camp for 24 h, and the lysates were subjected to immunoprecipitation with anti-irs-2 antibody.")
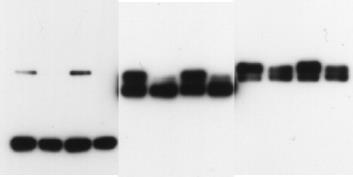
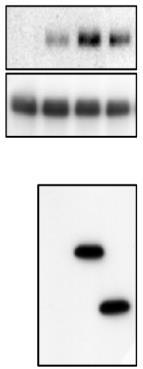
1 Supplementary Fig. 1 Supplementary Fig. 1 Identification of Nedd4 as an IRS-2-associated protein in camp-treated FRTL-5 cells. (a) FRTL-5 cells were treated with 1 mm dibutyryl camp for 24 h, and the lysates were subjected to immunoprecipitation with anti-irs-2 antibody. As a negative control, the antigen peptide was mixed with anti-irs-2 antibody prior to immunoprecipitation. Immunoprecipitates were subjected to SDS-PAGE and silver stain. Representative data is shown, and arrowheads indicate bands of IRS-2-associated proteins. (b) p120 was subjected to "in gel" digestion with trypsin, and the peptides were analyzed with MALDI-TOF MS. Peptides attributed to E3 ubiquitin ligase Nedd4 are shown (#matched peaks/#subjected peaks, 8/24; sequence cover 12%). (c) Lysates of camp-treated FRTL-5 cells were subjected to immunoprecipitation and immunoblotting using the indicated antibodies. Non-specific IgG was used as a negative control. (d) HEK293 cells overexpressing indicated proteins were serum starved. Cell lysates were subjected to immunoprecipitation and immunoblotting.
2 Supplementary Fig. 2 Supplementary Fig. 2 The association of Nedd4 with IRS-2 (related to Fig. 1) (a) The association of the Nedd4 N-terminal region and the IRS-2 PH/PTB domain in cell-free binding assay. HEK293T cells overexpressing IRS-2 deletion mutants were serum-starved, and the lysates were subjected to pull-down analysis using GST-Nedd (b) Putative intramolecular binding sites in the Nedd4 C2 domain and HECT domain. Blue, basic residues; red, acidic residues. (c) Determination of the intramolecular binding sites in Nedd4 C2 domain and HECT domain. HEK293T cells overexpressing indicated proteins were serum-starved. Cell lysates were subjected to immunoprecipitation and immunoblotting. Nedd (C854S), a mutant of the ubiquitin ligase active site, was used because intact Nedd was unstable.
3 Supplementary Fig. 3
4 Supplementary Fig. 3 Ubiquitination of IRS-2 by Nedd4 (related to Fig. 2) (a) Effects of Nedd4 overexpression on IGF-IR, IRS-1 and IRS-2 ubiquitination. HEK293T expressing indicated proteins were serum-starved, followed by IGF-I stimulation (100 ng/ml, 1 min). Cell lysates were denatured, followed by immunoprecipitation and immunoblotting using the indicated antibody. (b) IRS-2 peptides with ubiquitin remnant detected by LC-MS/MS analysis. IRS-2 immunoprecipitates derived from HEK293T cells expressing Nedd4 and IRS-2 were treated with indicated proteases, and the resulted peptides with ubiquitin remnant motif (K- -GG) were enriched using anti-ubiquitin remnant motif antibody-conjugated beads. The sample was subjected to LC-MS/MS analysis. Peptides attributed to IRS-2 are shown. Lower case letters k in peptide sequences indicate ubiquitinated Lys residues. (c) Representative MS/MS spectrum of the peptide DFLSHHLK 1331 [GG]. (d, e) Quantitative MS analysis results. IRS-2 immunoprecipitates derived from HEK293T cells expressing IRS-2 (-Nedd4) or IRS-2 and Nedd4 (+Nedd4) were treated with trypsin and Asp-N. Peptides with ubiquitin remnant motif were enriched, and subjected to LC-MS/MS analysis. Chromatograms of several product ions (different colors) derived from DFLSHHLK 1331 [GG] are shown in (d). Fragment ions used for PRM are shown in (e). The area under the curves (AUCs) were summed and shown in Fig. 2i.
5 Supplementary Fig. 4
6 Supplementary Fig. 4 Regulation of IGF-I signaling by Nedd4 (related to Fig. 3) (a, b) Effects of Nedd4 overexpression on IGF-I-dependent IGF-IR and IRS-1 tyrosine phosphorylation. HEK293 cells overexpressing Nedd4 or Nedd4 C854S together with IGF-IR-FLAG (a) or FLAG-IRS-1 (b) were serum-starved, followed by IGF-I stimulation (100 ng/ml, 1 min). Lysates were subjected to immunoprecipitation and immunoblotting as indicated. In (b), densitometric analyses were performed, and tyrosine phosphorylation levels of IGF-IR and IRS-1 were normalized to their protein levels in immunoprecipitates. p85 PI3K bound to IRS-1 was normalized to IRS-1 levels in immunoprecipitates. The graph shows means SD of three independent experiments., significant difference from control (P<0.05, one-way ANOVA followed by Tukey-Kramer test). (c) Effects of Nedd4 overexpression on cell surface IGF-IR levels. HEK293 cells overexpressing Nedd4 or Nedd4 C854S together with IGF-IR-FLAG were serum-starved, followed by IGF-I stimulation (100 ng/ml, 1 min). Cell surface proteins were biotinylated, followed by immunoprecipitation and blotting with indicated antibodies or streptavidin-hrp. Densitometric analyses were performed, and biotinylated IGF-IR to IGF-IR levels in immunoprecipitates. The graph shows means SD of four independent experiments. (d) Effects of Nedd4 overexpression on Grb10 levels. HEK293 cells overexpressing IRS-2 alone, or IRS-2 and Nedd4 were serum-starved. Grb10 levels were measured by immunoblotting. The graph shows show means SD of three independent experiments. (e) Effects of the deletion of Nedd4 N-terminal region on IRS-2 tyrosine phosphorylation. HEK293 cells overexpressing IRS-2 and myc-nedd4 (wild type or aa ) were serum-starved, followed by IGF-I stimulation (100 ng/ml, 1 min). Cell lysates were subjected to immunoprecipitation and immunoblotting using the indicated antibodies.
 (a) Effects of the IRS-2-ubiquitin chimeric protein and its mutant, (b) Nedd4 overexpression, and (c) the deletion")

7 Supplementary Fig. 5 Supplementary Fig. 5 Association of IRS-2 with ubiquitin binding proteins (related to Fig. 4) (a) Effects of the IRS-2-ubiquitin chimeric protein and its mutant, (b) Nedd4 overexpression, and (c) the deletion of Epsin1 UIM motifs on the association of IRS-2 with the indicated ubiquitin binding proteins. HEK293T cells overexpressing indicated proteins were serum-starved. Lysates were subjected to immunoprecipitation and immunoblotting as indicated.
8 Supplementary Fig. 6 Supplementary Fig. 6 Regulation of IGF-I signaling by Nedd4 in thyrocytes (related to Fig. 5) (a, b) The association of Nedd4 with IRS-2 or IGF-IR. FRTL-5 cells were treated with 1 mm dibutyryl camp for 24 h (a, b), and then treated with 100 ng/ml IGF-I for 1 min (a). Cell lysates were subjected to immunoprecipitation and immunoblotting as indicated. In (b), the antigen peptide was mixed with anti-irs-2 antibody prior to immunoprecipitation as a negative control. (c) Effects of Nedd4 knockdown on Grb10 levels. Cells transfected with Nedd4 sirnas were treated with dibutyryl camp. Grb10 levels were measured by immunoblotting. (d) Effects of Nedd4-2 knockdown on IGF-I-induced IRS-2 tyrosine phosphorylation. Cells transfected with Nedd4-2 sirnas were treated with dibutyryl camp followed by IGF-I stimulation as described above. Cell lysates were subjected to immunoprecipitation and immunoblotting.

 (a) Sequence information of the 5 -UTR Irs2 -Venus capped RNA used for the validation of zebrafish Irs2 MO.")
9 Supplementary Fig. 7 Supplementary Fig. 7 Lack of Nedd4-2 expression in PC-3 cells (related to Fig. 6) FRTL-5 cells and PC-3 cells were transfected with Nedd4-2 sirnas or control RNAs. Cell lysates were subjected to immunoblotting using the indicated antibodies. Supplementary Fig. 8 Supplementary Fig. 8 Confirmation of Irs2 knockdown and Nedd4 expression in zebrafish embryo (related to Fig. 7) (a) Sequence information of the 5 -UTR Irs2 -Venus capped RNA used for the validation of zebrafish Irs2 MO. The RNA contains a sequence of zebrafish Irs2 mrna 5 -UTR (black letter) and translation start site (25 base, red letter), fused with Venus fluorescent protein-cording sequence (green letter). Irs2 MO target sequence is shown as blue shaded. (b) Efficient knockdown of Irs-2 by Irs2 MO. 5 -UTR Irs2 -Venus mrna or Venus mrna was co-injected with either Irs2 MO or control MO into 1-2 cell stage embryos. Bright field images and Venus fluorescence at 22 hpf are shown. bars, 1.0 mm. (c) Successful Nedd4 expression. Nedd4-Venus mrna or Venus mrna was co-injected with either Irs2 MO or control MO into 1-2 cell stage embryos. Cell lysate was prepared from 12 hpf embryos, and subjected to immunoblotting.


10 Supplementary Fig. 9 Supplementary Fig. 9 Fig. 1b IB: myc Fig. 1c, IB: myc Fig. 1d, IB: myc IRS-2 Nedd4! HECT short exposure IRS-2 IB: myc long exposure IRS-2 Nedd4 Nedd4! HECT Nedd4 HECT Fig. 2b, re-hybridization after the immunoblotting using IRS-2 antibody Fig. 2c Fig. 2d IB: FLAG IB: HA Fig. 2e IB: Ub IB: FLAG IB: myc Fig. 2g Supplementary Fig. 9 Uncropped scans of blots shown in Fig. 1b, 1c, 1d, 2b, 2c, 2d, 2e and 2g. Supplementary Fig. 9 Rectangles Uncropped delimit scans cropped of areas blots used shown in the in indicated Fig. 1b, panels. 1c, 1d, 2b, 2c, 2d, 2e and 2g. Rectangles delimit cropped areas used in the indicated panels.

11 Supplementary Fig. 10 Supplementary Fig. 10 Fig. 3a IB: IGF-IR² IB: p85 PI3K IP: IGF-IR² IB: IGF-IR² IP: IGF-IR² Fig. 3c IB: p85 PI3K IB: p85 PI3K Fig. 3d Fig. 3e IB: p85 PI3K Supplementary Fig. 10 Supplementary Uncropped scans Fig. 10 of Uncropped blots shown scans of in blots Fig. shown 3a, 3c, in Fig. 3d and 3a, 3c, 3e. 3d and 3e. Rectangles delimit cropped areas used in the indicated panels. Rectangles delimit cropped areas used in the indicated panels.


12 Supplementary Fig. 11 Supplementary Fig. 11 Fig. 4a IB: FLAG IB: Epsin1 Fig. 4b IB: FLAG IB: myc IB: Epsin1 IB: myc Fig. 4c IP: IGF-IR² IB: IGF-IR² IP: IGF-IR² Fig. 4d IB:pTyr IB: Epsin1 IB: Eps15 IB: IGF-IR² IB: HSP90 Supplementary Supplementary Fig. 11 Uncropped Fig. 11 Uncropped scans of scans blots of shown blots shown in Fig. in Fig. 4a, 4a, 4b, 4b, 4c 4c and 4d. Rectangles delimit cropped areas used in the indicated panels. Rectangles delimit cropped areas used in the indicated panels.


13 Supplementary Fig. 12 Supplementary Fig. 12 Fig. 5a Fig. 5b -2 Fig. 5c -2 Fig. 5d IB: IGF-IR² Fig. 5e IB: IGF-IR² IP: IGF-IR² IB: ² actin IB: HSP90 IB: PI3K Supplementary Fig. 12 Uncropped scans of blots shown in Fig. 5a, 5b, 5c, 5d and 5e. Supplementary Fig. 12 Rectangles Uncropped delimit scans cropped of areas blots used shown in the indicated in Fig. panels. 5a, 5b, 5c, 5d and 5e. Rectangles delimit cropped areas used in the indicated panels.


14 Supplementary Fig. 13 Supplementary Fig. 13 Fig. 6a DU145 cells PC-3 cells Fig. 6b IB: IGF-IR² IB: HSP90 IP: IGF-IR² IB: PI3K Fig. 6c Fig. 6d IB: HSP90 IB: Epsin1 IB: HSP70 Supplementary Fig. 13 Uncropped scans of blots shown in Fig. 6a, 6b, 6c and 6d. Supplementary Fig. 13 Uncropped Rectangles delimit scans cropped of blots areas shown used in in the Fig. indicated 6a, 6b, panels. 6c and 6d. Rectangles delimit cropped areas used in the indicated panels.