RNA-Seq Analysis. Simon Andrews, Laura v
|
|
|
- Spencer Chandler
- 5 years ago
- Views:
Transcription
1 RNA-Seq Analysis Simon Andrews, Laura v
2 RNA-Seq Libraries rrna depleted mrna Fragment u u u u NNNN Random prime + RT 2 nd strand synthesis (+ U) A A T A u u u u A u u u u A T T A-tailing Adapter Ligation (U strand degradation) Sequencing
3 Reference based RNA-Seq Analysis QC Trimming Mapping Statistical Analysis Quantitation Mapped QC
4 Sequence Data Processing
5 Raw Sequence Quality Control
6 FastQC

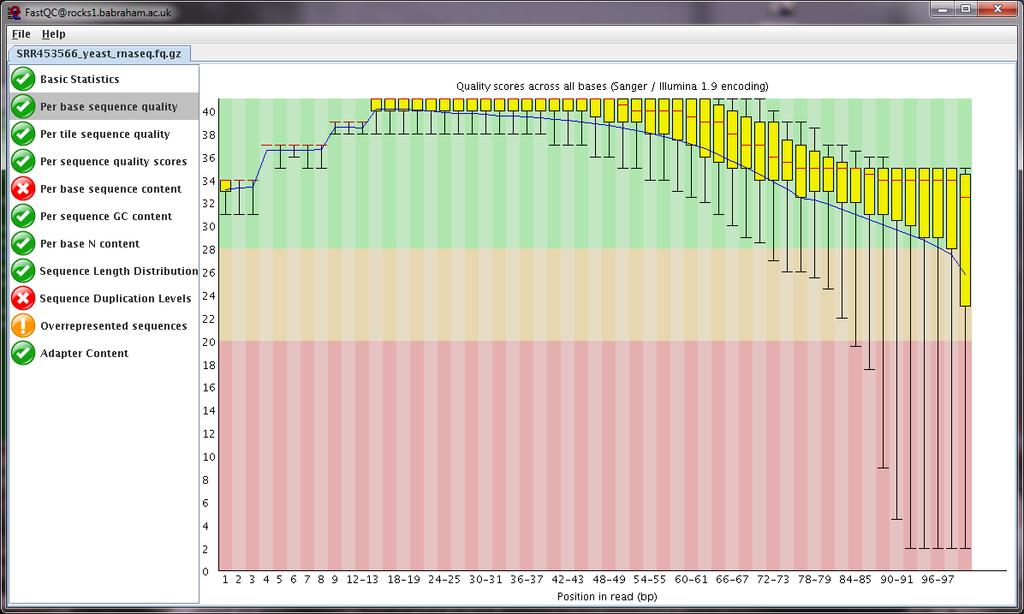
7 Sequence call quality QC: Raw Data

8 Sequence bias QC: Raw Data

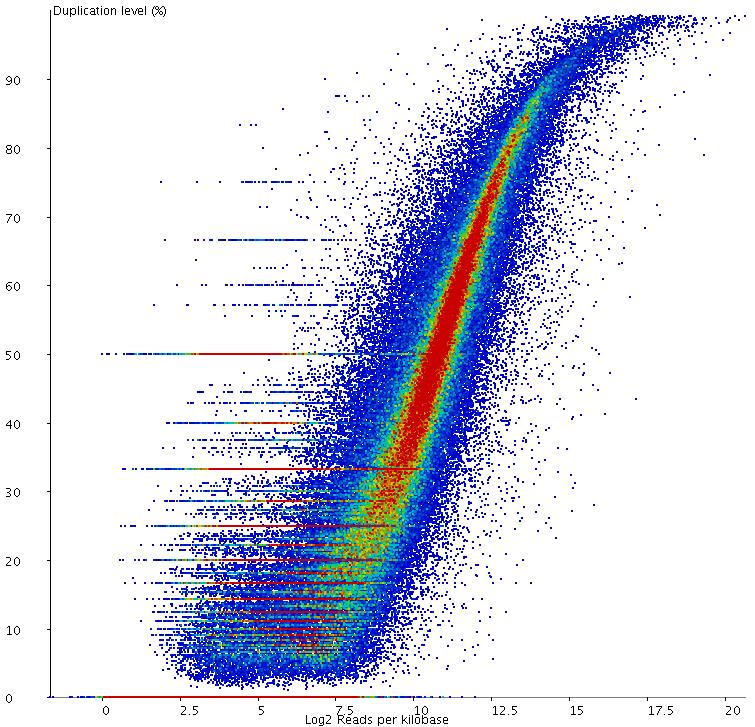
9 Duplication level QC: Raw Data
10 Adapters and Trimming
11 Library Structure Primer Read 1 Adapter Insert Adapter Primer Read 1 Adapter Insert Adapter

12 Trimming Adapters

13 Trimming Quality
14 Trimming Adapters Primer Read 1 Adapter Insert Adapter
15 Mapping to a reference
16 Mapping Exon 1 Exon 2 Exon 3 Genome Simple mapping within exons Mapping between exons Spliced mapping
17 RNA-Seq Mapping Software HiSat2 ( Star ( Tophat (
18 HiSat2 pipeline Reference FastA files Indexed Genome Reference GTF Models Reads (fastq) Yes Maps with known junctions Report Pool of known splice junctions Add Maps convincingly with novel junction? Yes Report No Discard
19 Mapped Data QC
20 Mapping Statistics Time loading forward index: 00:01:10 Time loading reference: 00:00:05 Multiseed full-index search: 00:20: reads; of these: (100.00%) were paired; of these: (6.00%) aligned concordantly 0 times (87.55%) aligned concordantly exactly 1 time (6.45%) aligned concordantly >1 times 94.00% overall alignment rate Time searching: 00:20:52 Overall time: 00:22:02

21 Mapping Statistics
22 Data Visualisation and Exploration

23 Viewing Mapped Data Reads over exons Reads over introns Reads in intergenic Strand specificity
24 SeqMonk RNA-Seq QC (good)
25 SeqMonk RNA-Seq QC (bad)
26 SeqMonk RNA-Seq QC (bad)

27 Look at poor QC samples
28 Duplication (again) Exon Exon
29 Duplication (good)
30 Duplication (bad)
31 Fixing Duplication? If duplication is biased (some genes more than others) Can t be fixed can still analyse but be cautious If it s unbiased (everything is duplicated) Doesn t affect quantitation Will affect statistics Can estimate global level and correct raw counts
32 Quantitation Exon 1 Exon 2 Exon 3 Exon 1 Exon 3 Splice form 1 Splice form 2 Definitely splice form 1 Definitely splice form 2 Ambiguous
33 Simple Quantitation - Forget splicing Count read overlaps with exons of each gene Consider library directionality Simple Gene level quantitation Many programs Seqmonk (graphical) Feature Counts (subread) BEDTools HTSeq
34 Analysing Splicing Estimate transcript level expression Cufflinks, RSEM, bitseq etc. Analyse junction usage directly Counts + DESeq/EdgeR Compare splicing decision ratios rmats, logistic regression
35 RPKM / FPKM / TPM RPKM (Reads per kilobase of transcript per million reads of library) Corrects for total library coverage Corrects for gene length Comparable between different genes within the same dataset FPKM (Fragments per kilobase of transcript per million fragments of library) Only relevant for paired end libraries Pairs are not independent observation Effectively halves raw counts TPM (transcripts per million) Normalises to transcript copies instead of reads Corrects for cases where the average transcript length differs between samples
36 Visualising Expression and Normalisation Linear Log2 CD74 Eef1a1 Actb Eef2 Lars2
37 Visualising Normalisation
38 Visualising Normalisation
39 Size Factor Normalisation RPKM/FPKM/TPM all use total number of reads as the fixed value between samples This can be a terrible measure, as it might not be a good representation for sampling depth Might need a more robust reference point
40 Size Factor Normalisation Make an average sample from the mean of expression for each gene across all samples For each sample calculate the distribution of differences between the data in that sample and the equivalent in the average sample Use the median of the difference distribution to normalise the data
41 Normalisation Coverage Outliers
42 Normalisation DNA Contamination
43 Exploratory Analyses Do *lots* of plotting Clustering of samples (PCA / tsne etc) Do my groups separate as expected? Pairwise comparisons of groups Are expected effects present? Can I see obvious changes? Can I validate other aspects of the same (eg sex)
44 Differential Expression
45 Differential Expression Mapped data Normalised expression (+ confidence) Raw counts Continuous stats Binomial stats
46 DE-Seq binomial Stats Are the counts we see for gene X in condition 1 consistent with those for gene X in condition 2? Size factors Estimator of library sampling depth More stable measure than total coverage Based on median ratio between conditions Variance required for NB distribution Insufficient observations to allow direct measure Custom variance distribution fitted to real data Smooth distribution assumed to allow fitting
47 Dispersion shrinkage Plot observed per gene dispersion Calculate average dispersion for genes with similar observation Individual dispersions regressed towards the mean. Weighted by Distance from mean Number of observations Points more than 2SD above the mean are not regressed
48 Visualising Differential Expression Results 5x5 Replicates 5,000 out of 22,000 genes (23%) identified as DE using DESeq (p<0.05) Need further filtering!
49 Magnitude of effect filtering Intensity difference test Fold change biases to low expression Need a test which Has a statistical basis Doesn t bias by expression level Returns sensible numbers of hits
50 Assumptions Noise is related to observation level Similar to DESeq Differences between conditions are either A direct response to stimulus Noise, either technical or biological Find genes whose differences aren t explained by general disruption
51 Method
52 Results
53 Result Validation (can I believe the hits?)

54 Validation C17Rik RIKEN cdna C17 gene Hbb-b1 hemoglobin, beta adult major chain Rps27a-ps2 ribosomal protein S27A, pseudogene 2 C230073G13Rik RIKEN cdna C230073G13 gene mt-atp8 mitochondrially encoded ATP synthase 8 mt-nd4l mitochondrially encoded NADH dehydrogenase AC erythroid differentiation regulator 1 Gm5641 predicted gene 5641
55 Experimental Design for RNA-Seq
56 Practical Experiment Design What type of library? What type of sequencing? How many reads? How many replicates?
57 What type of library? Directional libraries if possible Easier to spot contamination No mixed signals from antisense transcription May be difficult for low input samples mrna vs total vs depletion etc. Down to experimental questions Remember LINC RNA may not have polya tail Active transcription vs standing mrna pool
58 What type of sequencing Depends on your interest Expression quantitation of known genes 50bp single end is fine Expression plus splice junction usage 100bp (or longer if possible) single end Novel transcript discovery 100bp paired end
59 How many reads Typically aim for 20 million reads for human / mouse sized genome More reads: De-novo discovery Low expressed transcripts More replicates more useful than more reads
60 Replicates Compared to arrays, RNA-Seq is a very clean technical measure of expression Generally don t run technical replicates Must run biological replicates For clean systems (eg cell lines) 3x3 or 4x4 is common Higher numbers required as the system gets more variable Always plan for at least one sample to fail Randomise across sample groups
61 Power Analysis Power Analysis is not simple for RNA-Seq data Not a single test one test per gene Need to apply multiple testing correction Each gene will have different power Power correlates with observation level Variations in variance per gene Several tools exist to automate power analysis All require parameters which are difficult to estimate, and have dramatic effects on the outcome

62 Power Analysis
 Proper (BioConductor) All require an estimate of count vs")
63 Tools available Scotty - RnaSeqSampleSize (BioConductor) Proper (BioConductor) All require an estimate of count vs variance Pilot data (if only!) Similar studies
64 Exercises Look at raw QC Mapping with HiSat2 Small test data Quantitation and visualisation Use SeqMonk graphical program Larger replicated data Differential expression DESeq2 Intensity Difference Review in SeqMonk Larger Data Multiple conditions Many samples Explore Quantitate Analyse Cluster
65 Useful links FastQC HiSat2 SeqMonk Cufflinks DESeq2 Bioconductor DupRadar