Inferring Cellular Networks Using Probabilis6c Graphical Models. Jianlin Cheng, PhD University of Missouri 2010
|
|
|
- Ann Daniels
- 5 years ago
- Views:
Transcription
1 Inferring Cellular Networks Using Probabilis6c Graphical Models Jianlin Cheng, PhD University of Missouri 2010
2 Bayesian Network

3 Demo
4 References E. Segal, M. Shpira, A. Regev, D. Peer, D. Botstein, D. Koller, and N. Friedman. Module networks: iden6fying regulatory modules and their condi6on specific regulators from gene expression data. Nature GeneRcs N. Friedman. Inferring cellular networks using probabilis6c graphical models. Science
5 Research in molecular biology is undergoing a revoluron mrna transcript quanrres protein protein protein DNA interacrons chromarn structure Protein quanrres Protein localizaron Protein modificaron
6 Challenge Provide methodologies for transforming highthroughput heterogeneous data sets into biological insights about the underlying mechanisms Data is noisy Data integraron Generate Hypothesis
7 Biological Networks Gene Regulatory Networks
8
9 Signal TransducRon Network

10 Protein InteracRon Network
11 Model Based Approaches VS Procedure Approaches Procedure: Binding sites Gene expression. (a) cluster co expressed genes to find common sites (b) group genes with similar binding sites and test if they are coexpressed Declara6ve: design a model that describes the relarons between the two types of data. Learn parameter from data and make predicrons
12 ProbabilisRc Models StochasRcity for measurement noise Learning Algorithms Select model that fits the actual observarons Inference Make predicrons Generate insights and hypothesis
13 Modeling Examples Hidden Markov Model for sequence analysis ProbabilisRc Graphical Model for cellular networks
14 Advantages Concise language for describing probability distriburons over the observarons Approaches to learning from data that are derived from basic well understood principles Use of observarons to fill in model details Provide principles for combining mulrple local models into a joint global model DeclaraRve nature provides an advantage to extend model to account for addironal aspects of the system

15 Infer Gene Regulatory Network from Gene Expression Data
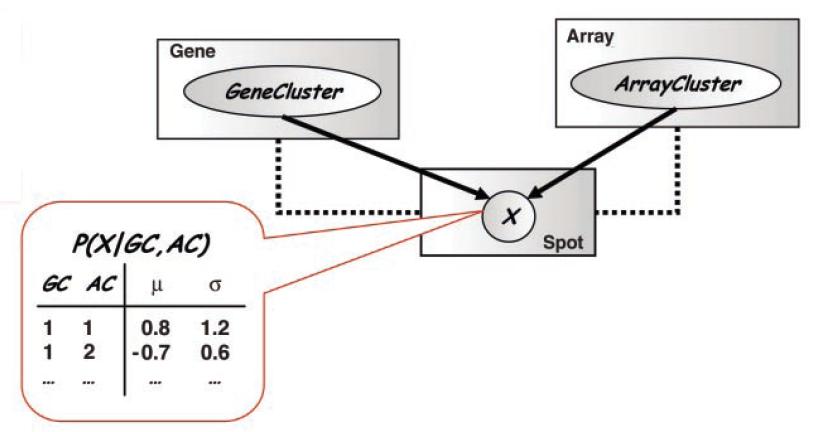
16 Model for gene expression and cisregulatory elements Assump6ons 1: genes can be parrroned into clusters of coexpressed genes, and the genes in each cluster have a typical expression level in each array. Assump6on 2: arrays are parrroned into array clusters, which capture relevant biological context, and that the expression of a gene is roughly the same in the arrays that belong to the same array cluster
17 Random Variables X g,a, where g is an index over gene and a is an index over arrays GeneCluster g : denotes the cluster assignment of gene g ArrayCluster a denotes the cluster assignment of array a. AssumpRon: the expression of gene g in array a depends on the value of GeneClusterg and ArrayClustera

18 Regular Bayesian Networks
19 CondiRonal DistribuRon
20 Learning Models from Data Parameter esrmaron maximum likelihood problem ( P(data model)) Model selecron: select among different model structures to find one that best reflects the dependencies in the domain. P(model data)
21 The model just described can achieve high likelihood if the cluster and gene assignment parrrons the original measurements into blocks with approximately uniform expression within each block
22 ExpectaRon MaximizaRon procedure that iterates between an E step, which uses current parameters to find the probabilisrc cluster assignment of genes and arrays, and an M step, which re esrmates the distriburon within each gene/array cluster combinaron on the basis of this assignment.
23 ReconstrucRon of Regulatory Networks A key challenge in gene expression analysis is the reconstrucron of regulatory networks. DisRnguish correlaron and regularon Direct and in direct regularon
24 Challenges of Gene Bayesian Network Massive number of variables (genes) Small number of samples (dozens) Sparse networks (only a small number of genes directly affect one another) Two crucial aspects: computaronal complexity and starsrcal significance of relarons in learned models N. Friedman, 2005
25 Approach 1: Learning BN from Gene Expression Data Measured expression level of each gene (discretized) Random variables Affecting on another Data + Prior Information Learn parameters (conditional probabilities) from data Learn structure (casual relation) from data Make inference given a learned BN model N. Friedman, 2005
26 Gene Bayesian Network Gene E Qualitative Part: Directed acyclic Graph (DAG) Nodes random variables Edges direct (causal) influence Gene D Gene B Gene A E B P(A E,B) Gene C Quantitative part Local conditional probability
27 SoluRons Sparse candidate algorithm (by Nir Friedman): Choose a small candidate set for direct influence for each gene. Find oprmal BN constrained on candidates. IteraRvely improve candidate set. Bootstrap confidence es6mate: use re sampling to generate perturbarons of training data. Use the number of Rmes a relaron (or feature) is repeated among networks learned from these datasets to esrmate confidence of Bayesian network features.
.")
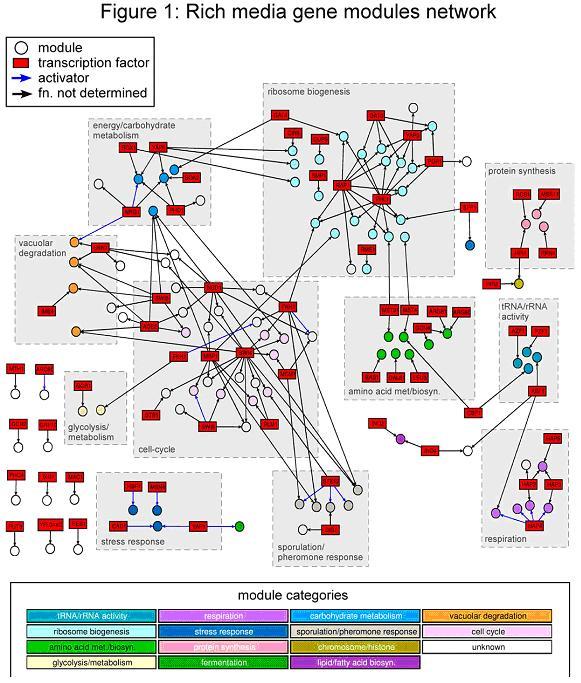
28 N. Friedman, 2005 Data: 76 samples of 250 cell-cycle related genes in yeast genome Discretized into 3 expression levels. Run 100 bootstrap using sparse learning algorithm. Compute the confidence of features (relations). Most high confident relations make bio-sens

29
30 Co RegulaRon A key regularon mechanism involves binding of transcripron factors to promoter regions of genes. IdenRfy the transcripron factor binding sites in the promoter region of genes that can explain observed co expression.
31 Module Network Approach A regulatory module is a set of genes that are regulated in convert by a shared regularon program. A regularon program specifies the behavior of the genes in the module as a funcron of the expression level of a small set of regulators

32 R g,j as depending on the promoter sequence Seq g Regulatory Model
33 IntegraRon of Sequence and Expression Data The parameters of this condironal probability characterize the specific morf recognized by the transcripron factor. This extension allows us to learn the characterizaron of the binding site while learning how its presence influences gene expression.
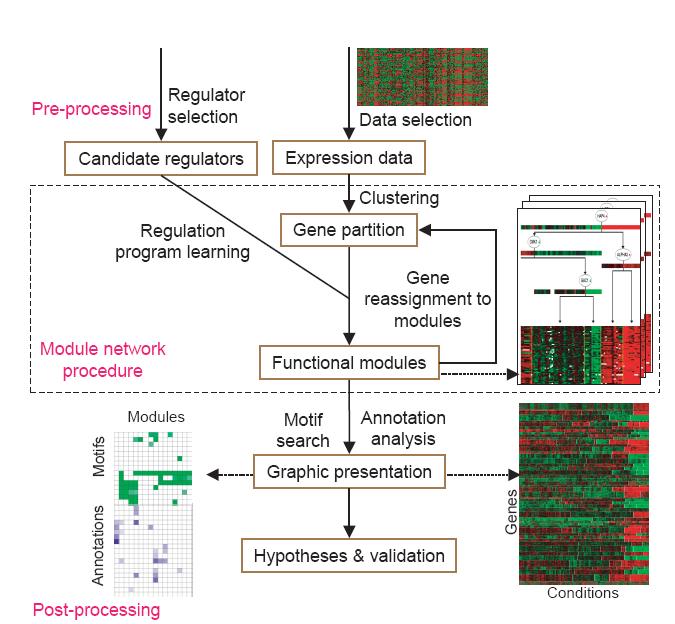
34 Procedure Inputs: a gene expression data set and a large precompiled set of candidate regulatory genes for the corresponding organism (independent of data set) containing both know and putarve transcripron factors and signal transducron molecules Goal: search for a parrron of genes into modules and for a regularon program for each module Output: a list of modules and associated regularon programs
35
36 Results: apply the method to Yeast gene expression data set consisrng of 2355 genes and 173 arrays. Each inferred modules contained a funcronally coherent set of genes (metabolic pathways, oxidarve stress, cell cycle related processes, etc) Many module has a match between predicted regulator and its known cis regulatory binding morf.

37 One Example

38 Row: genes Column: arrays
39 EvaluaRon of Module Content and RegulaRon Program We evaluate all 50 modules to test whether the proteins encoded by genes in the same module had related funcrons. We scored the funcronal/biological coherence of each module according to percentage of its genes covered by annotarons. Most of modules had a coherence level above 50%.

40
41
42
43 Candidate regulators Compiled a set of 466 candidate regulators annotated in Yeast Genome and Proteome databases Use Yeast gene expression data set consisrng of 173 microarrays that measure responses to various stress condirons. We downloaded these data in log (base 2) raro to control format from Stanford Microarry Database. Chose a subset of 2355 genes that have a significant change in gene expression under the measured stress condirons
44 Protein annota6ons: downloaded Gene Ontology and Munich InformaRon center for Protein Sequence (MIPS) funcron and KEGG. Regula6on program: Regression tree (decision nodes and leaf nodes); the model semanrcs is that given a gene g in the module and an array a in a context, the probability of observing some expression value for a gene in array is governed by the normal distriburon specified for the context.
45 Learning Module Networks In each iteraron, the procedure searches for a regularon program for each module and then reassign each gene to the module whose program best predicts its behavior. Repeated unrl it converges. Search for the model with the highest score by using the EM algorithm.
46 EM Algorithm M Step: given a parrron of genes into modules and learns the best regularon program (regression tree) for each module. The regularon program is learned through a combinatorial search over the space of trees. The tree is grown from the root to its leaves. At any given node, the query that best parrrons the gene expression into two disrnct distriburon is chosen.
47 E step: given the inferred regularon programs, we determine the module whose associated regularon program best predicts each gene s behavior. Select the module whose program gives the gene s expression profile the highest probability and re assign the gene to this module. We iniralize our modules to 50 clusters using Pcluster, a hierahical agglomerarve clustering. We then applied the EM algorithm to this starrng point, refining both the gene parrroin and the regulatory program.
48 EvaluaRng starsrcal significance of modules All of the starsrcal evaluarons were done and visualized in GeneXPress. The tool can evaluate the output of any clustering program for enrichment of gene annotarons and morfs
49 AnnotaRon enrichment We associated each gene with the processes in which it parrcipates. Resulted in 923 GO categories, 208 MIPS categories, and 87 KEGG pathways. For each module and for each annotaron, we calculated the fracron of genes in the module associated with that annotaron and used the hypergeometric distriburon to calculate a P value for this fracron.
50 Promoter Analysis We search for morfs (represented as PosiRon Specific Scoring Matrices) within 500 bp upstream of each gene. We downloaded TRANSFAC, containing 34 known funcron cisregulatory morfs. We also use a morf finder to find 50 potenrally novel morfs.
51 MoRf CombinaRon We searched for starsrcally significant occurrences of morf pairs. We constructed a morf pair aaribute, which assigns a true value for each gene if and only if both morfs of the pair are found in the upstream region of that gene. For each module and for each morf pair aaribute, we calculated the fracron of genes in the module associated with that aaribute and used the hypergeometric distriburon to calculate a P value for this fracron.
52 Regulator AnnotaRons We associate regulators with annotarons and binding sites in the same way we associate with these aaributes to the modules. Because a regulator may regulate more than one module, its targets consist of the union of the genes in all modules predicted to be regulated by that regulator. We tested the targets of each regulator for enrichment of the same morfs and gene annotarons as above using the hypergeometric P value.