High-throughput Biophysical Analysis of Protein Stability: Comparability Assessments and Formulation Development
|
|
|
- Rhoda Ford
- 5 years ago
- Views:
Transcription
1 High-throughput Biophysical Analysis of Protein Stability: Comparability Assessments and Formulation Development David B. Volkin Department of Pharmaceutical Chemistry, Macromolecule and Vaccine Stabilization Center 2 nd International ti Symposium on Higher-Order Od Structure t of Protein Therapeutics February 2013
2 Outline of Presentation Protein Stability and Comparability Assessments Introduction Case study highlighting challenges and opportunities of high-throughput biophysical analysis Protein Stability and Formulation Development Introduction Case studies utilizing high-throughput biophysical analysis- Albumin-fusion protein Pentameric recombinant plasma glycoprotein
3 Biopharmaceutical Comparability Approaches and Analytical Challenges Biochemical and biophysical testing: QC analytical tests Analytical characterization tests for structure or activity Stability profile and degradation profile Biological and animal testing: Biological assays that are linked to mechanism of action Animal pharmacology & toxicology studies if appropriate Clinical testing: Human PK studies where good correlates with clinical activity are known In the event all of the above are inconclusive, human efficacy and/or safety studies may be needed Analytical challenge: Need for improved methodologies to examine higher-order structural integrity and conformational stability


4 Comparability Assessments- Need for New Analytical Approaches to Evaluate Higher-Order Structure and Stability 1. One approach is to use higher-resolution resolution biophysical techniques: X-ray Crystallography NMR Ion Mobility Mass Spectrometry HD-Exchange Mass Spectrometry 2. Are there alternative approaches to obtain better biophysical characterization data with protein drugs??? Large amounts of lower-resolution data High throughput screening Data analysis and visualization


 1.1 1.0 A 1.1 1.0 B 346 C 0.9 0.9 345 Relative ME at 222 nm 0.8 0.7 0.6 0.")

5 R Empirical Phase Diagrams- Visualize Large Amounts of Biophysical Data (Developed by Middaugh Lab; Applied to Formulation of Proteins and Vaccines) A B 346 C Relative ME at 222 nm Relative Fl. peak intensity Fl. peak position (nm) Experimental Data Relative helix content 3.2 D Relative ANS Fl. peak intensity 1.0 E ANS Fl. peak position (nm) 524 F Visualization G H I Optical density at 350 nm Relative Fl. light scattering Excess MHC Relative ME at 222 nm Figure 1 A B C Relative Fl. peak intensity Fl. peak position (nm) 100 Interpretation Relative helix content D Relative ANS Fl. peak intensity E ANS Fl. peak position (nm) F G H I Optical density at 350 nm Relative Fl. light scattering Excess MHC Figure 2 REVIEW: Maddux NR et al, J. Pharm. Sci. 100, (2011)
6 Typical Procedure for Constructing EPD Techniques: Fluorescence Emission Circular Dichroism UV Absorbance Buffer Subtraction Buffer Subtraction Buffer Subtraction Peak Select one or two 2 nd Derivative / Preprocessing: Picking/Tracing Wavelength(s) Smoothing Average Multiple Runs Normalization Average Multiple Runs Normalization Peak Picking/Tracing Average Multiple Runs Normalization Input Matrix Preparation EPD Processing: Singular Value Decomposition Color Mapping Empirical Phase Diagram


7 Case Study: Fibroblast Growth Factor (FGF1) Alsenaidy MA, Wang T et al, Protein Si Science 21, (2012) 16 kda, heparin-binding protein unstable at room temperature Multifunctional protein involved in angiogenesis, wound healing, embryonic development Possible therapeutic agent for the treatment of ischemic diseases Collaboration with Michael Blaber, Florida State University looking at 10 different mutants Bernett MJ, Somasundaram T, Blaber M, Proteins: Structure, Function, and Bioinformatics 57, (2004)


8 The Empirical Phase Diagram (EPD) Summarizes and Visualizes Biophysical Data ANS Fluorescence ph 3 ph 4 ph 5 ph 6 ph 7 ph 8 Empirical Phase Diagram of FGF1 Wild Type Intrinsic Fluorescence Light Scattering Tempera ature ( C) Circular Dichroism ph ph Spectroscopic data: ph 3-8, C, FGF1- WT

 Tem 60 50 40 30 1 20 10 3")


")

9 90 WT FGF1 Empirical Phase Diagram of WT WT FGF1 + Heparin perature( o C) Tem ph Empirical FGF1- Phase Diagram Mutant of K12V-P134V-C117VH FGF1- Empirical Phase Mutant Diagram of SYM6 J Temperature( o C) Temperature( o C) ph ph

10 Ongoing Work: Possible Use of EPDs for Biopharmaceutical Comparability? Can we extend results from FGF-1 mutant study to examine same molecule with different post-translational modifications? How to define structural regions more quantitatively? Similar color regions represent similar Clustering analysis helps identify conformational behaviors regions computationally Temp ( C C) ph ) Temp ( C ph Currently assessing EPDs using an IgG1 mabs with varying glycosylation patterns


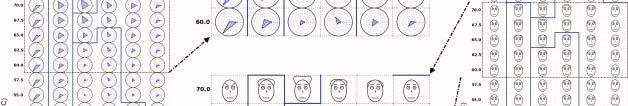

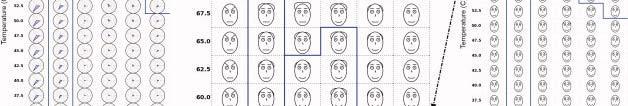


11 Alternative Data Visualization Approaches (BSA): Structural Stability by EPDs, Radar Charts, Chernoff Face Diagrams Kim et al, Protein Science 21, (2012) 2

")


12 Protein Stability: Challenges During Formulation Development Protein molecule Unique sequence and physicochemical properties Specific biological i l activities iti Major changes due to small differences: Alter amino acid residue or glycosylation pattern Environment around the protein Solution ph, ionic strength Different classes of pharmaceutical excipients Different primary containers Stresses on this combination Temperature and time (storage) Agitation, freeze/thaw, light, lyophilization, etc. Formulation design space: protein structure vs. formulation vs. environmental stresses Platform-Approach-for-Early-Biologics-Development/ physiology/lymphaticsystem/antibodymediated/antibodymediated.htm
13 Protein Stability and Formulation Development- Case Study with Recombinant Pentameric Glycoprotein Characterization and stabilization ti of recombinant human protein pentraxin (rhptx-2) Lui J et al, J Pharm Sci 102, (2013) Background PTX-2 functions as part of innate immune system as soluble pattern recognition receptor. Unique structure with two sides: Calcium mediated ligand binding Fcγ receptor binding Receptor binding initiates biological responses including regulation of monocytes populations. rhptx-2 has anti-fibrotic activity in vivo and has entered clinical trials.

")


14 Initial Biophysical Characterization: Pentameric Pentraxin Protein (rhptx-2) SDS-PAGE SV-AUC SEC cief Cp (kcal/mole/ / o C) DSC


15 Biophysical Characterization of rhptx-2: Higher-Order Structural Changes as Function of Temp and ph CD CD 216 nm Melts OD 350 nm Melts Trp Fluor. Trp Fluor. Int. Melts Trp Fluor. λ Melts ANS Fluor. ANS Fluor. Int Melts ANS Fluor. λ Melts


16 Aggregation of rhptx-2: Effect of Excipients SEC analysis after 24 hours at 65 C at ph 7.5 t=0 stabilizers control destabilizers
 Background EphB4 is tyrosine kinase receptor overexpressed in variety of epithelial cancers.")
17 Protein Stability and Formulation Development- Case Study with Albumin Fusion Protein Biophysical characterization and stabilization ti of the recombinant albumin fusion protein sephb4-hsa Shi S et al, J Pharm Sci 101, (2012) Background EphB4 is tyrosine kinase receptor overexpressed in variety of epithelial cancers. Binding of EphB4 to EphrinB2 ligand binding signals cell adhesion, migration. sephb4 (extracellular domain of protein) is effective antagonist of signaling. Inhibits tumor growth in animal models. Subramanian GM et al, Nature Biotechnology 25, (2007) sephb4-hsa shows activity with extended pk in animals


18 Initial Biophysical Characterization of sephb4, HSA, sephb4-hsa Size Analysis Stability Analysis DSC DLS SDS-PAGE c(s) distri ibution S values sephb4-hsa sephb4 HSA DS/DP SV-AUC Process Changes and Comparability Sedimentation Coefficient (s)
 Molar 0.0E+00 ph 3-1.0E+06 ph 4 ph 5 ph 6-2.0E+06 ph H7 ph 8-3.")
 ANS fluorescence intensity ph 3 7.0E+05 ph 4 ph 5 6.0E+05 ph 6 ph 7 5.0E+05 ph 8 4.")
 Trp fluorescence intensity 2.5E+06 2.0E+06 1.")
 Process Changes and Comparability ph 3 ph 4 ph 5 ph 6 ph 7 ph 8 305 325 345 365 385 405 ANS fluorescence")
19 Biophysical Characterization of sephb4 and sephb4-hsa: Higher-Order Structural Changes as Function of Temp and ph sephb4 1.0E E E+05 ellipticity (deg cm 2 /dmol) Molar 0.0E+00 ph 3-1.0E+06 ph 4 ph 5 ph 6-2.0E+06 ph H7 ph 8-3.0E Wavelength (nm) Trp fluorescence intensity ph 3 2.5E+06 ph 4 ph 5 ph 6 2.0E+06 ph 7 ph 8 1.5E E E E Wavelength (nm) ANS fluorescence intensity ph 3 7.0E+05 ph 4 ph 5 6.0E+05 ph 6 ph 7 5.0E+05 ph 8 4.0E E E E E Wavelength (nm) Molar ellipticity (deg cm 2 /dm mol) 5.0E E E E E E+07 ph3 ph4 ph5 ph6 ph7 ph Wavelength (nm) Trp fluorescence intensity 2.5E E E E E E+00 DS/DP Wavelength (nm) Process Changes and Comparability ph 3 ph 4 ph 5 ph 6 ph 7 ph ANS fluorescence intensity 2.0E+06 ph 3 1.5E E E E Wavelength (nm) Circular Dichroism (CD) Trp fluorescence ANS fluorescence ph 4 ph 5 ph 6 ph 7 ph 8 sephb4-hsahsa


 Effect on")
 DS/DP Process")


20 Conformational Stability sephb4-hsa: Effect of NaCl and Disaccharides Trp fluorescence peak position vs. temperature (center of mass method) Effect on Thermal Onset Temperature (Tonset) DS/DP Process Protein Changes (ph 7): ~ 55 C and Comparability mm NaCl ~ 70 C + 10% sugar ~ C + NaCl and sugar ~ 75 C
 ± SD (%) (%) ± SD (%) + 150 mm NaCl No NaCl 0 35.9 ± 0.0 0 24.")

21 Aggregation of sephb4-hsa: Effect of NaCl and Disaccharides SE-HPLC analysis after 20 hours at 48 C at ph 7 NaCl accelerates protein aggregation Sucrose inhibits Effect of NaCl less pronounced with sugar Excipient Sugar Aggregate Sugar Aggregate Excipient (%) ± SD (%) (%) ± SD (%) mm NaCl No NaCl ± ± ± ± ± Sucrose ± 0.1 Sucrose DS/DP Process Changes and Comparability Trehalose ± ± ± ± ± ± ± ± ± 0.2 Trehalose ± ± ± ± ± 0.1
22 Correlation Analysis of EphB4-HSA with ~25 Excipients: Aggregation Rate by SEC vs. Conformational Stability by DSC R 2 = R 2 = Aggregate e (%) (%) Aggregate Tm of HSA domain of sephb4-hsa ( o C) DS/DP Process Changes and Comparability Structural stability of EphB4 domain mediates aggregation and overall instability of fusion protein EphB4- HSA Tm of sephb4 domain of sephb4-hsa ( o C)
23 Summary- Protein Stability and Therapeutic Protein Development Formulation Development Protein Stability Comparability Assessments Analytical Methods
24 Acknowledgements Co-authors on published papers presented td Russ Middaugh and Sangeeta Joshi at KU Mike Blaber, Florida State University Financial support from VasGene Therapeutics and Promedior
25 KU Macromolecule and Vaccine Stabilization Center Macromolecular and Vaccine Stabilization Center at KU: Unique and innovative center specializing in the characterization and stabilization of vaccines as well as protein and DNA based pharmaceuticals.
26 Thank you for your attention! Questions?