SUPPLEMENTARY INFORMATION
|
|
|
- Walter Eaton
- 5 years ago
- Views:
Transcription
1 doi: /nature10963 Supplementary Table 1 Data collection, phasing and refinement statistics. Crystal Native Derivative-1 (OsO 4 ) Derivative-2 (Orange-Pt) Data collection Space group C2 C2 C2 Cell dimensions a, b, c (Å) 220.8, 88.8, , 88.3, , 88.9, α, β, γ (º) 90.0, 125.9, , 126.7, , 125.9, 90.0 Source SP8 44XU NSRRC BL13C1 Wavelength (Å) Resolution (Å) a ( ) ( ) ( ) R merge (%) 8.0(49.7) 9.5(49.6) 10.8(48.1) I/σ 20.8(2.7) 34.5 (5.7) 18.4 (4.0) Completeness (%) 98.7(98.5) 99.5(99.6) 99.7(100.0) Redundancy of reflection Phasing # of sites 2 4 Phasing power (iso/ano) b 0.55/ /0.19 R cullis (%) (acentric/centric) c 67.2/ /74.8 R cullis (%) (ano) d Figure of Merit (SOLVE) 0.31 Figure of Merit (RESOLVE) 0.59 Refinement Resolution range (Å) 2.35 No. reflections 95,106 R work (%)/R free (%) 16.80/20.31 No. atoms Protein 10,862 (1,480 residues) Water 592 IDP 18 (2 IDP) DM 275 (9 DM) Mg 10 K 2 B-factors (Å 2 ) All atoms Protein Water IDP DM Mg K R.m.s deviations Bond length (Å) Bond angle ( o )
2 Crystal Derivative-3 (Ta 6 Br 12 ) Data collection Space group C2 C2 C2 Cell dimensions a, b, c (Å) 218.6, 88.2, , 88.2, , 88.2, α, β, γ (º) 90.0, 126.2, , 126.2, , 126.2, 90.0 Source NSRRC BL13B1 Peak Inflection Remote Wavelength (Å) Resolution (Å) a ( ) ( ) ( ) R merge (%) 10.6(39.9) 9.5(37.9) 7.7(42.5) I/σ 19.1(2.2) 19.6(2.4) 19.5 (1.9) Completeness (%) 91.7(66.5) 92.4(66.8) 90.0(61.2) Redundancy of reflection Phasing # of sites 4 Phasing power (iso/ano) b 1.00/0.96 R cullis (%) (acentric/centric) c 92.1/92.4 R cullis (%) (ano) d 87.1 a Values in the parentheses are for the highest resolution shell. b Phasing power = RMS ( FH /ε), where FH is the heavy-atom structure factor amplitude and ε is the residual lack of closure error. As given by autosharp 44. c Rcullis = Σ FPH - FP exp - FPH - FP calc /Σ FPH - FP exp, where FPH is the heavy-atom derivative structure factor amplitude and FP is the native structure factor amplitude. As given by autosharp 44. d Rcullis (ano) = Σ FPH + - FPH - exp - FPH + - FPH - calc /Σ FPH + - FPH - exp, where FPH is the heavy-atom derivative structure factor amplitude. As given by autosharp
3 Supplementary Table 2 Detailed interactions of dimer interface. Salt bridge Hydrogen bond Hydrophobic interaction Secondary structure Subunit A Residue Atom Secondary structure Subunit B Residue Atom Distance α2 R441 NH2 M13 E606 OE2 2.3 M13 E606 OE1 α2 R441 NH2 2.3 α2 R441 O M13 R609 NH1 3.0 α2 R441 O M13 R609 NH2 3.0 L12 V568 O L12 V570 N 3.1 L12 V570 N L12 V568 O 3.2 M13 Y587 OH M13 Y587 OH 2.2 M13 R609 NH2 α2 R441 O 2.9 M5 L258 CD2 M10 A445 CB 4.0 L8 F393 CZ L12 L571 CB 4.0 α2 T442 CG2 M13 V605 CG1 3.2 M10 A445 CB M5 L258 CD2 4.1 M10 A445 CB M16 I721 CG2 3.5 M10 A445 CB M16 I725 CG1 3.9 M10 V448 CB M16 I725 CD 3.7 M10 I449 CD M16 P728 CG 3.8 M10 P450 CZ M13 L602 CD1 4.1 M10 L452 CD1 M13 M594 CE 3.8 M10 L452 CD1 M16 I725 CG2 4.0 M10 A453 CB M13 M594 CB 3.8 M10 Y456 CD1 M13 Y587 CD2 3.9 M10 Y456 CD2 M13 S590 CB 3.6 M10 Y456 CB M13 A591 CB 3.5 M10 Y456 CE2 M13 M594 CG 4.0 M10 V459 CG2 M13 M584 CG 3.5 M10 V459 CG2 M13 Y587 CB 3.9 M10 I460 CG1 M13 M584 SD 3.9 M10 I460 CG1 M13 W588 CG 3.8 M10 I463 CG1 M13 M584 CG 3.8 M10 F464 CE1 M13 V581 CG2 4.0 M10 F464 CZ M13 M584 CE 3.8 M10 F464 CZ M13 W588 CZ3 4.2 M10 A467 CB M13 I580 CG2 4.1 M10 A467 CB M13 V581 CG2 4.0 M10 I470 CD M13 F576 CD2 3.9 M10 I470 CG2 M13 I577 CG2 4.1 M10 F471 CD1 M13 P573 CB 3.8 M10 F471 CB M13 I577 CG2 4.0 M10 F471 CZ α4 F763 CE1 3.6 M10 F474 CG M13 P573 CG 3.4 M12 L553 CD1 L12 L571 CD2 3.6 M12 L553 CD2 M13 F576 CD2 3.7 (Å) 3
4 Hydrophobic interaction Secondary structure Subunit A Residue Atom Secondary structure Subunit B Residue Atom Distance M12 F556 CE2 L12 V570 CG1 3.9 M12 F556 CD2 L12 L571 CD2 3.8 M12 V560 CG2 L12 L571 CD1 3.7 L12 T567 CG2 M13 T567 CG2 3.9 L12 V568 CG1 L12 V570 CG L12 V570 CG2 L12 V568 CG1 3.7 L12 V570 CG2 L12 V570 CG2 2.8 L12 L571 CB L8 F393 CZ 4.0 L12 L571 CD2 M12 L553 CD1 3.8 L12 L571 CD2 M12 F556 CD2 4.0 L12 L571 CD1 M12 V560 CG2 3.5 L12 L571 CD1 L12 V568 CG2 3.9 M13 P573 CB M10 F471 CD1 3.9 M13 P573 CG M10 F474 CD1 3.7 M13 F576 CD1 M10 I470 CD 3.9 M13 F576 CD1 M12 L553 CD2 3.6 M13 F576 CZ M15 L673 CD1 3.9 M13 F576 CZ M15 V674 CG2 4.1 M13 I577 CG2 M10 F471 CB 4.1 M13 L579 CD2 M15 V674 CG2 3.7 M13 I580 CD M10 I463 CG2 3.3 M13 I580 CG2 M10 A467 CB 3.9 M13 I580 CB M15 V674 CG2 3.7 M13 I580 CD M15 V677 CG2 4.1 M13 V581 CG1 M10 F464 CE1 3.9 M13 V581 CG2 M10 A467 CB 4.1 M13 M584 CG M10 V459 CG2 3.6 M13 M584 SD M10 I460 CG1 4.1 M13 M584 CG M10 I463 CG1 3.9 M13 M584 CE M10 F464 CZ 3.8 M13 Y587 CD1 M10 Y456 CD1 3.7 M13 Y587 CB M10 V459 CG2 3.9 M13 W588 CD1 M10 I460 CD 3.5 M13 W588 CZ3 M10 F464 CZ 4.2 M13 S590 CB M10 Y456 CD2 3.7 M13 A591 CB M10 Y456 CB 3.6 M13 M594 CE M10 I449 CG2 4.0 M13 M594 CE M10 L452 CD1 3.9 M13 M594 CB M10 A453 CB 3.8 M13 M594 CG M10 Y456 CE2 4.0 M13 L602 CD1 M10 F450 CZ 3.8 M13 V605 CG1 α2 T442 CG2 3.7 M15 A670 CB L12 V570 CG1 4.1 M15 A670 CB M13 V579 CD2 4.2 (Å) 4
5 Hydrophobic interaction Secondary structure Subunit A Residue Atom Secondary structure Subunit B Residue Atom Distance M15 L673 CG M13 F576 CZ 4.1 M15 L673 CD1 M13 I580 CD 3.6 M15 V674 CG1 M13 F576 CZ 3.9 M15 V674 CG1 M13 L579 CD2 3.6 M15 V674 CG1 M13 I580 CD 3.2 M15 V674 CB M13 A583 CB 3.8 M15 V677 CG1 M13 I580 CD 4.1 M16 I721 CG2 M10 A444 CB 4.1 M16 I721 CG2 M10 A445 CB 4.2 M16 I725 C1G M10 A445 CB 4.0 M16 I725 CD M10 V448 CB 3.5 M16 P728 CG M10 I449 CD 3.9 α4 F763 CE2 M10 F471 CZ 3.4 (Å) 5
6 Supplementary Table 3 The binding interaction of IDP and Mg ions. Atom/Metal ion Subunit A Subunit B position Coordination Distance (Å) Coordination Distance (Å) Mg1 Wat A Wat B Wat A Wat B Wat A Wat B D253 OD1 1.9 D253 OD1 2.0 D257 OD2 2.0 D257 OD2 2.0 Mg2 Wat A Wat B Wat A Wat B Wat A Wat B Wat A Wat B D507 OD1 2.1 D507 OD1 1.8 Mg3 Wat A Wat B Wat A Wat B D253 OD2 2.3 D253 OD2 2.2 D727 OD1 2.1 D727 OD1 2.1 Mg4 Wat A Wat B Wat A Wat B D283 OD1 2.2 D283 OD1 2.0 D507 OD2 2.2 D507 OD2 1.9 Mg5 Wat A Wat B Wat A Wat B N534 OD1 2.1 N534 OD1 2.1 D691 OD2 2.0 D691 OD2 2.3 IDP O1 Mg3 2.0 Mg3 2.1 K250 NZ 3.1 K250 NZ 2.8 K730 NZ 2.8 K730 NZ 2.9 O2 Mg4 2.1 Mg4 2.1 O3 Mg5 2.2 Mg5 2.2 K 3.4 K 3.0 N Mg5 2.1 Mg5 2.0 O4 K694 NZ 3.2 K694 NZ 3.2 O5 Mg1 2.1 Mg1 2.1 Mg3 2.2 Mg3 2.0 O6 Mg2 2.1 Mg2 2.2 Mg4 2.1 Mg
7 Supplementary Table 4 Salt-bridge network. Secondary structure Cationic/donor Residue Atom Secondary structure Anionic/acceptor Residue Atom Distance M5 K261 NZ L5 E268 OE1 2.4 M5 K261 NZ M15 E698 OE2 2.9 M12 R523 NH1 L5 D269 OD2 3.1 M12 R523 NH2 L5 E268 OE2 3.0 M12 R523 NH2 M12 D527 OD1 3.5 M15 K695 NZ M12 D527 OD1 2.5 (Å) 7
8 Supplementary Table 5 PP i hydrolysis and proton pumping activities of variants with mutation at residues along proton translocation pathway.* Residues in H + -PPase from V. radiata R242 D294 K742 E301 *n.d., not detectable. Organism Mutation PP i hydrolysis Proton pumping (% of WT) (% of WT) References A. thaliana R246K R246A S. coelicolor R207A n.d. n.d. 19 R207K R. rubum R176A 4 n.d. 46 R176K V. radiata R242A S. coelicolor D259G n.d. n.d. 19 V. radiata D294N 9 n.d. this work D294E 6 n.d. this work D294T 5 n.d. this work D294A 6 n.d. this work V. radiata K742A 7 n.d. this work K742R 7 n.d. this work K742M 6 n.d. this work A. thaliana E305Q 10 n.d. 24 E305D 30 n.d. 24 S. coelicolor E262A n.d. n.d. 19 E262Q 10 n.d. 19 E262D n.d. n.d. 19 V. radiata E301A
9 9
10 10
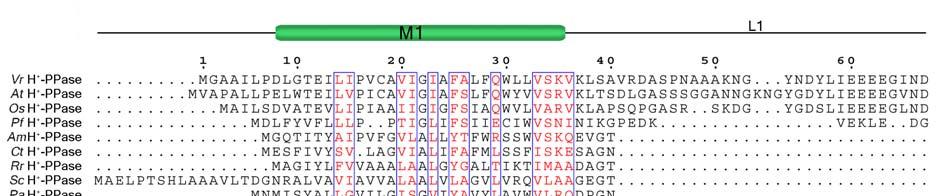
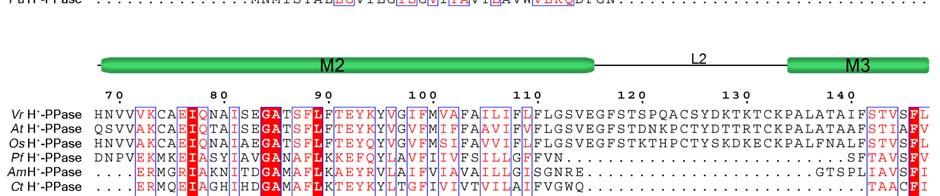
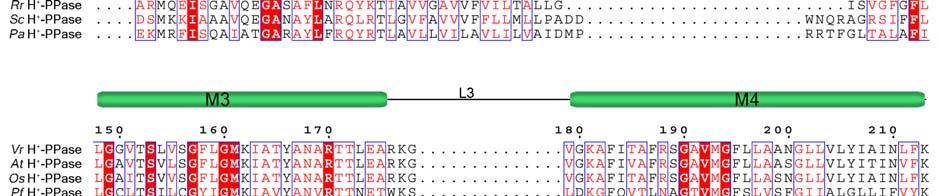
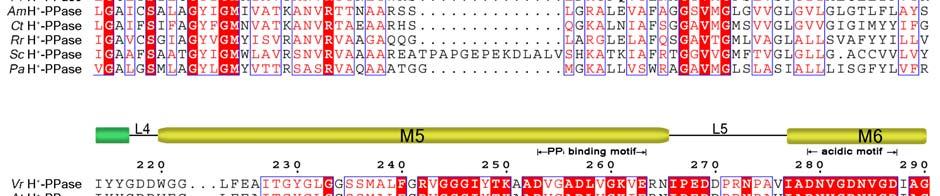
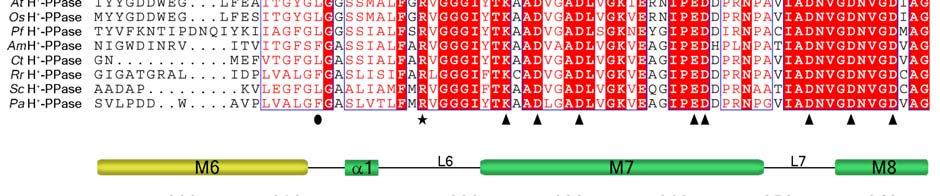
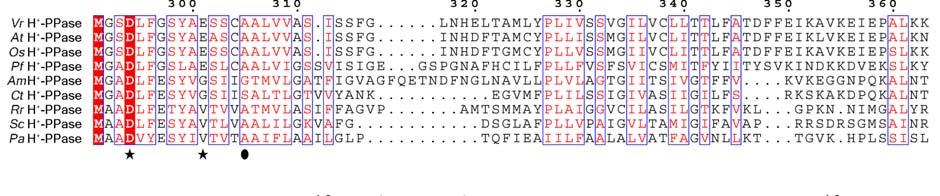
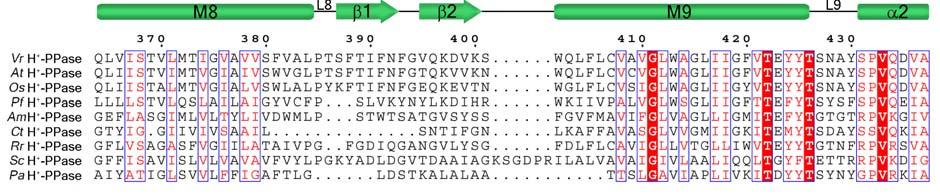
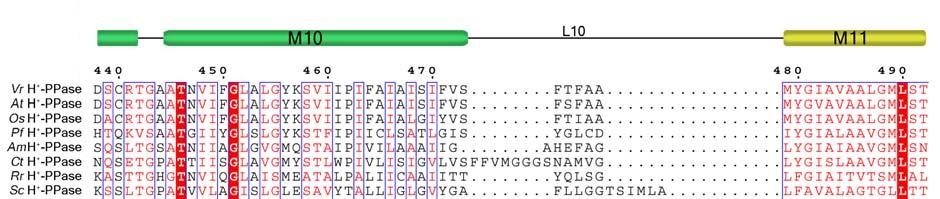
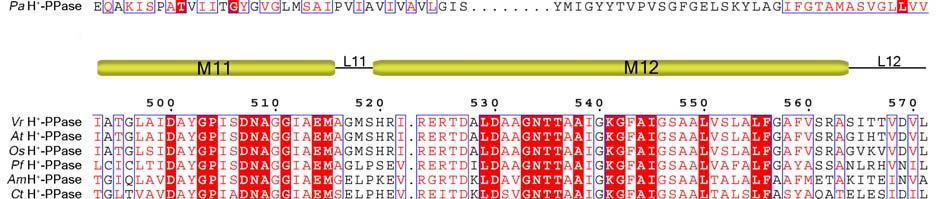
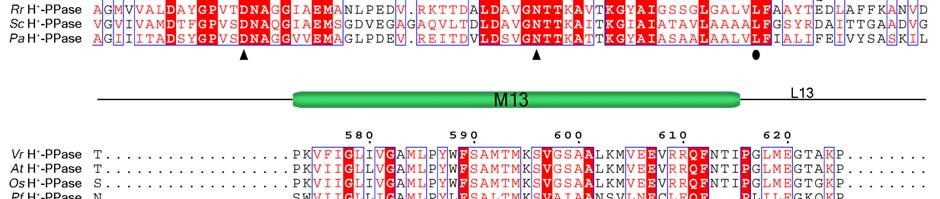
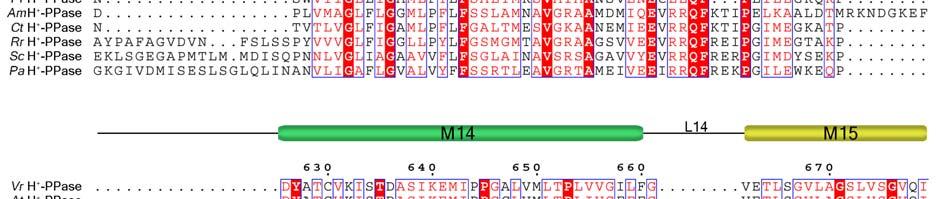
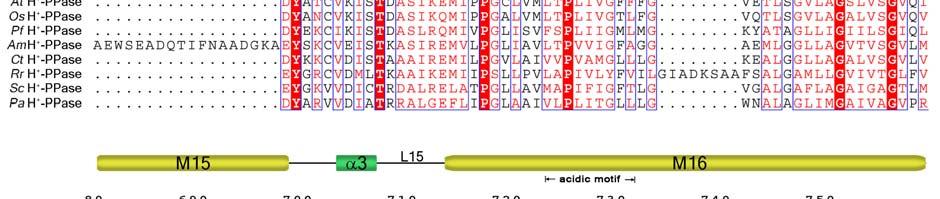
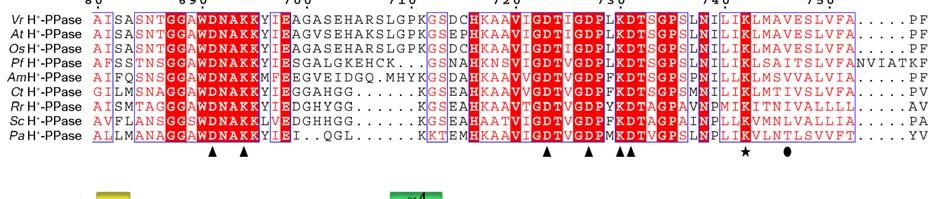
11 Supplementary Figure 1 Multiple sequence alignment of H + -PPase. Alignment of H + -PPase sequences from different organisms: Vr, Vigna radiata, At, Arabidopsis thaliana, Os, Oryza sativa Japonica Group, Pf, Plasmodium falciparum, Am, Acetabularia mediterranea, Ct, Clostridium tetani, Rr, Rhodospirillum rubrum, Sc, Streptomyces coelicolor, Pa, Pyrobaculum aerophilum str. IM2. Fully conserved residues are shaded in red, and regions with similar residues are boxed in blue. The secondary structure of VrH + -PPase is shown above the sequence. Green and yellow cylinders, M1-M16, represent the outer and inner walls, and they correspond to the structures shown in Fig. 1b. Additional helices are labeled as α1-α4. For the VrH + -PPase complex, the residues involved in IDP binding, proton translocation, and formation of a hydrophobic gate are indicated with triangles, stars and circles, respectively. The alignment was generated with ESPript


12 Supplementary Figure 2 Structural topology of the VrH + -PPase. The topology of VrH + -PPase is shown, with sixteen TMs numbered 1-16 and colored in green and yellow as in Supplementary Fig. 1. The missing residues (42-66) in the crystal structure are shown in gray. The residues involved in the IDP binding are shown in red and blue circles for acidic and basic residues, respectively. Four proton translocating residues are colored in purple. 12

 between each")


13 Supplementary Figure 3 Structure of the VrH + -PPase. a, Two monomers of the VrH + -PPase dimer in the crystal are superimposed. The structurally different regions (Loop 2 and Loop 13) between each monomer are colored in green and cyan, respectively. The IDP in each subunit is shown as sticks and colored. b,c, Two orthogonal views of the VrH + -PPase dimer are shown. The interacting helices between the two subunits are labeled and colored in green and cyan, respectively. The residues involved in dimer interaction through salt bridges (R441 and E606) and hydrogen bonds (R441, V568, V570, Y587 and R609), located near the cytosol and vacuolar lumen regions, are shown in sticks, 13
14 respectively. d, The surface electronic potential of the VrH + -PPase dimer is presented. The M13 and M15 of each monomer are drawn with cartoon and colored in green and cyan, respectively. A and B subunits of the dimer are displayed separately in order to clearly demonstrate the surface electron potential distribution of the interface. The mostly hydrophobic interactions were observed in the membrane portion. The residues exerting additional interactions, R441, Y587, E606 and R609 located at/near cytosolic region, were presented. 14


15 Supplementary Figure 4 Salt bridge network. The cytosolic view of the core TMs shows the salt bridge-interacting network with contributions from seven charged residues. The IDP and the salt bridge-interacting residues are colored in CPK. Six salt bridge interactions are shown as dashed lines, corresponding to Supplementary Table
16 Supplementary Figure 5 Trypsinolysis analysis of VrH + -PPase. Upper panel, microsomal and purified VrH + -PPases were incubated with/without trypsin in the presence of substrate (PP i ), substrate analogue (IDP), and hydrolytic product (P i ), respectively, if any. The samples were subsequently subjected to Western blotting analysis. Lower panel, the relative remaining amounts of VrH + -PPase were determined from upper panel. Different degrees of trypsin resistance in the presence/absence of ligands explicitly indicate the distinct conformational states of VrH + -PPase. Control, without trypsin treatment; error bars, s.d. of three independent experiments. 16
17 Supplementary References 44 Vonrhein, C., Blanc, E., Roversi, P. & Bricogne, G. Automated structure solution with autosharp. Methods Mol. Biol. 364, (2007). 45 Zancani, M., Skiera, L. A. & Sanders, D. Roles of basic residues and salt-bridge interaction in a vacuolar H + -pumping pyrophosphatase (AVP1) from Arabidopsis thaliana. Biochim. Biophys. Acta 1768, (2007). 46 Schultz, A. & Baltscheffsky, M. Properties of mutated Rhodospirillum rubrum H + -pyrophosphatase expressed in Escherichia coli. Biochim. Biophys. Acta 1607, (2003). 47 Gouet, P., Courcelle, E., Stuart, D. I. & Metoz, F. ESPript: analysis of multiple sequence alignments in PostScript. Bioinformatics 15, (1999). 17