SUPPLEMENTARY INFORMATION
|
|
|
- David Dalton
- 5 years ago
- Views:
Transcription

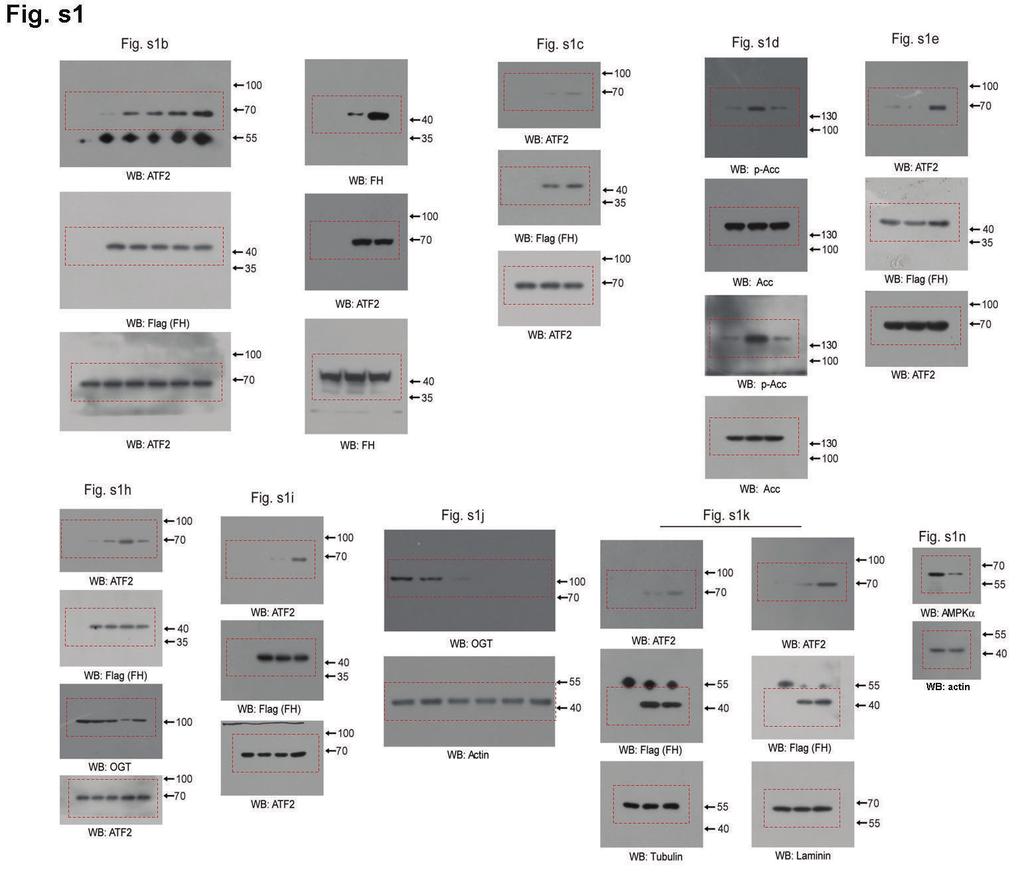
1 DOI: /ncb3562 In the format provided by the authors and unedited. Supplementary Figure 1 Glucose deficiency induced FH-ATF2 interaction. In b-m, immunoblotting or immunoprecipitation analyses were performed using the indicated antibodies. Data represent 1 out of 3 experiments. (a) HPDE cells expressing Flag FH were cultured for 6 h in the glucose-free DMEM; cellular extracts subjected to immunoprecipitation with an anti-flag antibody were analyzed by mass spectrometry. FH-interacting proteins identified by mass spectrometry were shown. (b) HPDE cells were cultured for 6 h in the DMEM with indicated concentrations of glucose (left panel). HPDE cells were cultured for 6 h in the glucose-free DMEM (right panel). (c) SW1990 cells were cultured for 6 h in the glucose-free DMEM. (d) PANC-1 (upper panel) and SW1990 cells (bottom panel) pre-treated with Compound C for 1 h were cultured for 6 h in the glucose-free DMEM. (e) HPDE cells were cultured for 6 h in the glutamine-free or glucose-free DMEM. (f, g) HPDE cells (f) and PANC-1 cells (g) were cultured for various length of time in the glucose-free DMEM. (h) PANC-1 cells were expressed with OGT shrna and reconstituted with or without the expression of RNAi-resistant Myc-rOGT. Cells were cultured for 6 h in the glucose-free DMEM. (i) SW1990 cells expressing Flag FH with or without OGT shrna expression were cultured for 6 h in the glucose-free DMEM. (j) HPDE and PANC-1, and SW1990 cells were expressed with or without OGT shrna. (k) HPDE cells were cultured for 6 h in the glucose-free DMEM. Cytosolic and nuclear fractions were prepared. (l) PANC-1 (left panel) and SW1990 cells (right panel) were expressed with OGT shrna, and the cell lines with distinct efficiency of OGT depletion were isolated. Cell death rate was examined by PI staining and FACS analyses. PANC-1 and SW1990 cell lines with moderate silence of OGT were selected (shown as P2 in PANC-1 and S1 in SW1990 cells). The values are presented as mean ± s.e.m. (n = 3 independent experiments). * represents p<0.05 and ** represents p<0.01 (Student s t-test) between indicated groups (see Supplementary Table 1 for source data). (m) PANC-1 were transfected with or without the sirna against AMPKa. 1
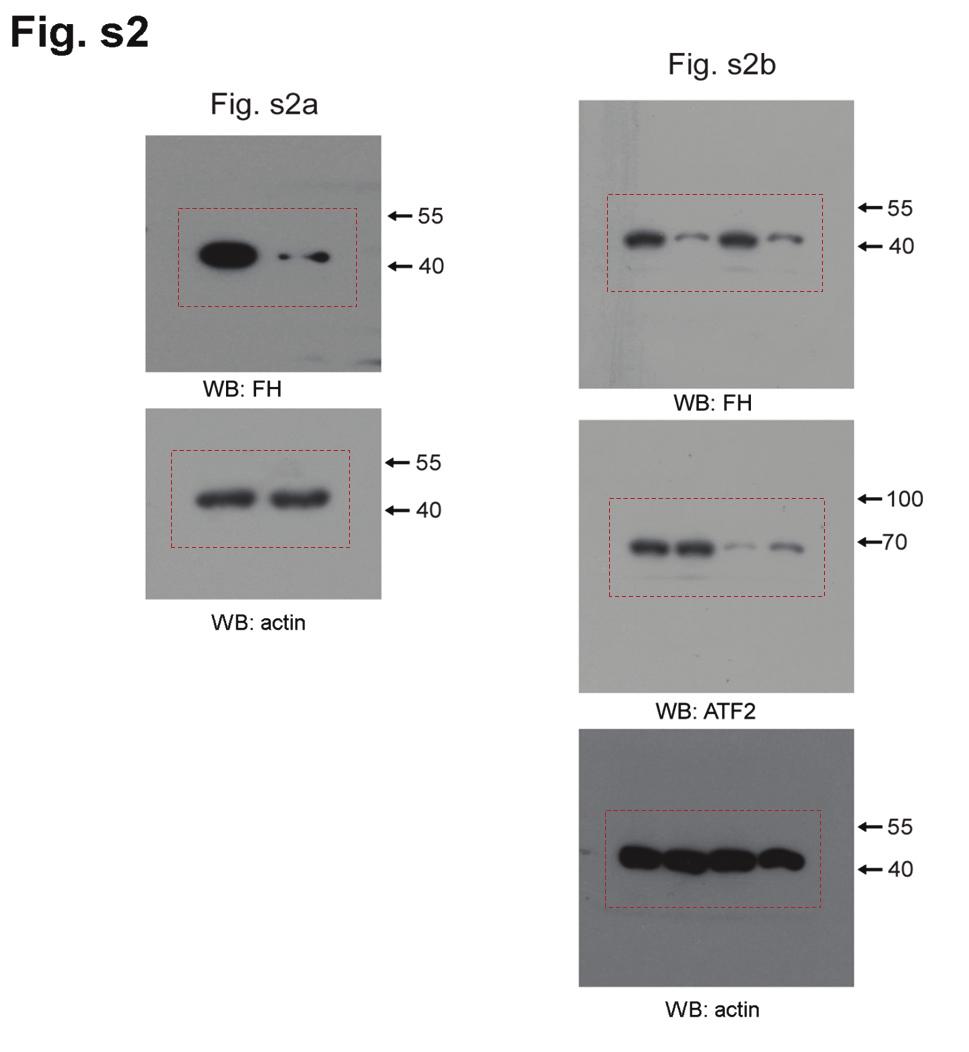
2 Supplementary Figure 2 FH is required for cell growth arrest under glucose deprivation. In a, c and d, the values are presented as mean ± s.e.m. (n = 3 independent experiments). * represents p<0.05 and ** represents p<0.01 (Student s t-test) between indicated groups (see Supplementary Table 1 for source data). (a) SW1990 cells with or without OGT shrna and FH shrna expression, were cultured for 24 h under glucose deficiency condition (0.5 mm). mrna levels of ATF2 targeted genes were analyzed by real-time PCR. (b) PANC-1 cells with or without OGT depletion were expressed with a vector for control shrna or FH shrna and ATF2 shrna. Representative images of FACS analyses for BrdU positive cells were shown. The ratio of the right peak value to the total value positively correlates cell proliferation rate. Cell death rate was examined by PI staining and FACS analyses. (c,d) SW1990 cells with or without OGT depletion were expressed with a vector for control shrna or FH shrna and ATF2 shrna. Cellular proliferation rate was examined by BrdU incorporation assay and FACS analyses (c). Cell death rate was examined by PI staining and FACS analyses (d). 2
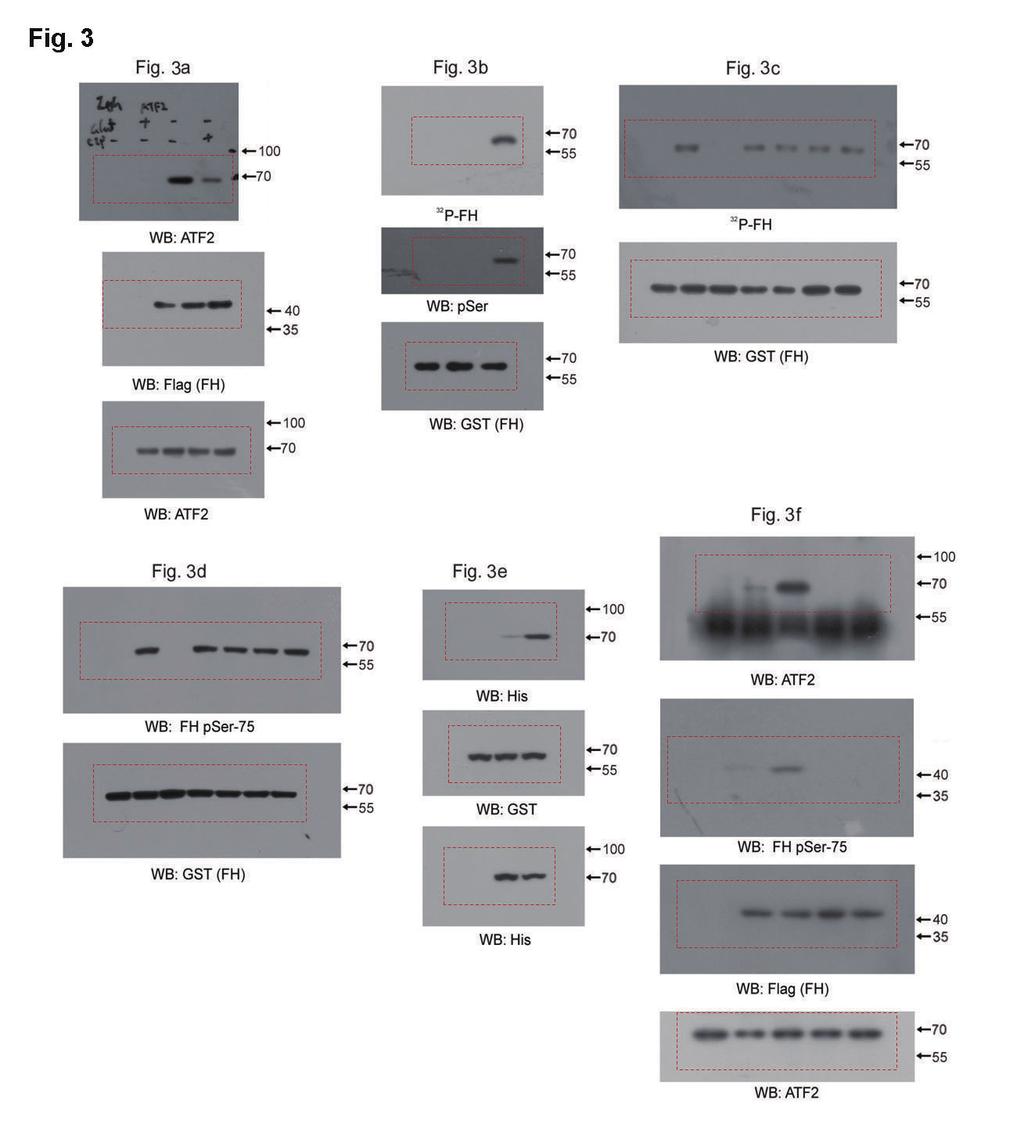
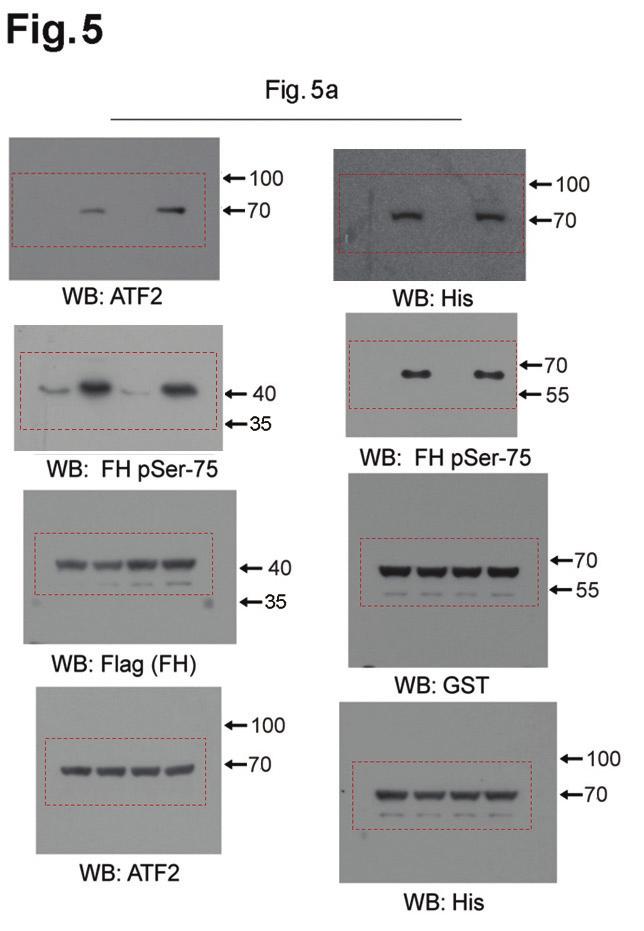
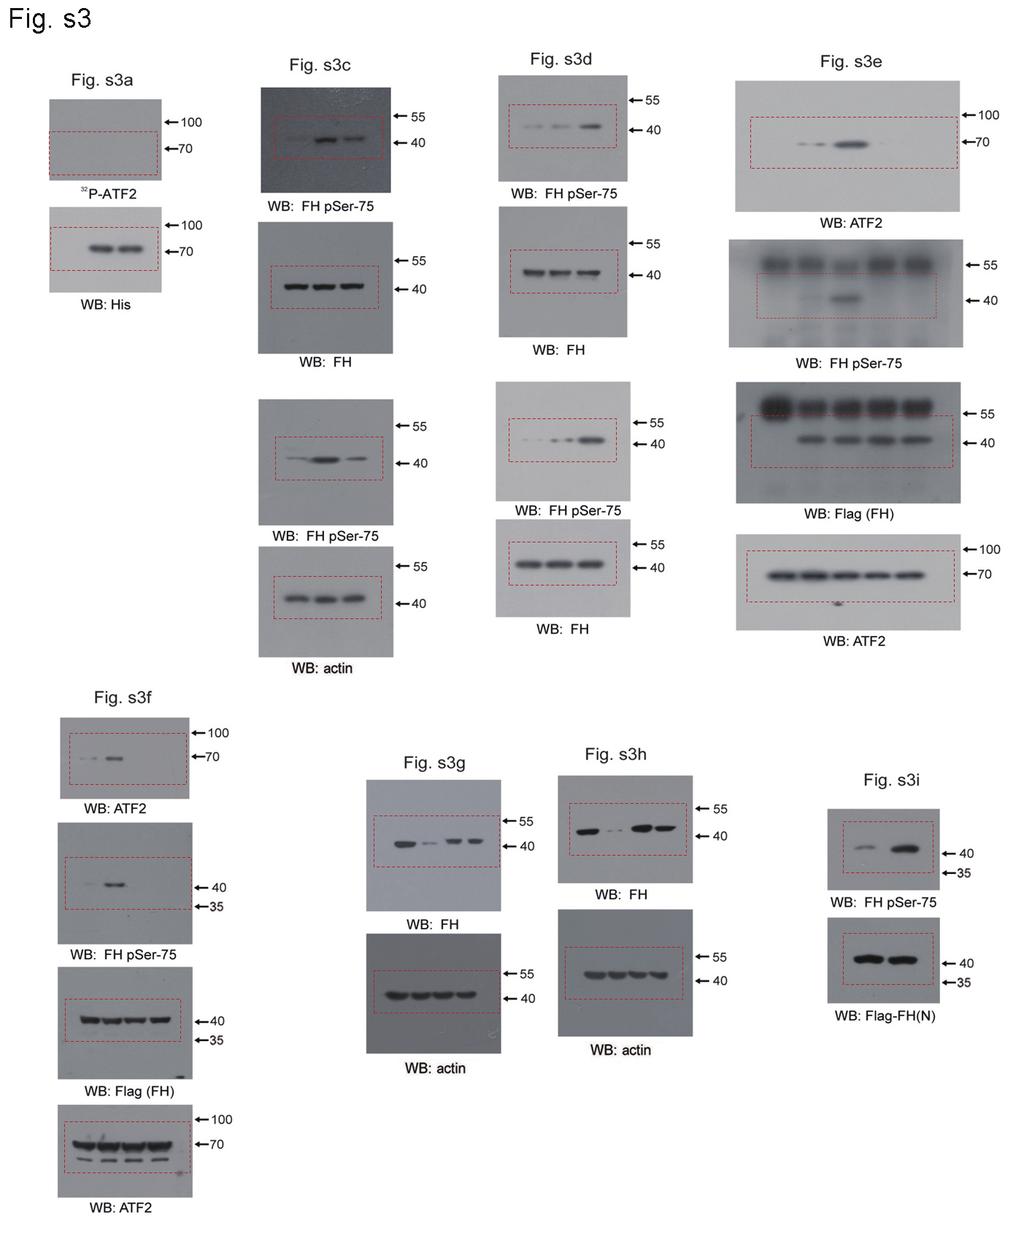
3 Supplementary Figure 3 AMPK-mediated FH phosphorylation is required for FH-ATF2 interaction. In a j, immunoblotting, immunoprecipitation analyses (a i) and ChIP (j and k) analyses were performed using the indicated antibodies. Data represent 1 out of 3 experiments. In j-m, the values are presented as mean ± s.e.m. (n = 3 independent experiments). * represents p<0.05 and ** represents p<0.01 (Student s t-test) between indicated groups (see Supplementary Table 1 for source data). (a) In vitro phosphorylation analyses were performed by mixing the purified AMPK complex with the indicated purified His-ATF2 proteins in the presence of [γ- 32 P]ATP. (b) HPDE cells expressing Flag-FH were cultured for 6 h in the glucose-free DMEM. Immunoprecipitation analysis was performed using the Flag antibody, and the extracts were analyzed by mass spectrometry. The results of a mass spectrometric analysis of a tryptic fragment at m/z (mass error, ppm) matched those of the doubly charged peptide , suggesting that S75 was phosphorylated. The Sequest score for this match was Xcorr = The Mascot score was (c) HPDE cells were pretreated with Compound C (left panel) or transfected with or without the sirna against AMPKa (right panel). Cells were cultured for 6 h in the glucose-free DMEM. (d) PANC-1 (left panel) and SW1990 cells (right panel) expressed with or without OGT shrna were cultured for 6 h in the glucosefree DMEM. (e, f) HPDE cells with expression of indicated Flag FH (e), or SW1990 cells with depletion of OGT and expression of indicated Flag FH (f) were cultured for 6 h in the glucose-free DMEM. Immunoprecipitation analyses were performed. (g) PANC-1 cells were expressed with a vector for control shrna or FH shrna and reconstituted with expression of rfh(n)wt or rfh(n) S75A. (h) SW1990 cells were expressed with a vector for control shrna or FH shrna and reconstituted with expression of rfh(n) WT or rfh(n) S75A. (i, j) PANC-1 cells with depleted OGT, FH and reconstituted expression of rfh(n)wt or rfh(n) S75A were cultured for 6 h in the glucose-free DMEM. Immunoprecipitation analyses were performed (i). ChIP analyses were performed. The primers covering ATF2 binding site of c-jun gene promoter region were used for the real-time PCR. The Y axis shows the value normalized to the input (j). (k) SW1990 cells with depleted OGT, FH and reconstituted expression of WT FH or FH S75A were cultured for 6 h in the glucose-free DMEM. ChIP analyses were performed. The primers covering ATF2 binding site of c-jun gene promoter region were used for the real-time PCR. The Y axis shows the value normalized to the input. (l, m) SW1990 cells with depleted OGT, FH and reconstituted expression of indicated Flag rfh(n) were cultured for 24 h in the DMEM with low glucose (0.5 mm). mrna levels of ATF2 targeted genes were analyzed by real time PCR (l). Cellular proliferation rate were examined by BrdU incorporation assay and analyzed by FACS analyses (m). 3
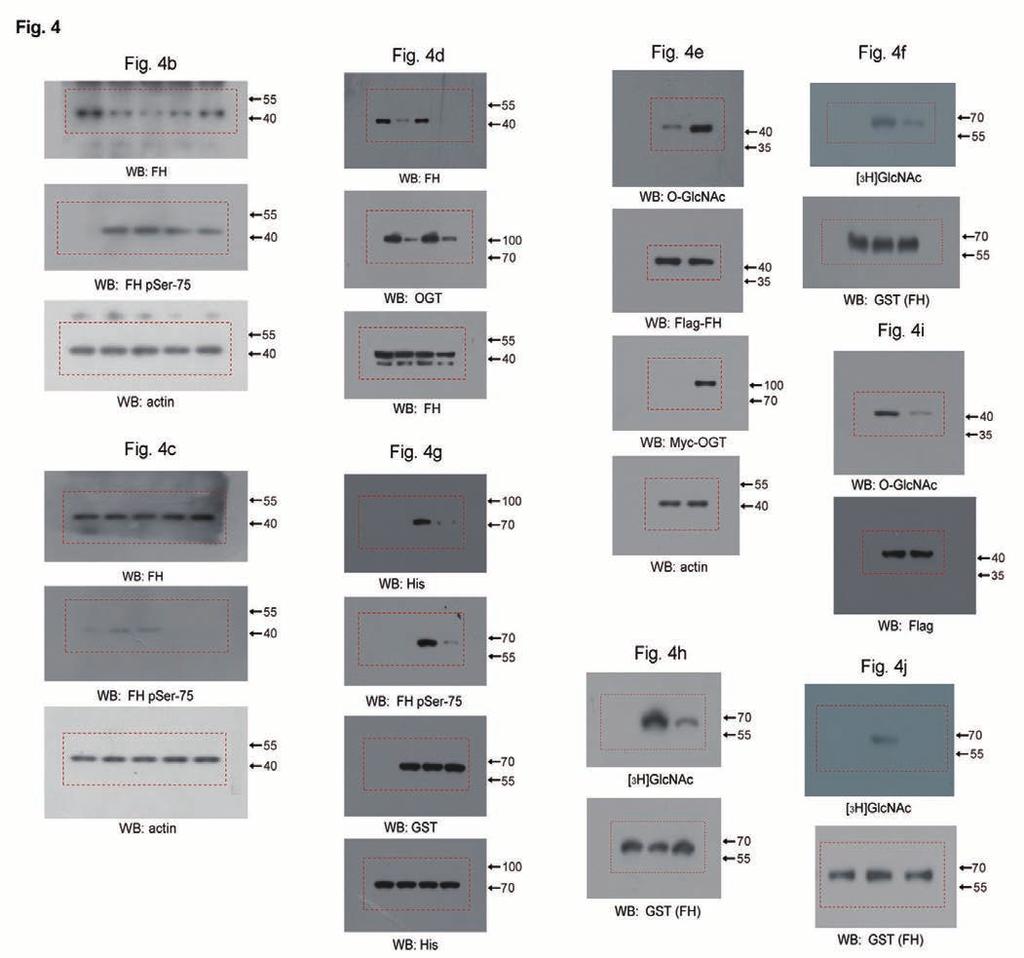
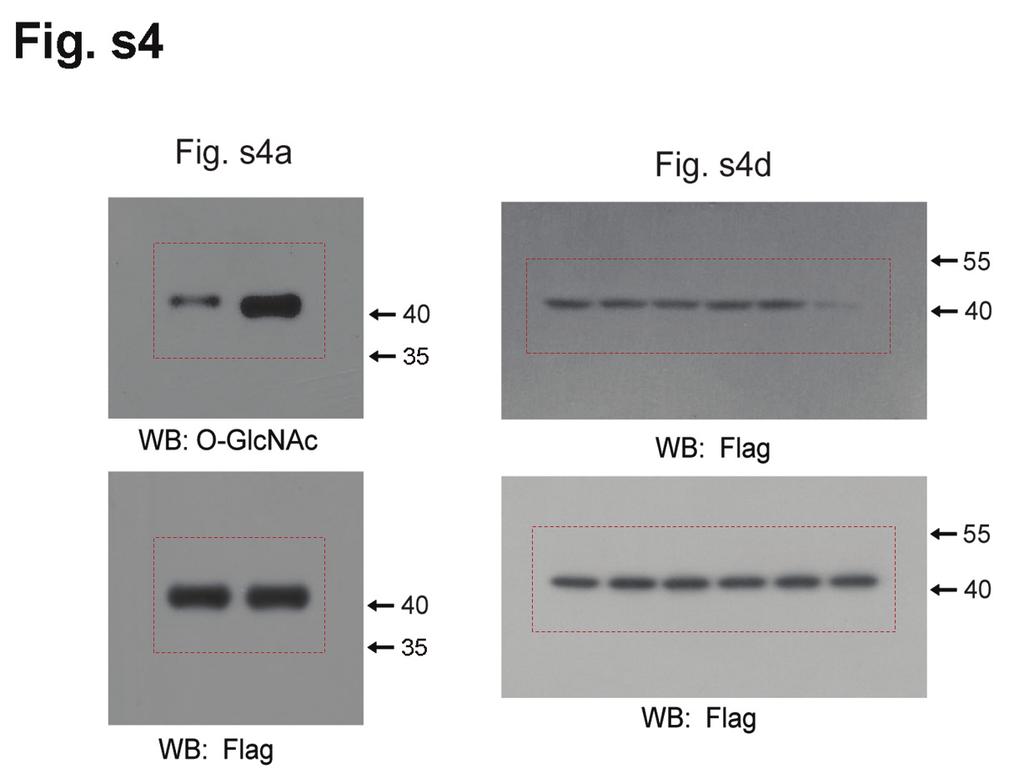
4 Supplementary Figure 4 FH was O-GlcNAcylated at phosporylation site of AMPK. (a) HPDE cells expressing Flag-FH were treated with or without PUGNAc (20 μm) for 24 h. Immunoprecipitation analyses and immunoblotting analyses were performed using the indicated antibodies. Data represent 1 out of 3 experiments (see Supplementary Table 1 for source data). (b) NetOGlyc. 4-software analysis of O-GlcNAcylation site within FH amino acid sequence. (c) Flag-FH was expressed in PANC-1 cells. Immunoprecipitation analysis was performed using the Flag antibody, and the extracts were analyzed by mass spectrometry. The results of a mass spectrometric analysis of a tryptic fragment at m/z (mass error, ppm) matched those of the doubly charged peptide , suggesting that S75 was O-GlcNAcylated. The Sequest score for this match was Xcorr = The Mascot score was (d) PANC-1 cells were expressed with indicated Flag-FH. The O-GlcNAc modified proteins modified by azide were labeled with biotin and isolated with streptavidin beads for immunoblotting analyses. Data represent 1 out of 3 experiments. 4
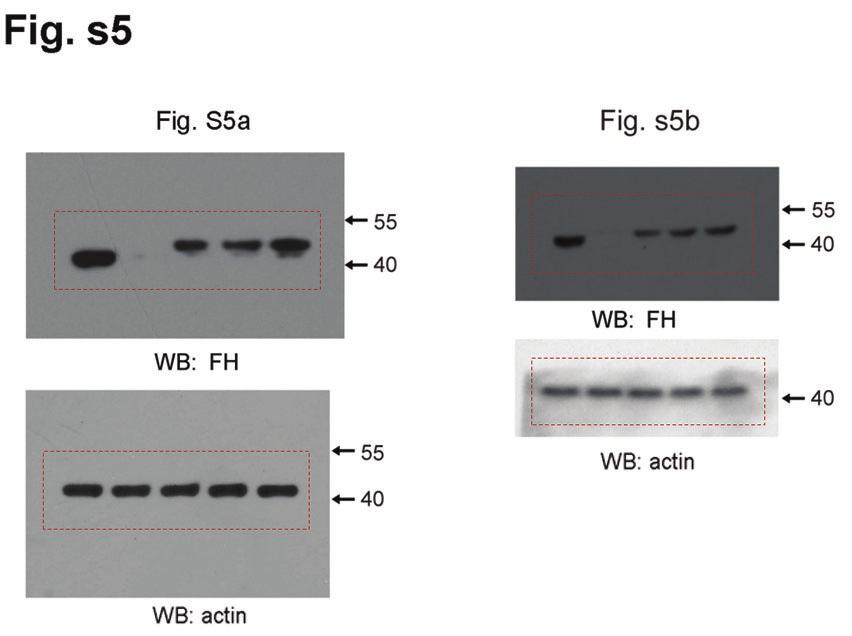
5 Supplementary Figure 5 The local activity of FH at promoter region promotes ATF2-mediated cell proliferation arrest. In a-b, immunoblotting analyses were performed using the indicated antibodies. Data represent 1 out of 3 experiments. In c-i, the values are presented as mean ± s.e.m. (n = 3 independent experiments). * represents p<0.05 and ** represents p<0.01 (Student s t-test) between indicated groups (see Supplementary Table 1 for source data). (a) PANC-1 cells with depleted OGT, FH and reconstituted expression of indicated FH proteins were analyzed by immunoblotting. (b) HPDE cells with FH depletion and reconstituted expression of indicated FH proteins were analyzed by immunoblotting. (c) PANC-1 cells with depleted OGT, FH and reconstituted with expression of the indicated FH proteins, and were incubated with the indicated concentrations of monoethyl-fumarate. The abundance of intracellular fumarate was measured. (d-f) HPDE cells with or without ATF2 and FH depletion, were reconstituted with expression of the indicated FH proteins. Cells were cultured for 24 h in the DMEM with low glucose (0.5 mm) and indicated concentration of monomethyl fumarate. The abundance of intracellular fumarate was measured (d). The mrna level of ATF3 was analyzed by realtime-pcr (e). Cellular proliferation rate were examined by BrdU incorporation assay and FACS (f). (g-i) PANC-1 cells with depletion of OGT, FH and reconstituted expression of indicated Flag rfh(n) were cultured for 24 h in the DMEM with low glucose (0.5 mm) and indicated concentration of diethyl-malate. The abundance of intracellular fumarate was measured (g). The mrna level of ATF3 was analyzed by realtime-pcr (h). Cellular proliferation rate were examined by BrdU incorporation assay and FACS (i). 5
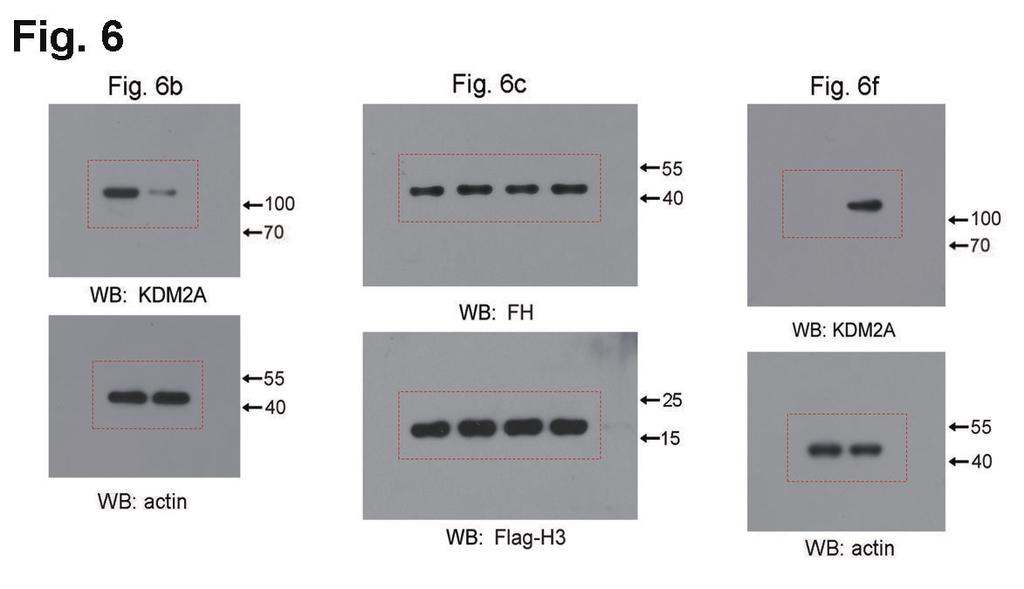
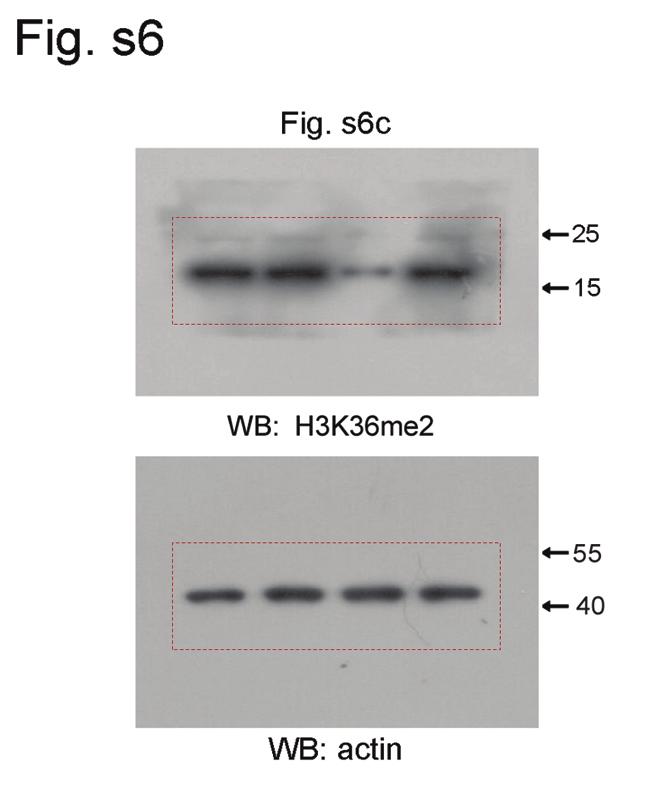
6 Supplementary Figure 6 Fumarate produced at promoter region inhibits H3K36me2 demethylation. In a and b, the values are presented as mean ± s.e.m. (n = 3 independent experiments) (see Supplementary Table 1 for source data). (a) PANC-1 cells with depleted OGT were cultured for 6 h in the absence of glucose. ChIP analyses were performed by using antibodies for H3K36me2, H3K9me2, H3K9me3, and H3K27me2. The primers covering ATF2 binding site of c-jun gene promoter region were used for the real-time PCR. The Y axis shows the fold of the value without glucose normalized to the value with glucose. (b) PANC-1 cells with depleted endogenous FH and expressing WT or indicated mutant Flag rfh(n) and OGT shrna were cultured for 6 h in the absence of glucose. ChIP analyses were performed by using KDM2A antibody. The primers covering ATF2 binding site of c-jun gene promoter region were used for the realtime-pcr. The y axis shows the value normalized to the input. (c) PANC-1 cells with depleted OGT were overexpressed with or without KDM2A in presence or absence of monoethylfumarate (5 mm) addition. Immunoblotting analyses were performed. 6

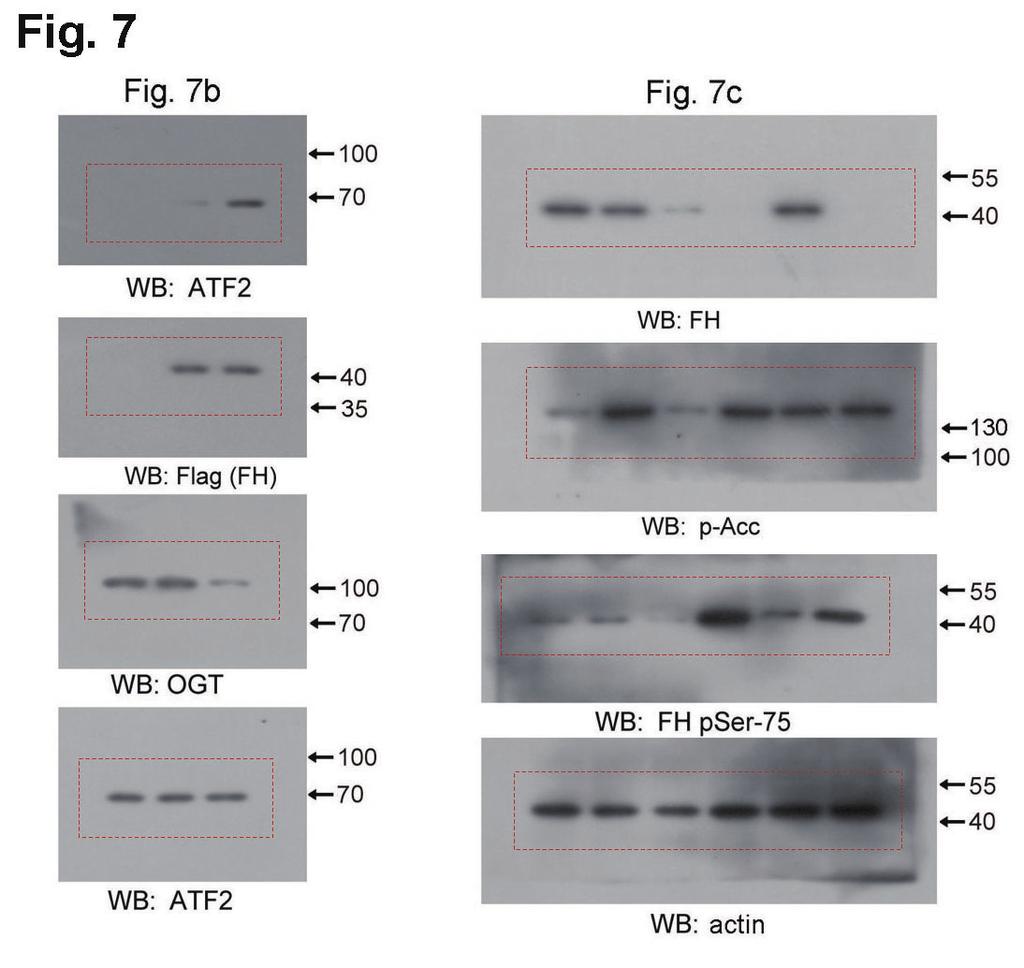
7 Supplementary Figure 7 Inhibition of FH S75 phosphorylation by OGT is required for tumorigenesis. The FH S75 phosphorylation antibody specificities were validated using IHC analyses with specific blocking FH S75 phosphorylation-peptides. Scale bars: 50 μm. 7

8 Supplementary Figure 8 Collection of the unprocessed blot scans used in this manuscript 8
9 9
10 10
11 11
12 12
13 13
14 14
15 15
16 16
17 17
18 18
19 19
20 Supplementary Table 1 Statistics source data. 20