Yellow-bellied marmot genome. Gabriela Pinho Graduate Student Blumstein & Wayne Labs EEB - UCLA
|
|
|
- Moses Summers
- 5 years ago
- Views:
Transcription

1 Yellow-bellied marmot genome Gabriela Pinho Graduate Student Blumstein & Wayne Labs EEB - UCLA


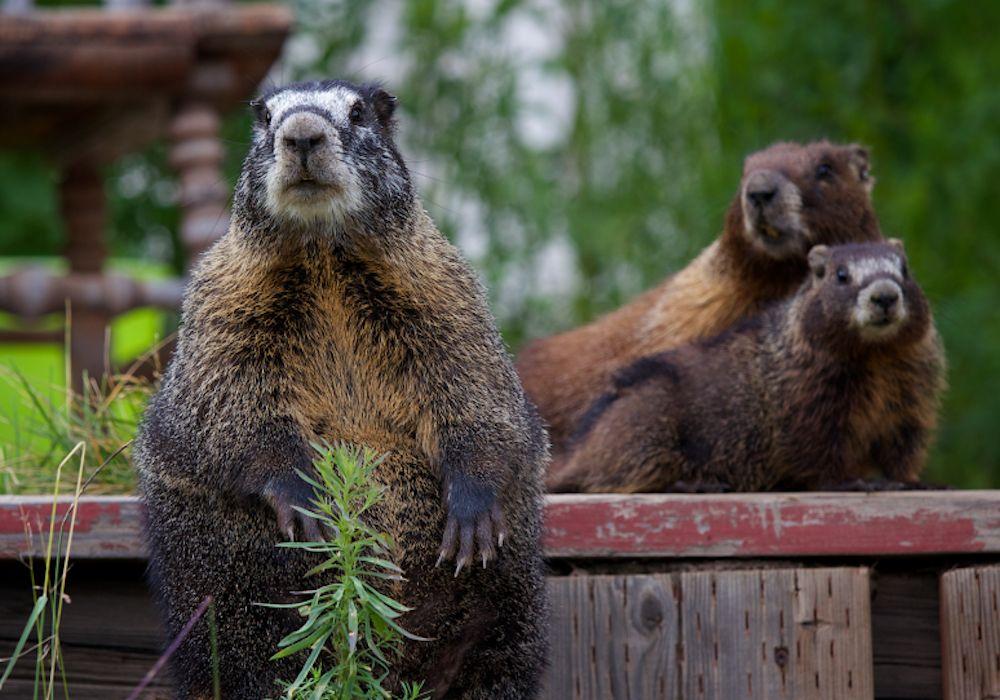
2 Why do we need an annotated genome?.. Daniel T. Blumstein Kenneth B. Armitage
3
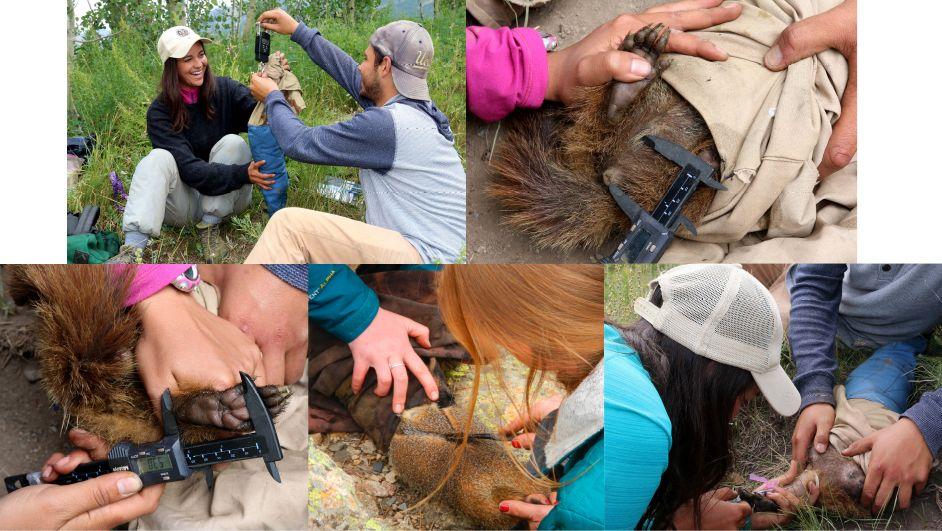
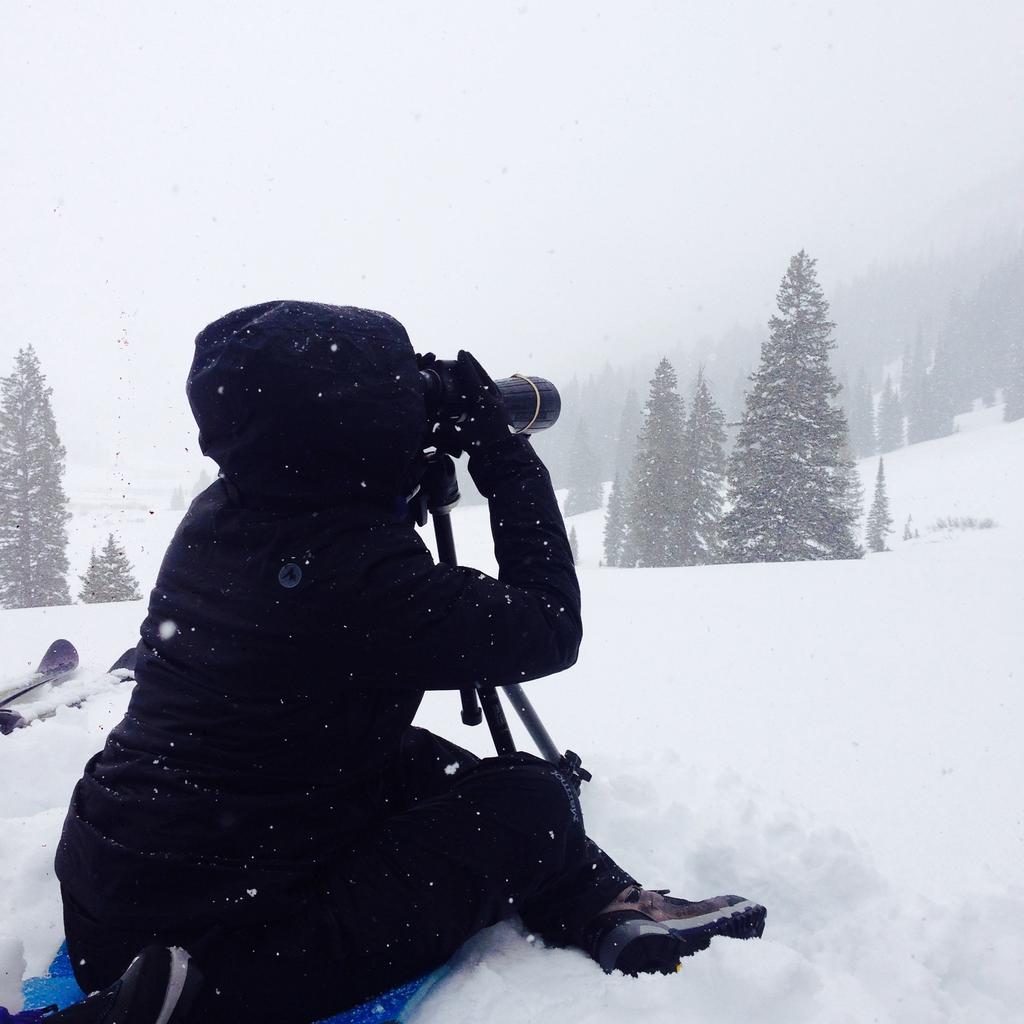
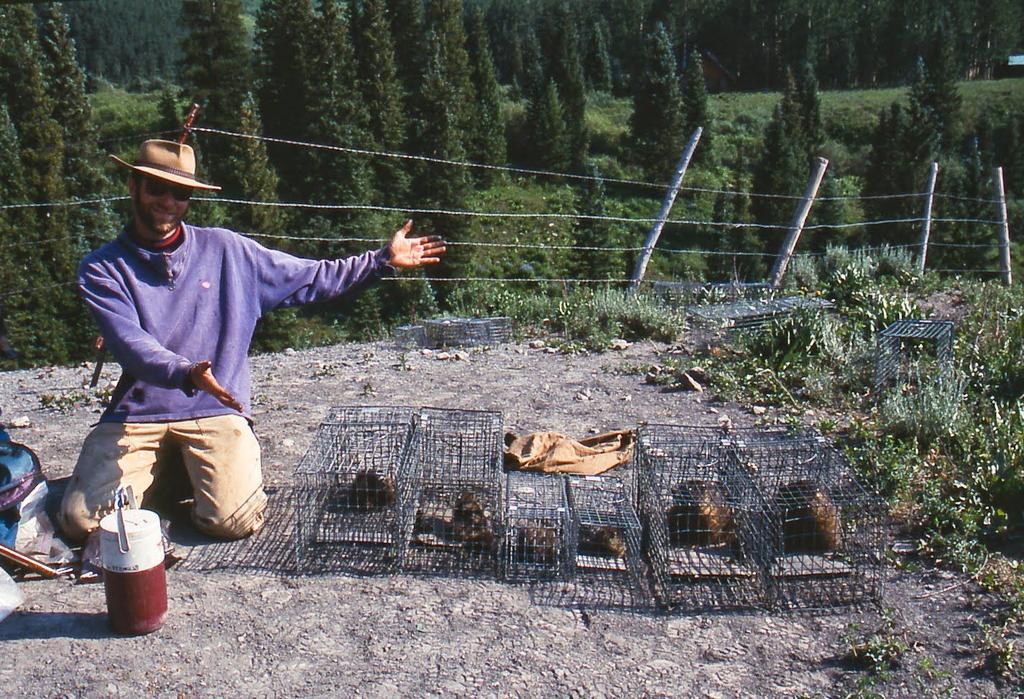
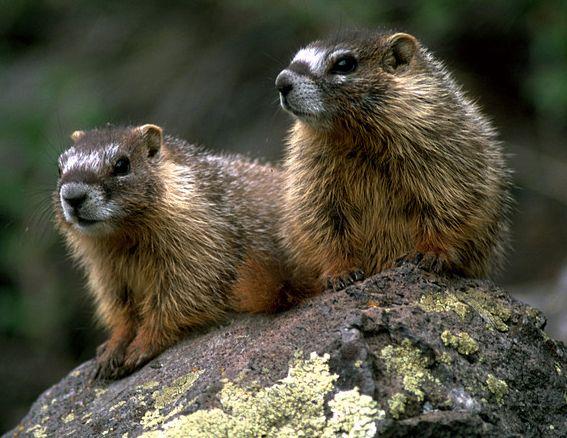
4 Samples & measurements
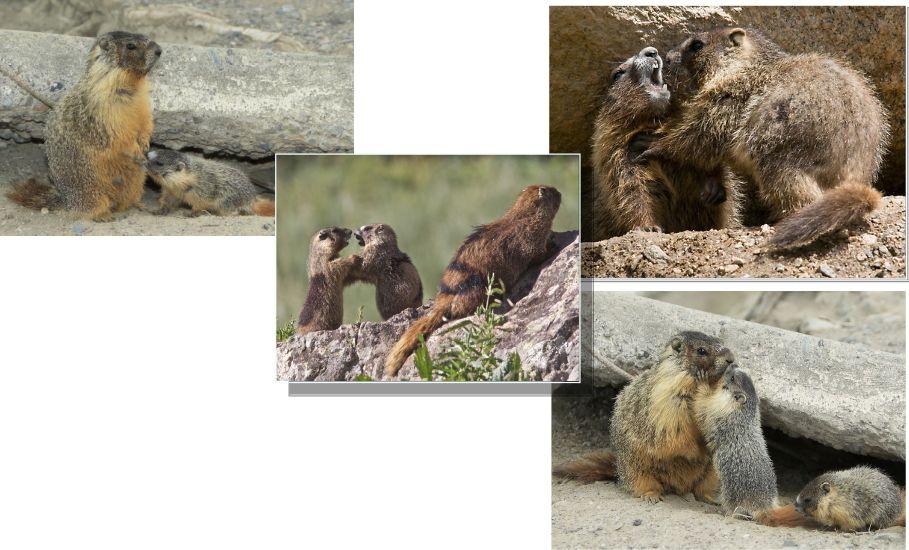

5 Social interactions

6 Results include
 - 62% of RNA data was")
7 Marmot gene expression Dispersal - ~200 genes - Musculature - Metabolism - Immune function Sociality metrics - ~600 genes Tiffany Armenta Graduate Candidate Blumstein & Wayne Labs EEB - UCLA Used the thirteen-lined ground squirrel genome (8-12 MYA) - 62% of RNA data was usable
8 The assembly
9 Sequencing - Genomic DNA extracted from blood of a male, inbred marmot 4 libraries (250bp, 400bp, 700bp & 3-5kb) Select size HiSeq 2500
10 and Sequencing DNA insert bp 400 bp 700 bp 3-5 kb Single-end - Paired-end are reads
11 Contig 1 Contig 2 Contig 3
12 Scaffold 1
13 Scaffold 1 NNNNN NNNNNNNNNNN
14 Reads (single or paired- end) Assembler Scaffolds (Assembly)
15 Reads (single or paired- end) Assembler Scaffolds (Assembly) - Assemblers work differently for each species - ABYSS Meraculous SOAPdenovo - De Bruijn graph-based assemblers
 Font: http://www.homolog.us/tutorials/")
16 Reads (single or paired- end) Assembler Scaffolds (Assembly) Font:
 Read Font: http://www.homolog.")
17 Reads (single or paired- end) Assembler Scaffolds (Assembly) Read Font:
 Font: http://www.homolog.us/tutorials/")
18 Reads (single or paired- end) Assembler Scaffolds (Assembly) Font:
19 Reads (single or paired- end) Assembler Scaffolds (Assembly) Font:
20 Reads (single or paired- end) Assembler Scaffolds (Assembly) Why do you break the reads then? Font:
21 Reads (single or paired- end) - Assembler Scaffolds (Assembly) K-mers with errors occur fewer times than error-free k-mers For each 1000 bp, Illumina mistakes 1 Genome ACTGGGA Sequenced 10X K-mer ACTGGGA 10 K-mer ATTGGGA 1
 Font: http://www.homolog.us/tutorials/")
22 Reads (single or paired- end) Assembler Scaffolds (Assembly) Font:
 Font: http://www.homolog.us/tutorials/")
23 Reads (single or paired- end) Assembler Scaffolds (Assembly) Font:
24 Reads (single or paired- end) Assembler Scaffolds (Assembly) - Assemblers work differently for each species - ABYSS Meraculous SOAPdenovo - De Bruijn graph-based assemblers - Varying kmer sizes
25 8 assemblies Metrics: -N50 (Contigs) Contig 1 -N50 (Scaffolds) -Total of bases (Scaffolds) -Gene contiguity (Busco) -Percentage of RNA mapping (tophat) -Mapping % to Marmota marmota Contig 2 NNN Contig 3 NNNNNNN
26 N50 (scaffolds) N50 (contigs) Total of bases (scaffolds) ABYSS (60kmer) 265.7kb 12.6kb 2.3 Gb ABYSS (55kmer) 233.9kb 10.7kb 2.3 Gb Meraculous (61kmer) 266.2Kb 6.9Kb 2.2 Gb Meraculous (61kmer)_mode2 2.5Kb 2.2Kb 3.3 Gb Meraculous (55kmer) 299.5Kb 7.1Kb 2.3 Gb Meraculous (45kmer) 322.9Kb 6.6Kb 2.3 Gb Meraculous (35kmer) 319.1kb 5.5kb 2.2 Gb SOAPdenovo (61kmer) 82.8kb 1.3kb 3.3 Gb
27 N50 (scaffolds) N50 (contigs) Total of bases (scaffolds) ABYSS (60kmer) 265.7kb 12.6kb 2.3 Gb ABYSS (55kmer) 233.9kb 10.7kb 2.3 Gb Meraculous (61kmer) 266.2Kb 6.9Kb 2.2 Gb Meraculous (61kmer)_mode2 2.5Kb 2.2Kb 3.3 Gb Meraculous (55kmer) 299.5Kb 7.1Kb 2.3 Gb Meraculous (45kmer) 322.9Kb 6.6Kb 2.3 Gb Meraculous (35kmer) 319.1kb 5.5kb 2.2 Gb SOAPdenovo (61kmer) 82.8kb 1.3kb 3.3 Gb
28 gene contiguity (Busco) x RNA mapping (%) Mapping % to M. marmota ABYSS (60kmer) C:89.0%,F:6.3%,M:4.7%,n: ABYSS (55kmer) C:86.2%,F:8.1%,M:5.7%,n: Meraculous (61kmer) C:88.2%,F:6.2%,M:5.6%,n: Meraculous (61kmer)_mode2 C:18.6%,F:29.1%,M:52.3%,n: Meraculous (55kmer) C:87.9%,F:5.8%,M:6.3%,n: Meraculous (45kmer) C:87.7%,F:5.9%,M:6.4%,n: Meraculous (35kmer) C:87.3%,F:6.1%,M:6.6%,n: SOAPdenovo (61kmer) C:79.5%,F:11.4%,M:9.1%,n:

29 ABYSS kmer60 wins! - Checked on IGV
30 ABYSS kmer60 wins! - Checked on IGV - Average genome coverage is 95X
31 .. and now - Help from the MCDB187 cohort - 50 gold standard genes
32 Near future applications
33 Comparative genomic approach - Identify unique molecular traits - All marmots are obligate hibernators months Behavioral and Physiological responses Skip reproductive seasons Social thermoregulation Fastest growth rates in Sciuridae Large body size - Identify genetic signatures associated to adaptations to harsh environments
34 Comparative genomic approach - the capacity to hibernate is associated with a differential pattern of gene expression instead of with changes within gene sequences - examine the level of evolutionary constraint on hibernation-related genes - Large vs. small hibernators
35 Epigenetics
36 So many ideas! To analyze epigenetic patterns associated with growth rates in marmots
37 So many ideas! To analyze epigenetic patterns associated with growth rates in marmots PS: Having a reference genome for this approach is a great advantage
38 Why this is interesting? - One of the main predictors of marmot overwinter survival is weight - Conditions when marmots have less time to grow: - Harsh years - Higher altitude (or slope) - Expectation: higher growth rates in harsher conditions - Maldonado et al. 2017

39 Why this is interesting? - Costs of rapid growth rates: - Mature cell function - Somatic development - Immune function - Epigenetics in blood can be associated with - Inflammatory, lipid and glucose metabolism genes - metabolic syndromes (obesity, visceral adipose tissue, coronary malfunction...)

40 Thank you!