Figure S1. Phenotypic characterization of AND-1_WASKO cell lines. AND- 1_WASKO_C1.1 (WASKO_C1.1) and AND-1_WASKO_C1.2 (WASKO_C1.
|
|
|
- Dwain Powell
- 5 years ago
- Views:
Transcription
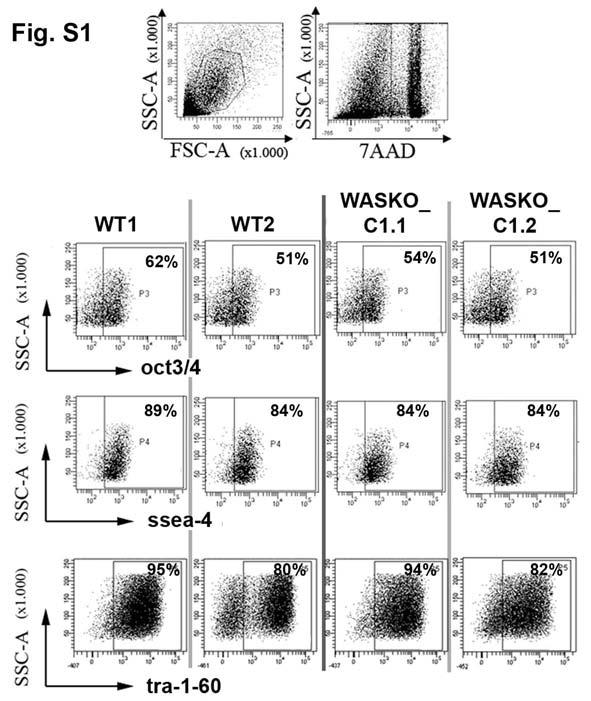
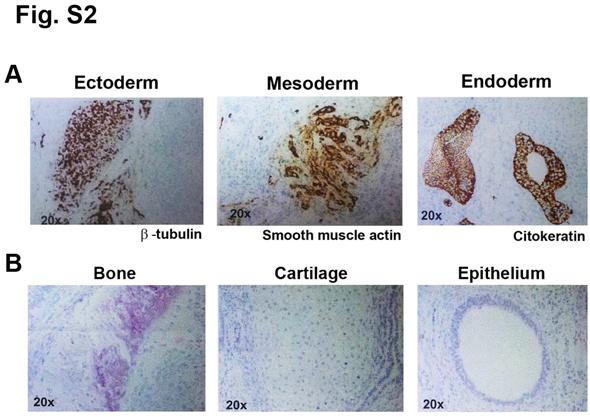
1 LEGENDS TO SUPPLEMENTARY FIGURES Figure S1. Phenotypic characterization of AND-1_WASKO cell lines. AND- 1_WASKO_C1.1 (WASKO_C1.1) and AND-1_WASKO_C1.2 (WASKO_C1.2) were stained with the antibodies oct3/4 (BD Pharmingen), ssea-4 and tra-1-60 (ebiosciences). Live cells were identified by 7-AAD viability dye exclusion. Top panels indicate the double gated population used for analysis of the different markers; FSC/SSC gated population (left) and 7AAD-negative (right). Samples were acquired and analyzed in a FACS Canto II flow cytometer equipped with the FACS Diva analysis software (Becton Dickinson, Franklin Lakes, NJ). Numbers at the right-top corner of each plot represent the percentage of positive cells related to the isotype control. Figure S2. AND-1_WASKO_C1.1 generates normal teratomas in an immunodeficient mice model. Histological analysis of teratomas developed in NOD/SCID-IL2R -/- mice 8 10 weeks after inoculation of AND-1_WASKO_C1.1 cells under the testicular capsule. A) Immunostainning of tissue sections for markers of the ectoderm (left panel; -tubulin), mesoderm (middle panel; smoth muscle actin) and endoderm (right panels; cytokeratin) B) Hematoxylin/eosin staining of teratomas sections showing structures typical of bone, cartilage and epithelium. These studies were performed at Biobanco of Andalucia ( Figure S3. Karyotype of hescs used. The hesc line used to obtain the WASKO hescs lines was AND-1_WT1 (30) (AND-1; Spanish Stem Cell Bank. AND-1_WT2 was derived by dilution of AND-1_WT1 and collection of individual 1
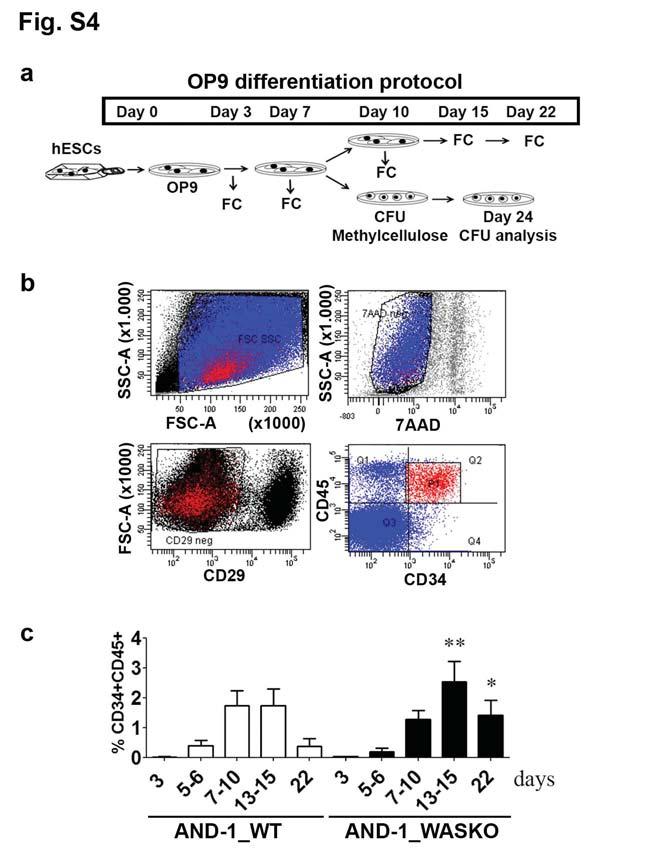
2 colonies without any further manipulation. AND-1_WASKO_C1.1 and AND- 1_WASKO_C1.2 were generated as described and M&M. A representative G-banding analysis of metaphase spreads per hescs line was performed at Biobanco of Andalucia ( The result of the study showed no additional alterations compared with the original AND-1_WT1 line from passage 10. This hesc line presents an abnormal karyotype with the loss of a chromosome 7 and an isochromosome gain corresponding to the p arm of this chromosome. Figure S4. hescs hematopoietic differentiation in OP9 co-culture system. (a) Scheme depicting the protocol for hematopoietic differentiation using OP9 system. Hematopoietic differentiation was induced by transferring the hescs lines onto OP9 feeders for at least 15 days. To evaluate hematopoietic differentiation at the different days, cells collected from the supernatant were resuspend in PBS1x +3%FBS+ 2mM EDTA buffer, filtered through a 70- m cell strainer (BD Biosciences, Bedford, MA) and stained with anti-mouse CD29-FITC (AbD Serotec, Raleigh, GBK), anti-human CD34-PE-Cy7 and anti-human CD45-APC (all from ebiosciences, San Diego, CA). Hematopoietic populations were analyzed by Flow Cytometry (FC) at different days of differentiation as indicated. (b) Plots showing the population analyzed to measure hematopoietic differentiation on the OP9 system. Cells were gated based on morphology (FSC/SSC; top-left), viability (7-AAD negative; Top-right) and excluding OP9 cells (CD29 negative; bottom-left). An example of CD34 and CD45 staining on this population is showed (bottom-right) (c) Analysis of the CD34 + CD45 + (Hematopoietic precursor cells) of AND-1_WT and AND-1_WASKO cells at different time points during the hematopoietic differentiation process. Data are average of at least 2
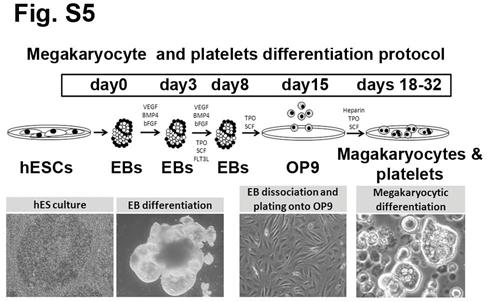
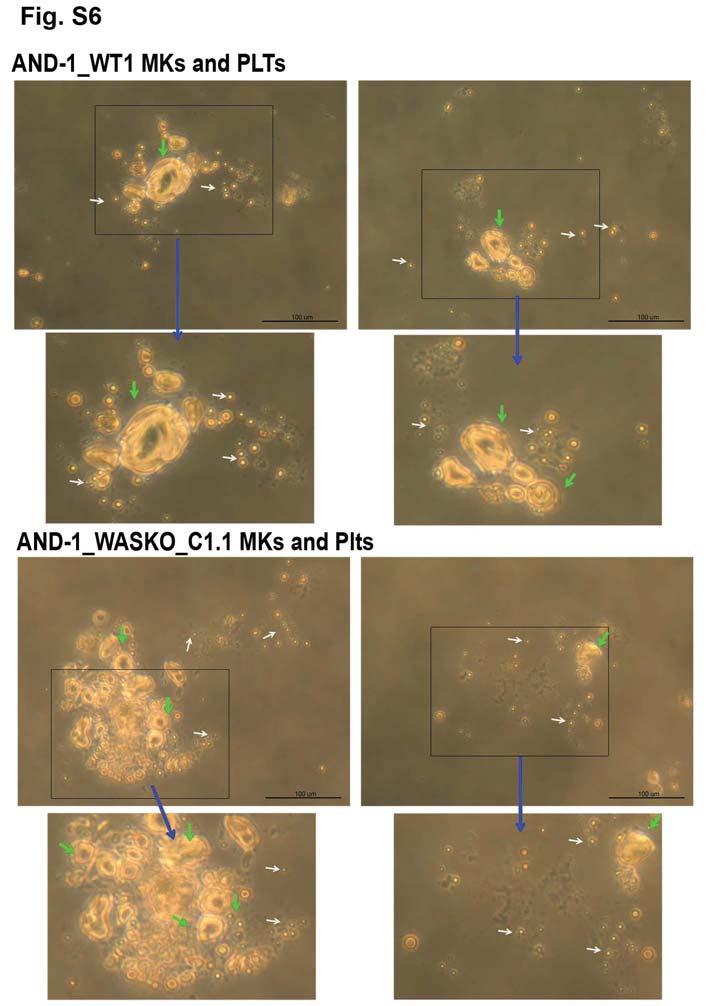
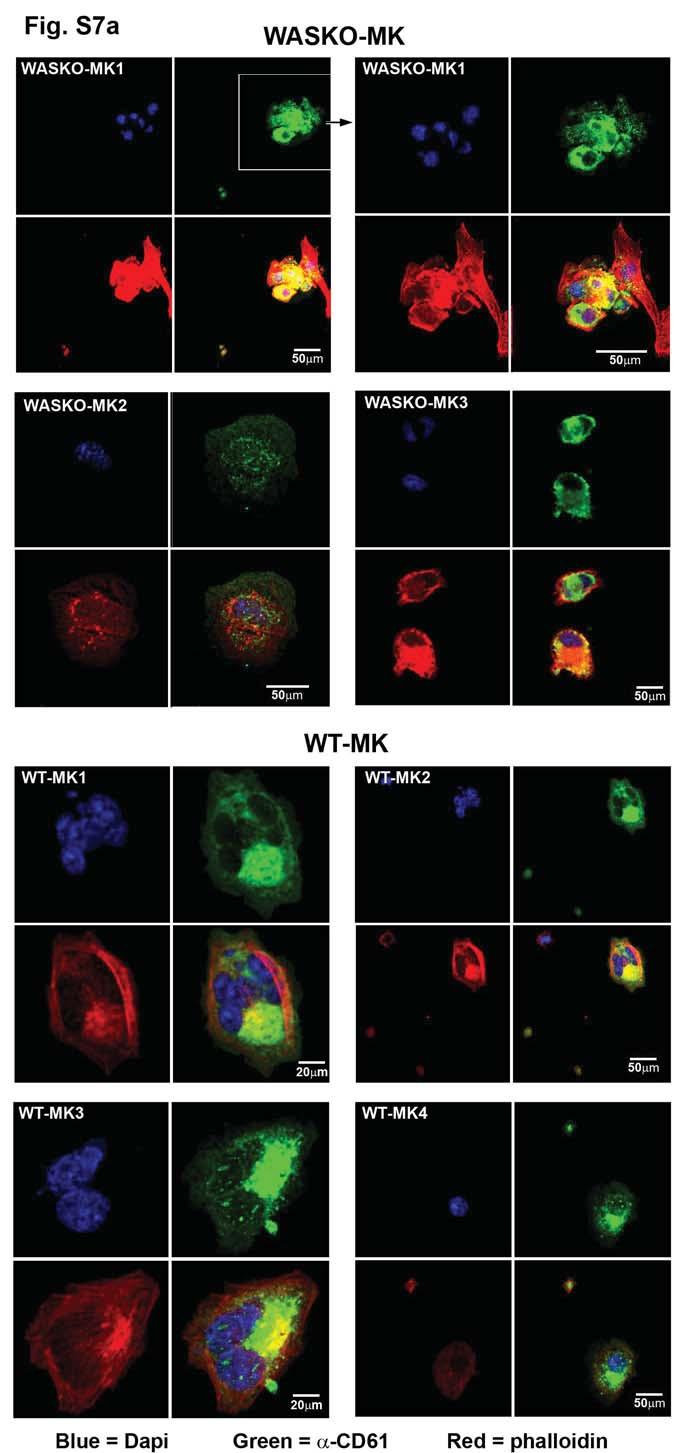
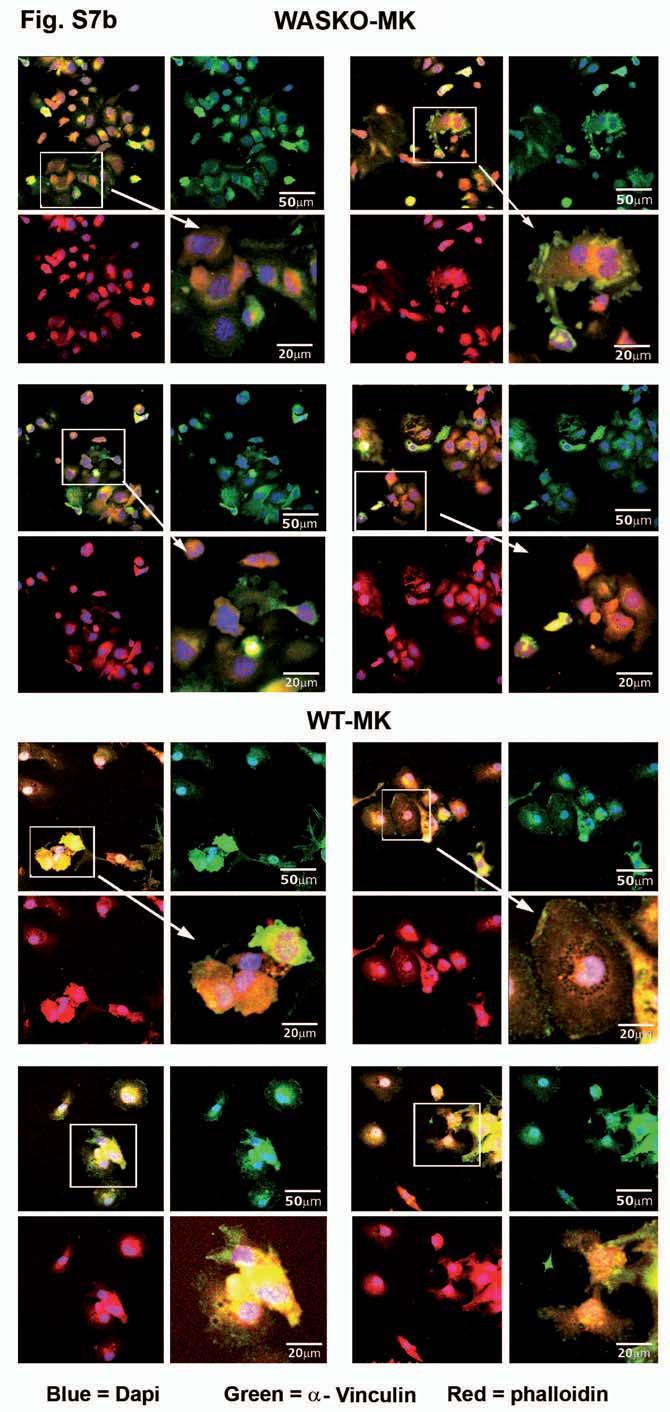
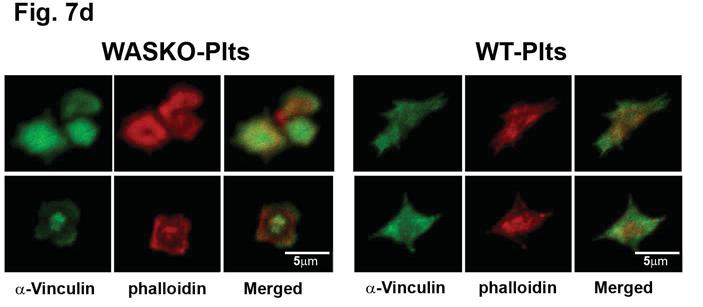
3 8 separate experiments using two AND-1_WT cell lines (AND-1_WT1 and AND- 1_WT2) and two AND-1_WASKO (AND-1_WASKO_c1.1 and AND-1_WASKO c1.2). * p<0.05; ** p< Significance related to same day on AND-1_WT Figure S5. Scheme of megakaryocytic differentiation of hescs. This differentiation protocol is based in Lu S. J., et al (34) and is divided in two stages: an EB differentiation stage (from day 0 to 15) in the presence of human cytokines and an OP9 co-culture differentiation stage (from day 15 to 32) were dissociated EB cells are cultured over OP9 stromal cells supplemented with heparin, human TPO and human SCF (see Supplementary M&M for detail). Figure S6. MKs and Plts derived from hescs. Day 20 megakaryocytic cultures from AND-1_WT (top) and AND-1_WASKO (bottom) were photographed on the tissue culture plates with a microscope Primo Vert (Carl Zeiss). The photographs show the Plts-like structures released from the MKs. MKs are in suspension in the supernatant of the co-culture (dissociated EBs and OP9 cells). MKs- (green arrows) and Plts (White arrows)-like structures are indicated. Areas containing MK and Plts are magnified for visualization of Plts (Blue arrow). Figure S7. Characterization of MKs and Plts derived from hescs. (a) AND-1_WT and AND-1_WASKO cells at day 20 of the megakaryocytic cultures were bound to fibrinogen coated slides, activated with thrombin and immune-stained with Dapi (Blue), Phalloidin (red) and CD61 (green). Three (WASKO-MK1 to WASKO-MK3) or four (WT-MK1 to WT-MK4) different MKs are shown. A Merge image is shown at the right-bottom of each set. (b) AND-1_WT and AND-1_WASKO cells were treated as 3
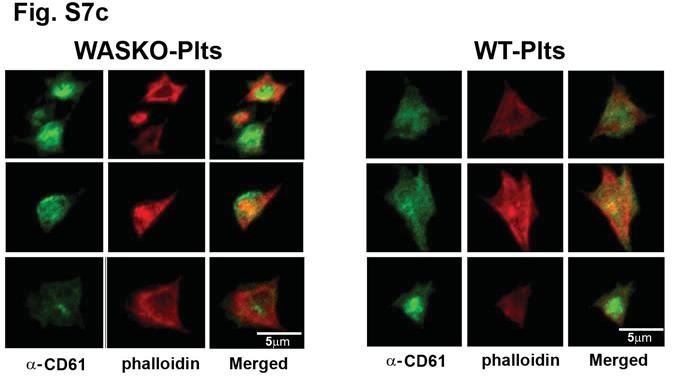
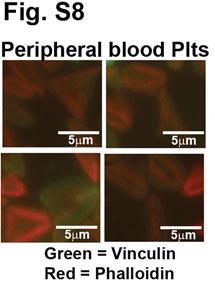
4 above and immune-stained with Dapi (Blue), Phalloidin (red) and anti-vinculin (green). Low magnification images of WASKO-MK (top) and WT-MKs (bottom) are shown. A merged image is shown at the top-left corner of each set and a higher magnification image (represented by the white square and white arrow) is shown in the right-bottom corner. (c) Plts derived from AND-1_WASKO (left panels) AND-1_WT (right panels) at day 20 of the megakaryocytic cultures were bound to fibrinogen coated slides, activated with thrombin and immune-stained with CD61 (green) and Phalloidin (red). A Merge image is shown at the right of each set. (d) Plts derived from AND-1_WASKO (left panels) AND-1_WT (right panels) at day 20 of the megakaryocytic cultures were treated as above and immune-stained with anti-vinculin (green) and Phalloidin (red). A Merge image is shown at the right of each set. Confocal images were capture with a confocal microscope Zeiss LSM 880 Figure S8. Characterization of Plts from Peripheral blood. Ptls obtained from a healthy donor were bound to fibrinogen coated slides, activated with ADP and immunestained with Phalloidin (red)/vinculin(green). The panels show typical trapezoidal morphology of activated Plts that are positive for vinculin and f-actin. Figure S9. AND-1_WASKO cells produce higher number of MKs and Plts. The graph shows the adding up of CD41 + CD42 + MKs and Plts produced by AND-1_WT (White bars) and AND-1_WASKO (Black bars) lines during all the collection days of the differentiation protocol from a 9.5cm2 well (from a 6-well plate). Data represent average ± SD of three separate experiments. * p<0.05; ** p<
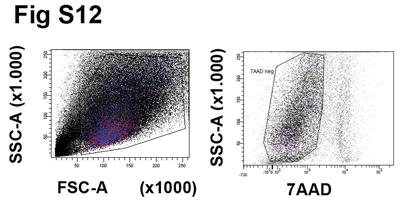
5 Figure S10. WASKO-MKs had increased basal levels of PAC-1 binding. Plots represent PAC-1 mean fluorescence intensity (MFI) on CD41 + -gated MKs (left) and Plts (right) derived from AND-1_WT (white bars) and AND-1_WASKO (black bars) cells measured before activation. Data are average of at least three separate experiments +/- standard deviation. * p<0.05. Figure S11. WW-puro LVs Transduced AND-1_WASKO cell express WAS. AND- 1_WASKO cells were transduced with the WW-puro vector and selected with puromycine to generate WASKO_WW-1 and WASKO_WW-2 cell lines. mrna from undifferentiated (white bars) or day 22 EB-differentiated AND-1_WT, AND- 1_WASKO and AND-1_WASKO_WW cells were isolated and analyzed by q-rt-pcr. The graph shows the relative quantity (2- Ct ) of WAS mrna levels using undifferentiated AND-1 cells as calibrator and GAPDH to normalize the different sample. Figure S12. Plots showing the population analyzed to measure hematopoietic differentiation on the EB system. Cells were gated based on morphology (FSC/SSC; left plot) and viability (7-AAD negative; right plot) 5
6 SUPPLEMENTARY TABLE Table S1 Primer name Sequence Accession number Location WASF1 5 -AAGCACTCACGATAGGCGTGG- 3 NG_ WASR1 5 -AAGTTCAGGTCAGGGGATTGTGG- 3 NG_ NeoF1 5 - TGCTCCTGCCGAGAAAGTAT- 3 KJ F-WAS 5 -AGGCTGTGCGGCAGGAGAT- 3 NM_ E9 R-WAS 5 -CAGTGGACCAGAACGACCCTTG- 3 NM_ E10 F-CD45 5 -CCCCCACTGGATTGACTACAG-3 NM_ E2 R-CD45 5 -GGTGCTTGCGGGTGAGAAT- 3 NM_ E2 F-CD41a 5 -TGAGCCGCATTTACGTGGAAA- 3 NM_ E4 R-CD41a 5 -CTTCACAGTAACGCTTGTCCC- 3 NM_ E5 F-CD61 5 -GTGACCTGAAGGAGAATCTGC- 3 NM_ R-CD61 5 -TCACTCACTGGGAACTCGATG- 3 NM_ E3 F-NFE2 5 - GCAGGAACAGGGTGATACAGC- 3 NM_ E2 R- NFE2 5 -GAGCAGGGGCAGTAAGTTGT- 3 NM_ E3 F-GATA1 5 - TCACTCCCTGTCCCCAATAG- 3 NM_ E3 R-GATA1 5 - GGAGAGTTCCACGAAGCTT- 3 NM_ E3 F-SCL 5 - GGATGCCTTCCCTATGTTCA- 3 NM_ E5 R-SCL 5 - GGTGTGGGGACCATCAGTAA- 3 NM_ E6 F-CD TGGACCGCGCTTTGCT- 3 NM_ E1 R-CD CCCTGGGTAGGTAACTCTGGG- 3 NM_ E2 R-FOG1 5 -CTGTCCTTCCAGCTCCTTGG- 3 NM_ E3 F-RUNX1 5 - CCGAGAACCTCGAAGACATC- 3 NC_ E5 R-RUNX1 5 - GCTGACCCTCATGGCTGT- 3 NC_ E6 F-FLI1 5 - CCAACGAGAGGAGAGTCATCG- 3 NM_ E4 R-FLI1 5 - TTCCGTGTTGTAGAGGGTGGT- 3 NM_ E5 E3 F-GAPDH 5 -ATGGGGAAGGTGAAGGTCG- 3 R-GAPDH 5 -GGGGTCATTGATGGCAACAATA- 3 NM_ NM_ E2 E3 6
7 7
8
9
10
11
12
13
14
15
16
17
18
19
20
21
22