Infections & Inflammation Molecular Imaging in Pharmaceutical Research
|
|
|
- Jonah Fields
- 5 years ago
- Views:
Transcription


1 Infections & Inflammation Molecular Imaging in Pharmaceutical Research 1 st Faculty of Medicine, Charles University in Prague
2
3

4 Drug Development Process William JK et al., Nature Reviews 2008:7;

5 Imaging Modalities Dedicated for Small Laboratory Animals Optical imaging PET imaging Magnetic resonance imaging SPECT imaging Ultrasound imaging CT imaging
6 In vivo biomedical imaging technologies Anatomic Physiologic Metabolic Molecular optical imaging x-ray CT PET/SPECT MRI/MPI ultrasound

7 Spatial Resolution Comparison of Clinical and Preclinical Imaging Modalities Fabian Kiessling and Bernd J. Pichler. Small Animal imaging Basics and Practical Guide. ISBN:


8 Small Animal Imaging Requirements High spatial resolution - mouse organs ~1000-fold smaller volume than human High sensitivity - number of targets also smaller, radiation dosimetry can be limiting

9 Molecular Imaging The Big Picture Early Microscope


10 Molecular Imaging Pharmaceutical R&D
11 Molecular Imaging Pharmaceutical R&D In vivo biological characterization Pharmacokinetics measurements Imaging biomarkers in clinical trials Prediction of treatment response Improve drug development successes Discovery of novel diagnostic imaging agents Improved diagnostics Improved patient outcomes Individualized treatment plans Identification of appropriate therapies Enhancement of resource utilization saving money

12 Pharmaceutical R&D
13 Ideal Tracer for Protein Synthesis? Pathway independent transport Uptake regulated by ribosomal activity (Metabolic Trapping) Ribosome entry independent from RNA-sequence and co-factors
14 Biotin-Puromycin-Oligonucleotide Pathway independent transport AMP transporter (permanently active in living cells) Uptake regulated by ribosomal activity Bidirectional transport steady state without incorporation Ribosome entry independent from RNA-sequence No co-factors needed for coordination in ribosome A-site
15 OPTICAL IMAGING SYSTEMS IN-VIVO MS FX PRO front-illuminated 4 MP CCD 18 F, 90 Y, 99m Tc QC settings: itlc analysis Cell culture simulation on 12-wellplates In vivo imaging of 90 Y mab in mouse

16 OPTICAL IMAGING SYSTEMS IN-VIVO EXTREME back-illuminated 4 MP CCD 18 F, 90 Y, 99m Tc QC settings: itlc analysis Cell culture simulation on 12-wellplates In vivo imaging of 90 Y mab in mouse


17 SPATIAL RESOLUTION RADIOISOTOPIC PHOSPHOR SCREEN Derenzo Phantom 20 MBq 90Y Exposure: 15 sec Radio-Isotopic Phosphor Screen 15 sec exposure Cerenkov Imaging 5 sec exposure


18 QUALITY CONTROL ITLC A B
19 68 GA-LABELING OF DOTA-PUR 68 Ga in 0.2 M HCl HEPES 1M, ph = 3,0 110 C, 20 min Purification on StrataX 68 Ga
 68 Ga-DOTA-Pur 68 Ga-DTPA 68 Ga for injection EtOH was removed at 95 C in stream of air and the dried product resolved in 0,5M PBS (ph = 6,8) Specific activity of [ 68")
20 68 GA-LABELING OF DOTA-PUR RM was purified on Strata X-columns following the protocol for purification of 68 Ga-DOTATOC (over all yield 93±2.8%) 68 Ga-DOTA-Pur 68 Ga-DTPA 68 Ga for injection EtOH was removed at 95 C in stream of air and the dried product resolved in 0,5M PBS (ph = 6,8) Specific activity of [ 68 Ga]-DOTA-Pur : 1.5±0.1 GBq/µmol
21 In vitro uptake and protein incorporation Uptake in tumor cells (DU145) after 2 hours 2.0 ± 0.1% applied dose per cells Uptake in normal skin fibroblasts (BJ) 0.2 ± 0.1% applied dose per cells Tumor / Normal cells = 10:1 Protein incorporation in both cell lines was 93% of Uptake
22 Inhibition of [ 68 Ga]-DOTA-Pur incorporation into proteins Competitive Inhibition: (Competition for ribosomal A-site) Puromycin dihydrochloride 10pmol/well and 20 nmol/well + 84 pmol/well of [ 68 Ga]-DOTA-Pur Non-competitive Inhibition: (blocking translational elomgation) Cycloheximide 10pmol/well and 20 nmol/well + 84 pmol/well of [ 68 Ga]-DOTA-Pur Cycloheximide: 3-[2-(3,5-dimethyl-2-oxocyclohexyl)-2-hydroxyethyl] glutarimide

23 SENSITIVITY LOW ACTIVITY CELL CULTURE 5.5 kbq to 88 kbq; exposure 120 sec; correlation between in-vivo MS FX Pro & dose calibrator (IC)

24 SENSITIVITY INTERMEDIATE AKTIVITY EX VIVO DIAGNOSTICS 5.5 kbq to 528 kbq; exposure 10 sec; correlation between in-vivo MS FX Pro & dose calibrator (IC)


25 SENSITIVITY HIGH AKTIVITY IN VIVO DIAGNOSTICS 440 kbq to 33 MBq; exposure 5 sec; correlation between in-vivo MS FX Pro & dose calibrator (IC)


26 IN-VIVO SCREENING 90 Y-DOTA-hR3; 25MBq; 24h p.i. Suppine position; 5 min exposure; 1% isoflurane prone position; 5 min exposure; 1% isoflurane

27 Pharmaceutical R&D Most efficient and cost effective method in assessment of pharmacokinetic data for new compounds dynamic PET accquisition followed by quantitative image analysis and Kinetic Modelling
28 Positron Emission Tomography in vivo PET imaging Tomographic imaging modality Functional information Non-invasive High sensitivity pmol Short lived radioisotopes Large variety of labeled compounds Energy metabolism (FDG) Amino acid metabolism ( 18 F and 11 C labeled AA) Protein biosynthesis (DOTA conjugated puromycin analogues) Neurotransmitter Receptor imaging (neuro, onco, ) Hemodynamic parameters Gene expression Cell tracking (stem cells) mm spacial resolution 6-10 % sensitivity temporal resolution < 0.5 sec QUANTIFIABLE

29 Positron Emission Tomography Temporal resolution Consecutive 0.3-s frames show passage of tracer bolus through RV cavity, lungs, and LV chamber of mouse on coronal and transverse slices. Times are those after start of image acquisition / injection. For better anatomic orientation, PET scan is overlaid with coregistered CT scan. Michael C. Kreissl et al. J Nucl Med 2006;47:
30 Dynamic PET Image Parametric Image Results Regional TACs Dynamic PET Scan Steps of Analysis + MRI/CT + Blood Data Drawing ROI Modelling Drawing ROI Modelling + Blood Data + MRI/CT SPM
31 Dynamic PET Scan Time Activity (concentration) Curves (TACs) TAC of tracer concentration in arterial blood Concentration of authentic tracer (kbq/ml) Time (min) Tissue characteristics: Perfusion Endothelial permeability Vascular volume fraction Transport across cell membranes Specific binding to receptors Non-specific binding Enzyme activity Concentration in tissue (kbq/ml) TAC of concentration in tissue measured by PET scanner Time (min)
32 µpet-imaging in tumor bearing rats Focus 120 small animal PET (Siemens/Concorde) Anaesthetized (3% Isoflurane in oxygen) animals ( g body weight) were placed tail first supine in the field of view MBq of [ 68 Ga]-DOTA-puromycin in ml 0.9% NaCl-solution via tail vein TAC: varying time frames (1-5 min), measuring interval 45 minutes, PET list-mode, histogrammed in 12 frames for reconstruction
 (3-20 min, dynamic scan) of Walker carcinomas on hind feet of CD rats")
33 µpet-imaging in tumor bearing rats Summarized µpet-image, coronal slice, colors expressed as SUV (0-9) (3-20 min, dynamic scan) of AT1 tumors on hind feet of Copenhagen Summarized µpet-image, coronal slice, colors expressed as SUV (0-12) (3-20 min, dynamic scan) of Walker carcinomas on hind feet of CD rats and
34 µpet-imaging in tumor bearing rats T/N = 45:1 T/N = 33: min TAC s of tumor and testis (reference) of AT1 tumor on hind feet of Copenhagen rats; steady state reached after approximately 65 minutes Walker Carcinoma: Obtained TAC looks like cell uptake and slow wash out caused by retention of the [ 68 Ga]-DOTA-Pur as aa-trna-analogon within eukaryotic ribosomal A-site.
35 Parametric Image Dynamic information is converted to functional information with dedicated software Not a series of scans (smaller file size) image voxel value = the value of the studied physiological parameter (perfusion, glucose consumption, receptor density) More sophisticated analyses possible requires careful evaluation of alternative models before choosing the right model
36 PET quantification Radioactivity concentration (tissue or plasma) can be easily converted to drug concentration: drug concentration = radioactivity concentration [ kbq / cm specific radioactivity [ GBq / mol] 3 ] Drug concentration is used to measure tissue function in vivo: e.g. perfusion, glucose consumption, receptor density, enzyme activity, etc.
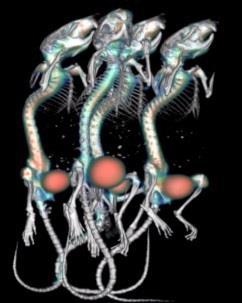
37 µpet/mri & SPECT/CT 68 Ga-DOTA-Pur 20 minutes static PET images of BCG infected (3 months prior to study) mice were acquired from 30 to 50 minutes after i.v. bolus injection of 5 to 8 MBq 68 Ga-DOTA-Pur followed by a spoiled GRE 3D MRI sequence 18 FDG 20 minutes static PET images from 40 to 60 minutes after i.v. bolus injection of 5 to 8 MBq 18 FDG followed by a spoiled GRE 3D MRI sequence 67 Ga-Citrate 24 h post injection multiple pinhole SPECT followed by a high resolution CT
 BCG infection in armpit; B)")
38 18 FDG PET/MRI B B A A A 18 FDG µpet/mri of BCG infected mouse; A) BCG infection in armpit; B) prefunded heart

 healthy; B) BCG")
39 67 Ga Citrate SPECT/CT A B 67 Ga-citrate SPECT/CT of healthy and BCG infected mouse; A) healthy; B) BCG infected
40 68 Ga DOTA-Pur PET/MRI 68 Ga-DOTA-Pur µpet/mri of BCG infected mouse; A) BCG infection in armpit; B) prefunded heart; C) BCG foci in liver
41 Histology Stainings: Ziehl-Neelsen for BCG; H&E for inflammation Granulomae were found near vessel walls in the armpit & inflammation at vessel walls in BCG infected area and lymph nodes correlating with 18 FDG uptake systemic mycobacteriosis was seen without inflammation in spleen and liver (single granulomae in liver) correlating with 68 Ga-DOTA-Pur uptake Spearman's correlation test p<0.089 for 68 Ga-DOTA-Pur and ZN level p>0.2 for 18 FDG and ZN level
42 Summary Molecular imaging modalities can be utilized during all steps of radiopharmaceutical development Implementation of alternative visualization techniques can save time and material Advanced analysis of dynamic PET scans enables absolute quantification of biochemical processes in various tissues Compared to ex vivo analysis advanced dynamic PET imaging saves up to 80% of animals and reduces lab-time to less than 15% Implementation of molecular imaging in (radio)pharmaceutical R&D ultimately saves time and money and delivers translational data for planning and conducting of clinical trials

43 ACKNOWLEDGEMENTS Bruker Molecular Imaging Dr. Jens Waldeck CROmed Research and Services Ltd., Budapest Dr. Domokos Mathé Notre Dame Integrated Imaging Facility Prof. Dr. W. Matthew Leevy Sarah Chapman NPI AS CR, Department of Radiopharmaceuticals Dr. Ondrej Lebeda Dr. Katerina Eigner Henke Academy of Sciences of the Czech Republic Grant M

44 THANK YOU FOR YOUR ATTENTION