Electrophoretic Mobility Shift Assay (EMSA). Nuclear extracts were. oligonucleotide spanning the NF-kB site (5 -GATCC-
|
|
|
- Cathleen Dalton
- 5 years ago
- Views:
Transcription
1 SUPPLEMENTARY MATERIALS AND METHODS Electrophoretic Mobility Shift Assay (EMSA). Nuclear extracts were prepared as previously described. (1) A [ 32 P] datp-labeled doublestranded oligonucleotide spanning the NF-kB site (5 -GATCC- AACGGCAGGGGAATTCCCCTCTCCTTA-3 ) was incubated with 5 μg of nuclear extract at room temperature for 20 min with 2 μg of poly(di-dc) in 50mM NaCl, 10mM Tris ph 7,5, 1mM DTT and 20% glycerol. Band shifts were resolved on non-denaturing 4% polyacrylamide gel. Immunoprecipitation and immunoblotting analysis of NFkB complex components Five-hundred μg of total protein extract from each sample were immunoprecipitated with antibodies against phospho-p65 (#3031, Cell Signaling Technologies, Beverly, MA) conjugated to A/G plus agarose (sc-8014, Santa Cruz Biotechnology, Santa Cruz, CA). For immunoblotting, proteins were resolved by 8% SDS-PAGE, and blotted onto nitrocellulose membrane. Blots were incubated with the antibodies against p65 (sc-8008, Santa Cruz Biotechnology) or p50 (sc-8414, Santa Cruz Biotechnology), followed by incubation with horseradish peroxidase-labeled goat anti-rabbit Ab (Amersham, Arlinghton Heights, IL) and developed with the ECL detection system (Amersham).
2 Evaluation of apoptosis. In a set of experiments, parental MOLT-3, GT or Jurkat cells, or their variants obtained by transduction with the different shrnas, were cultured in complete RPMI medium for 1 week after gene transfer. To measure the effects of SIEC cells on T-ALL viability under stress conditions, Jurkat cells were cultured for 48 h in the absence of serum followed by further 48 h of co-culture on SIEC cells. To measure apoptosis, cells were labelled with Annexin V-FITC in Hepes buffer containing propidium iodide (PI), using Annexin-V Fluos Staining Kit (Roche Diagnostics, Penzberg, Germany) and analysed on an EPICS-XL cytofluorimeter using Expo32 sotware (Coulter, Fullerton, CA). 2
3 REFERENCES 1. Bellavia D, Campese AF, Alesse E, et al. Constitutive activation of NF-kappaB and T-cell leukemia/lymphoma in Notch3 transgenic mice. EMBO J 2000;19:
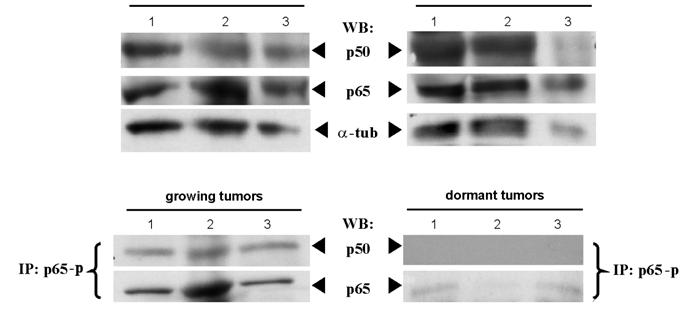
4 SUPPLEMENTARY FIGURES LEGENDS Supplementary Figure 1. Analysis of Dll4 expression in relationship to perfusion. 2, 5, and 14 days after MOLT-3-bFGF cells injection with Matrigel, tumors were analyzed by immunofluorescence. Left panel, representative pictures show Dll4 expression in tumors prior to perfusion. Right panel, quantification of Dll4 + cells in tumors (n=6 samples/group). Supplementary Figure 2. qpcr analysis of Notch1 and Notch3 expression in tumors (n = 6 samples/group). Supplementary Figure 3. Differential activation of the NF-kB pathway in growing compared to dormant tumors. A: EMSA of NF-kB complex in nuclear extracts from growing or dormant tumors. For competition (+ cold probe), 100-fold molar excess of cold NF-kB oligo was used. 4
5 B: Top panel, Western blot analysis of whole-cell extracts (50 μg) from tumor samples probed with anti-p50 and anti-p65 Abs. The α-tubulin was used as loading control. Bottom panel, total cell extracts from tumor samples (500 μg) were immunoprecipitated with anti-p65 phosphorylated Ab and revealed in Western blotting with anti-p50 and anti-p65 Abs. C: Expression of Bcl2-A1 and cyclin D1 transcripts in dormant and growing tumors by real-time PCR analysis (n = 3 samples / group). *, P < 0.05 compared to dormant tumor values. Supplementary Figure 4. Evaluation of tumor growth and dormancy. Kinetics of tumor formation by parental MICOL-14 or MICOL-14 tum cells in NOD/SCID mice (n = 6 mice / group). *, P < Supplementary Figure 5. Expression of Dll4, Dll1, Jag1, Jag2, Notch1 and Notch3 transcripts in murine EC. SIEC were cultivated for 48 h with or without addition of bfgf and VEGF (both used at 100 ng/ml) to the culture medium. PCR products were evaluated by electrophoresis on 1.5% agarose gels and ethidium bromide staining. β-actin amplification was used as a loading control; water was used as a negative control. 5
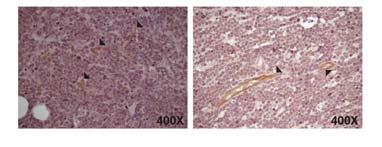
6 Supplementary Figure 6. Dll4 blockade impairs tumor growth. Digital imaging of EGFP+ MOLT-3 tumors treated or not with anti-dll4 mab. Supplementary Figure 7. Expression of Dll4 in T-cell lymphoblastic lymphoma samples. Immunoreactive cells are represented by endothelial cells of vessels contained in 3 distinct clinical samples; lymphoblasts scored as negative (magnification x1000 in the upper right panel, x400 in all other panels). 6
7 Suppl. figure 1 7
8 Suppl. figure 2 8

9 Suppl. figure 3 9
10 Suppl. figure 4 10

11 Suppl. figure 5 11
12 Suppl. figure 6 12

13 Suppl. figure 7 13
14 Supplementary table I: primers used for PCR analysis Gene Primer Sequence Size (bp) β-actin For ACCATTGGCAATGAGCGGTT 338 Rev TCCTGCTTGCTGATCCACAT β2-microglobulin* For TGCTGTCTCCATGTTTGATGTATCT 86 Rev TCTCTGCTCCCCACCTCTAAGT murine GAPDH * For CTGGAGAAACCTGCCAAGTA 196 Rev ACCAGGAAATGAGCTTGAGAAA Notch1* For CGCTGCACAGTAGCCTTGCT 171 Rev GCTGCTGCTGGATGTTTGCT murine Notch1 For GTGCTGGAATGTGGGTGGAG 299 Rev GACTTGGTGGGCAGCAGATG Notch3* For CAAGGGTGAGAGCCTGATGG 131 Rev GAGTCCACTGACGGCAATCC murine Notch3 For ATGCTGGCCTCCTTCTGTGG 231 Rev ATGATCCTGGGCGTTGGTGT ptα* For ATGGTGGTGGTCTGCCTGGT 139 Rev AGTTGGTCCAGGTGCCATCC HES1* For GCTGGAGAAGGCGGACATTC 150 Rev AAGCGGGTCACCTCGTTCAT HEY1* For CATACGGCAGGAGGGAAAGG 144 Rev AACTCGAAGCGGGTCAGAGG HEY2* For GGCGTCGGGATCGGATAAAT 172 Rev GCGTGTGCGTCAAAGTAGCC murine DLL4 For TCCTGCCTCCAACCCCAGTA 302 Rev CGGCTTCAAGGTTGGTCTCG murine DLL4* For CCCACAATGGCTGTCGTCAT 159 Rev AACCCTTTGGCCCACTGTTG murine DLL1 For TGGTGCTTGTCCTCCTGCTG 240 Rev AGCTGCTCTTCTCGGCTCCA murine Jag1 For GGCTTGGGTCTGTTGCTTGG 165 Rev ACCGTGTTGGCTCCGTGTTT murine Jag2 For GGGCGCTATCTGCTCTGGAA 165 Rev TGGATCAGGCTGCTGTCAGG *, primers used in quantitative PCR analysis experiments 14
15 15