Supplemental Table 1: Sequences of real time PCR primers. Primers were intronspanning
|
|
|
- Madlyn Ross
- 5 years ago
- Views:
Transcription
1 Symbol Accession Number Sense-primer (5-3 ) Antisense-primer (5-3 ) T a C ACTB NM_ CCAGAGGCGTACAGGGATAG CCAACCGCGAGAAGATGA 57 HSD3B2 NM_ CTTGGACAAGGCCTTCAGAC TCAAGTACAGTCAGCTTGGTCCT 60 CYP11B2 NM_ ACTCGCTGGGTCGCAATG AGTGTCTCCACCAGGAAGTGC 61 NR4A2 NM_ GCCTGGACTATTCCAGGTTC GCCAGTCAGGAGATCATAGA 59 STAR NM_ TACGTGGCTACTCAGCATCG GGACAGGACCTGGTTGATGA 60 CYP11A1 NM_ AGGAGGGGTGGACACGAC TTGCGTGCCATCTCATACA 59 CYP17A1 NM_ CTATGCTCATCCCCCACAAG CCTTGTCCACAGCAAACTCA 59 CYP21A2 NM_ TCATCATTCCGAACCTCCA GCTCCAGGAAGCGATCAG CYP11B1 NM_ GGCAGAGGCAGAGATGCTG TCTTGGGTTAGTGTCTCCACCTG 62 Supplemental Table 1: Sequences of real time PCR primers. Primers were intronspanning or intron-flanking. In the case of known splice variants, common assays were designed in order to quantify all variants at the same time. T a : annealing temperature used for real time PCR. 6
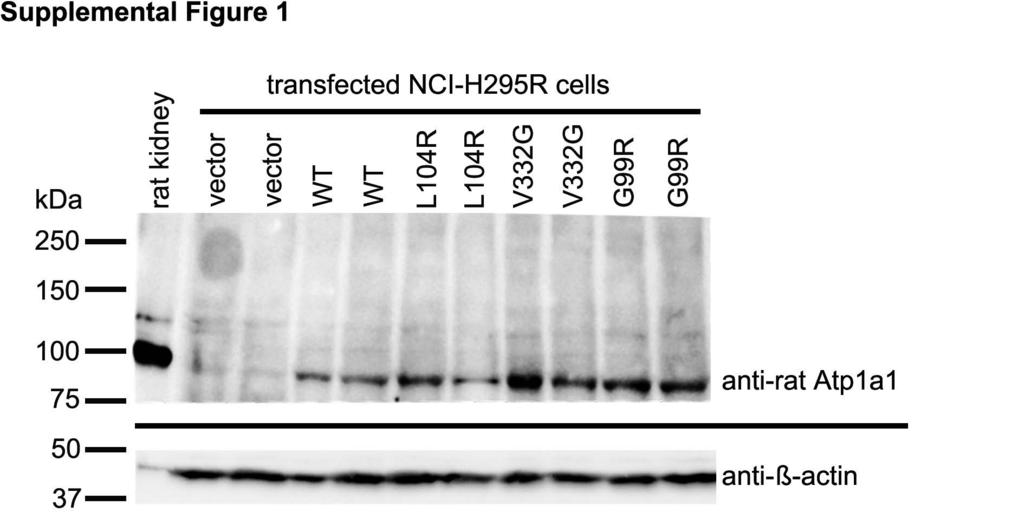
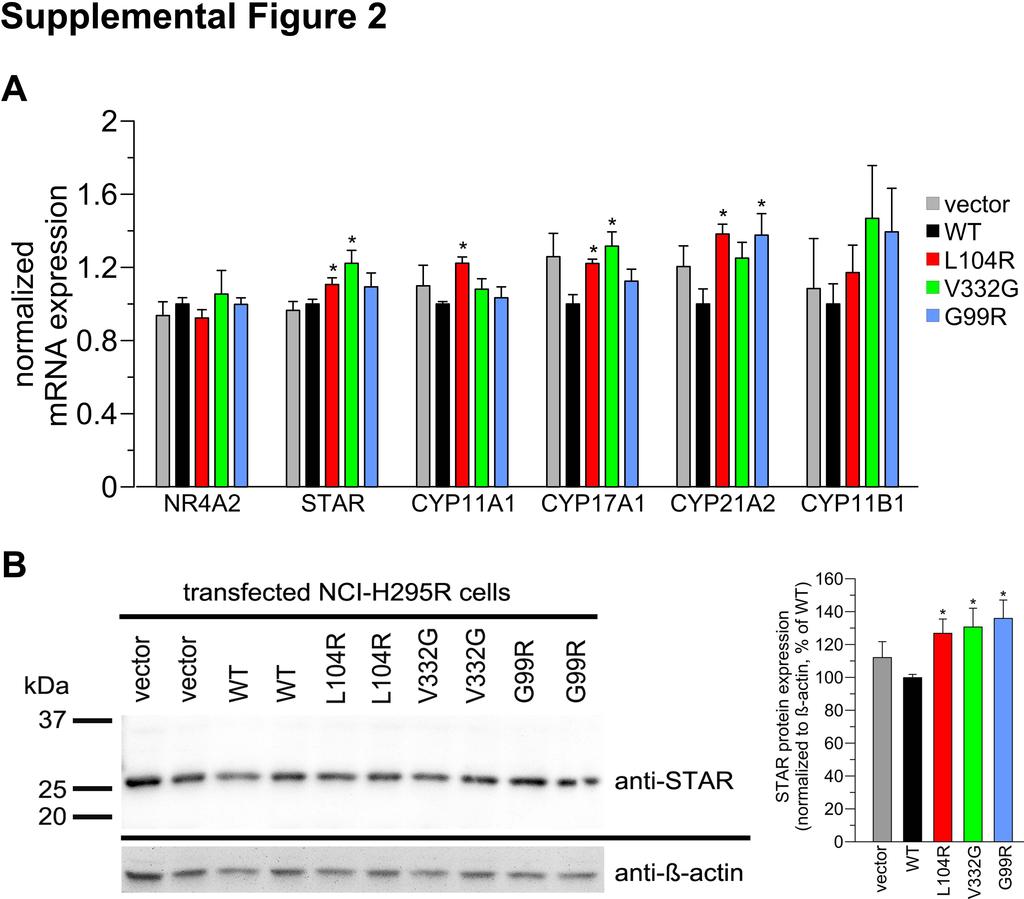
2 Supplemental Figure 1: Western blotting of NCI-H295R cell lysates 48 h after transfection with empty pires-cd8 vector, with wildtype (WT) rat Atp1a1, or with mutated rat Atp1a1 (L104R, V332G, G99R). A tissue lysate from rat kidney, which endogenously expresses rat Atp1a1, was used as a positive control. Cells were lysed in standard RIPA buffer containing protease inhibitors and mixed with reducing Laemmli buffer. Equal amounts of cell protein (200 µg per lane) and 30 µg protein from rat kidney lysate were separated by 8% SDS-PAGE and transferred to a PVDF membrane. The membrane was cut at the size of the 75 kda protein marker. The membrane parts were incubated over night at 4 C in primary antibody solution with 0.1% BSA and 0.02% NaN 3 in PBS-Tween either containing custom made specific anti-rat Atp1a1 antibody diluted 1:1000 (affinitypurified rabbit polyclonal, Pineda Antikörper-Service, Berlin, Germany) or anti-β-actin antibody diluted 1:500 (rabbit polyclonal, Sigma-Aldrich, Taufkirchen, Germany). After washing and incubation with HRP-conjugated secondary antibody (donkey anti rabbit, Santa Cruz Biotechnology, diluted 1:5000 in PBS-Tween with 1% non-fat milk), images were developed using luminol and visualized by a digital imaging system. Supplemental Figure 2: mrna expression of steroidogenic enzymes and factors, and protein expression of STAR (B) in NCI-H295R cells expressing wildtype (WT) or mutant (L104R, V332G, G99R) Na + /K + -ATPase, and in vector control cells. (A) Expression of mrna was measured by relative quantification using real time PCR and β-actin expression as reference. NR4A2 (nuclear receptor subfamily 4, group A, member 2; a major transcription factor activating CYP11B2 expression), STAR (steroidogenic acute regulatory protein; shuttles cholesterol from the outer to the inner mitochondrial membrane), CYP11A1 (cytochrome P450, family 11, subfamily A, polypeptide 1; catalyzes conversion of cholesterol in pregnenolone), CYP17A1 (cytochrome P450, family 17, subfamily A, polypeptide 1; needed for catalysis of cortisol and androgenes), CYP21A2 (cytochrome P450, family 21, subfamily A, polypeptide 2; catalyzes conversion of progesterone in 11-desoxycorticosterone), CYP11B1 (cytochrome P450, family 11, subfamily B, polypeptide 1; final enzyme catalyzing cortisol synthesis). Data are shown relative to the expression in wildtype cells (n=5-7 per
3 group). Asterisks indicate p<0.05 comparing wildtype with mutant expressing cells. (B) For western blot analysis of the STAR protein cells were lysed in standard RIPA buffer containing protease inhibitors and mixed with reducing Laemmli buffer 48h after electroporation. Equal amounts of cell protein (30 µg per lane) were separated by 12% SDS-PAGE and transferred to a PVDF membrane. The membrane was cut above the size of the 37 kda protein marker. The membrane parts were incubated over night at 4 C in primary antibody solution with 0.1% BSA and 0.02% NaN 3 in PBS- Tween either containing a anti-star antibody diluted 1:500 (rabbit polyclonal, Santa-Cruz Biotechnology, Heidelberg, Germany) or anti-β-actin antibody diluted 1:500 (rabbit polyclonal, Sigma-Aldrich, Taufkirchen, Germany). After washing and incubation with HRP-conjugated secondary antibody (donkey anti rabbit, Santa Cruz Biotechnology, diluted 1:5000 in PBS-Tween with 1% non-fat milk), images were developed using luminol and visualized by a digital imaging system. The band detected using the STAR antibody represents the active 30 kda form of the STAR protein, which is generated by cleavage of a 37 kda precursor during transport into mitochondria {Artemenko, /id}. Quantification of the STAR protein bands from this blot and from a second blot (not shown here), normalized to β-actin expression, is given on the right site (n=4-5 per group). Asterisks indicate p<0.05 comparing wildtype with mutant expressing cells. Supplemental Figure 3: Acidified cytosolic ph in adrenal NCI-H295R cells expressing mutant KCNJ5 L168R K + channel. Mean values of 495 nm/440 nm BCECF ratios ± SEM are shown as a measure of cytosolic ph. (A) Cells expressing L168R mutant KCNJ5 K + channel (KCNJ5 L168R, grey bar, n=13 from 5 dishes;) exhibited an acidified cytosolic ph under control condition, compared to wildtype KCNJ5 (KCNJ5 WT, black bar, n=18 from 6 dishes) expressing cells. (B) Cytosolic ph upon changing extracellular solution from ph 7.4 to ph 7 and ph 8. Cells acidified in an extracellular solution with ph 7 and alkalinized in a solution with ph 8. In contrast to the pronounced cytosolic ph shift of mutant Na + /K + -ATPase expressing cells in presence of extracellular ph 7 and ph 8 (Fig. 2B), the rates of cytosolic ph changes were not different comparing KCNJ5 WT and mutant KCNJ5 L168R expressing cells. (KCNJ5 WT : black line, n=13 from 5 dishes; KCNJ5 L168R : grey line, n=18 from 6 dishes). Asterisks indicate p<0.05 comparing wildtype with mutant expressing cells. Measurements
4 were carried out 24h after electroporation. The extracellular Ringer-type solution contained (mm): 140 NaCl, 1.8 MgCl 2, 1.8 CaCl 2, 10 HEPES, 5 KCl, ph 7.4. Plasmids containing cdna sequences of human wildtype or L168R mutant KCNJ5 were generate as described in Tauber et al. {Tauber, /id}. Supplemental Figure 4: Intracellular Na + and K + concentrations in NCI-H295R cells expressing wildtype (WT) or different mutant (L104R, V332G, G99R) Na + /K + -ATPase proteins under control condition (A) and after 1h treatment with 10 µm ouabain (B). Measurements were carried out 48h after transfection using flame photometry according to Tauber et al. {Tauber, /id}. The lower ouabain sensitivity of the rat Na + /K + -ATPase allowed testing the pump function of the transfected rat Na + /K + -ATPase, while blocking the endogenous human Na + /K + -ATPase. Without ouabain treatment (control condition with active endogenous human Na + /K + -ATPase), the expression of the L104R, V332G and G99R mutant rat Na + /K + -ATPase caused an increase of intracellular Na + and a decreased of K + (A). Upon ouabain treatment (10 µm for 1h), the expression of the L104R, V332G or G99R mutant Na + /K + -ATPase from rat did not compensate for inhibition of the endogenously expressed human Na + /K + -ATPase in NCI-H295R cells by ouabain, which led to strongly disturbed intracellular Na + and K + concentrations (B). By contrast, wildtype Na + /K + -ATPase overexpressing cells were able to compensate for ouabain treatment, albeit the compensation appeared to be incomplete, because of the low percentage of strongly transfected cells. Supplemental Figure 5: Membrane potential of HEK-293 cells expressing wildtype or V332G mutant Na + /K + -ATPase. Whole cell patch-clamp measurements were performed 48h after transfection using control or Na + free extracellular solution. V332G mutant expressing cells were depolarized under control (-17.8 ± 0.8 mv) compared to wildtype cells (-38.6 ± 2.5 mv). Removal of Na + (replaced by NMDG + ) slightly hyperpolarized wildtype cells (-47.9 ± 1.4 mv), but led to a strong hyperpolarization of V332G mutant cells (-44.2 ± 3.5 mv), indicating a Na + current to be causative for depolarization under control condition (n=10 per group). Extracellular and pipette solutions were
5 used as described for NCI-H295R cells in the main manuscript. Asterisks indicates p<0.05 comparing genotypes, number sign indicates p<0.05 comparing control and Na + free condition.
6
7
8
9
10