Conformational changes in IgE contribute to its. uniquely slow dissociation rate from receptor FcεRI
|
|
|
- Anabel Lang
- 5 years ago
- Views:
Transcription
1 Conformational changes in IgE contribute to its uniquely slow dissociation rate from receptor FcεRI M.D. Holdom, A.M. Davies, J.E. Nettleship, S.C. Bagby, B. Dhaliwal, E. Girardi, J. Hunt, H.J. Gould, A.J. Beavil, J.M. McDonnell, R.J. Owens & B.J. Sutton

2
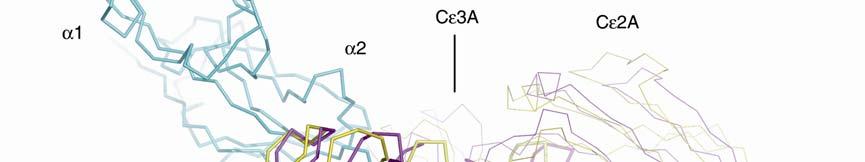
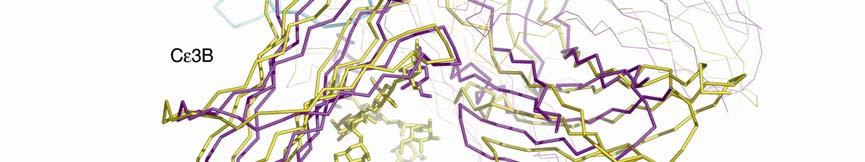
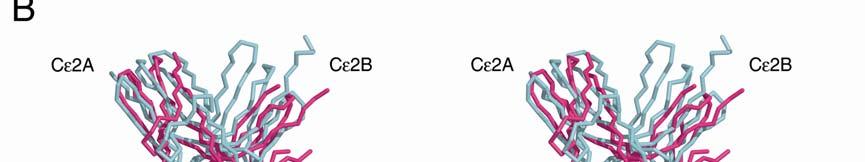
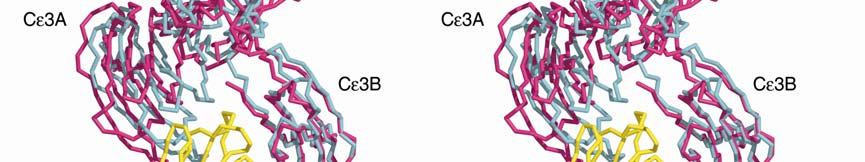
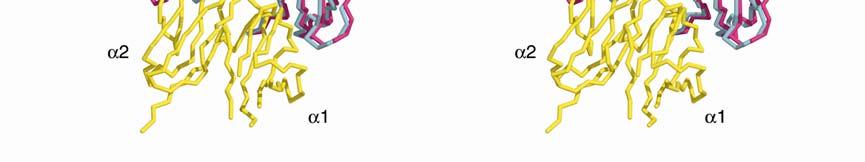
3 Supplementary Figure 1. (A) Conformational change between free IgE-Fc (yellow) and complexed (purple) with sfcεriα (blue). The figure was generated by superposing the Cε4 domain pair, and in both IgE-Fc structures, chain B is shown in thicker lines. Cε3B moves only slightly, whereas Cε3A (just visible at the back) and the two Cε2 domains move substantially as a rigid unit. If the (Cε4) 2 dimer is taken as a fixed point of reference between the free and bound IgE-Fc structures, the movement of the three domains (Cε3A, Cε2A and Cε2B) is a rotation of 4.5 about the local two-fold axis of the (Cε4) 2 pair, followed by a rotation of 8 towards this axis, leading to the more compact and bent structure. Carbohydrate is shown only for IgE-Fc. (B) Illustration of the conformational change in the Cε2 and Cε3 domains upon receptor binding (stereo pair). sfcεriα (yellow) and the Cε2 and Cε3 domains (pink) from the structure of the complex, together with the Cε2 and Cε3 domains of uncomplexed IgE-Fc (light blue), are superposed on the Cε3B domain. The conformational change in IgE-Fc consists of the three domains Cε2A, Cε2B and Cε3A moving as a rigid unit relative to the Cε3B and the two Cε4 domains (latter not shown).
 is the classical immunoglobulin fold as seen in the Cε2 domains of uncomplexed IgE-Fc, and on the right (pink) is the alternative conformation with the C strand instead of")
4 Supplementary Figure 2. Schematic illustration of a β-strand shift in both Cε2 domains upon complex formation. Shown on the left (blue) is the classical immunoglobulin fold as seen in the Cε2 domains of uncomplexed IgE-Fc, and on the right (pink) is the alternative conformation with the C strand instead of the D strand, as seen in both Cε2 domains of the complexed IgE-Fc structure. The two are superposed in the center panel. This structural change in the edge β-strand affects residues 272 to 281. The D strands in both Cε2 domains are involved in inter-molecular packing contacts in the free IgE-Fc crystal structure. The same conformation is observed in the NMR structure of isolated Cε2 in solution 10, suggesting that this is the preferred structure in the free molecule. In the complex, in Cε2B (with no crystal packing contacts), the D to C strand shift is stabilized by new intra-chain contacts made between the immediately preceding CC loop and residues of Cε3B. The strand shift appears to be promoted by the quaternary structural changes involved in receptor binding. The same strand shift occurs in Cε2A, but crystal packing contacts in the complex preclude a D strand location.
 and Fcε3-4/sFcεRIα complex (pink and light blue respectively), superposed on the receptor.")

5 Supplementary Figure 3. Stereo view of the Cα traces of the structures of the IgE-Fc/sFcεRIα complex (Cε3 and Cε4 domains only) and Fcε3-4/sFcεRIα complex (pink and light blue respectively), superposed on the receptor. The approximately 5º difference in the orientation of the antibody Fc domains relative to the receptor can be seen. N-linked carbohydrate chains in both the Fc and receptor are also shown in all-atom representation. In IgE-Fc only a single GlcNAc residue is visible on each chain; in Fcε3-4 14, (GlcNAc) 2 -(Man) 4 and (GlcNAc) 2 -(Man) 1 were observed. Of the seven potential N-glycosylation sites on the receptor in the IgE-Fc complex, three were removed by mutagenesis, and carbohydrate chains are visible at only two, Asn21 and Asn42, where (GlcNAc) 1 and (GlcNAc) 2 -(Man) 2 respectively were built; both are stabilized by crystal packing contacts. No density was visible at either of the two remaining sites, Asn50 and Asn166, where there are no such crystal packing contacts.
 for interface regions")
 Sub-site 1: the hydrophobic interactions of Trp130")
 and Arg334 (IgE-Fc, light blue")

 Sub-site 2: the proline sandwich in which Pro426")
6 Supplementary Figure 4. Electron density (stereo views) for interface regions of the complex. a) Sub-site 1: the hydrophobic interactions of Trp130 (sfcεriα, purple carbon atoms) and the salt bridge between Glu132 (sfcεriα) and Arg334 (IgE-Fc, light blue carbon atoms). Oxygen atoms are colored red, nitrogen atoms dark blue. Density is contoured at 1.0σ in this 2F obs F calc map. b) Sub-site 2: the proline sandwich in which Pro426 (IgE-Fc, in purple) is flanked by Trp87 and Trp110 (sfcεriα, in blue). Density is contoured at 1.0σ in this 2F obs F calc map.
7 Supplementary Figure 5. SPR sensorgrams of Fcε2-4 binding to sfcεriα wildtype at 25 o C. sfcεriα samples were immobilized through carbohydrate moieties via aldehyde coupling. The following range of analyte concentrations was injected at a flow rate of 25 μl min 1 : 250 nm (red), 125 nm (blue), 62.5 nm (green), nm (purple), nm (orange), 7.8 nm (magenta), and 3.9 nm (cyan). Concentrations were tested in duplicate using a low-to-high titration series, followed by a high-to-low series; the duplicate sensorgrams are shown for each concentration. Binding curves were fitted to a biphasic interaction model, as described previously 8 ; black lines indicate the global fits obtained for the binding and residuals of the fit for the highest concentration are shown as black circles below. The rate constants for the principal kinetic component are: k on = 1.1 x 10 5 M 1 s 1 ; k off = 1.5 x 10 4 s 1.
8 Supplementary Figure 6. SPR sensorgrams of Fcε2-4 binding to sfcεriα W87D at 25 o C. sfcεriα samples were immobilized through carbohydrate moieties via aldehyde coupling. The following range of analyte concentrations was injected at a flow rate of 25 μl min 1 : 250 nm (red), 125 nm (blue), 62.5 nm (green), nm (purple), nm (orange), 7.8 nm (magenta), and 3.9 nm (cyan). Concentrations were tested in duplicate using a low-to-high titration series, followed by a high-to-low series; the duplicate sensorgrams are shown for each concentration. Binding curves were fitted to a biphasic interaction model, as described previously 8 ; black lines indicate the global fits obtained for the binding and residuals of the fit for the highest concentration are shown as black circles below. The rate constants for the principal kinetic component are: k on = 5.9 x 10 4 M 1 s 1 ; k off = 5.3 x 10 4 s 1.
9 Supplementary Video 1: Overall structure of the IgE-Fc/sFcεRIα complex. This video shows the proposed orientation of the complex in relation to the cell membrane and highlights the acute bend in IgE-Fc, with the Cε2 domains packed against the Cε3 and Cε4 domains. The complex is rotated by 90 clockwise, 180 anti-clockwise, and 90 clockwise about an axis orthogonal to the cell membrane. IgE-Fc chains A and B are colored in green and purple respectively, and sfcεriα in yellow. Supplementary Video 2: Conformational change in IgE-Fc. This video demonstrates the conformational change that takes place in IgE-Fc upon sfcεriα binding. The video shows the same conformational change from four views, each 90 apart. The change is demonstrated by morphing the free structure of IgE-Fc into that of the receptor-bound form, and then back to the free form. IgE-Fc chains A and B are colored in green and purple, respectively. Supplementary Video 3: Conformational change in Cε2 and Cε3 domains on receptor binding. This video demonstrates the conformational change that takes place in IgE-Fc upon sfcεriα binding (with emphasis on the Cε2 domains), and shows how the Cε2A, Cε2B and Cε3A domains move together as a rigid unit. The video also shows the small conformational change within Cε3B. The free structure of IgE-Fc is first shown, and then morphed into the receptor-bound form. The receptor is briefly displayed, after which IgE-Fc is morphed back to the free form. IgE-Fc chains A and B are colored in green and purple respectively, and sfcεriα in yellow.