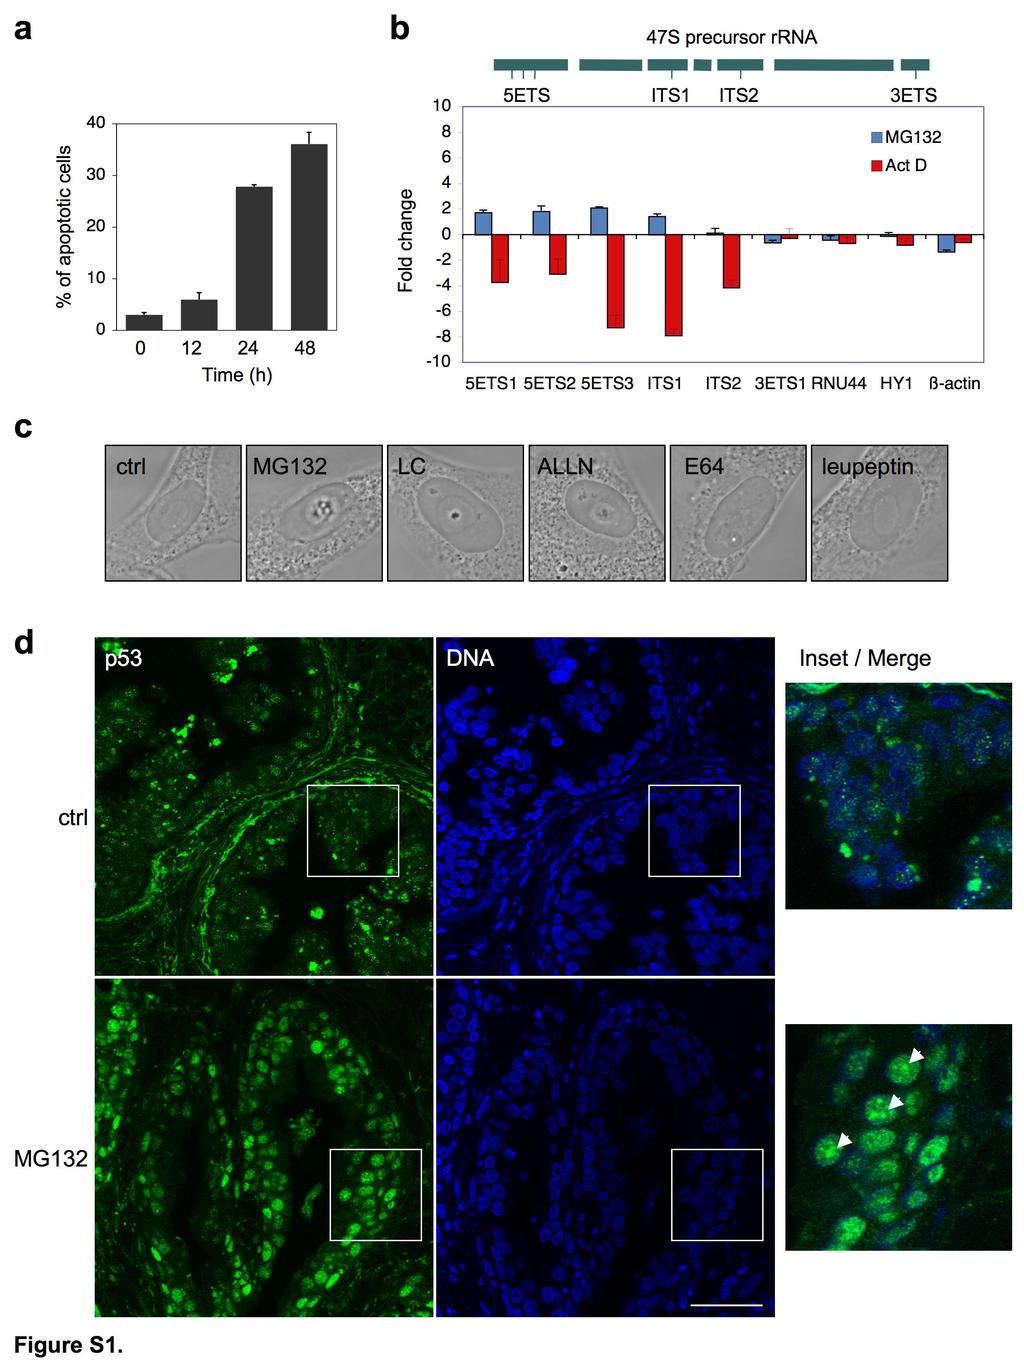
Figure S1 Proteasome inhibition leads to formation of aggregates in human cells and tissues. (a)
|
|
|
- Ursula Ellis
- 5 years ago
- Views:
Transcription
1 SUPPLEMENTARY MATERIAL Figure S1 Proteasome inhibition leads to formation of aggregates in human cells and tissues. (a) Flow cytometry. Cells were treated with MG132 for the indicated times. Cells were trypsinized, washed with PBS, fixed with cold 70% EtOH, and washed with PBS. RNA was digested with RNase A and DNA was stained with propidium iodide. Acquisition and analysis of events was carried out with LSR flow cytometer and CellQuest program (Becton Dickinson). Proportion of cells with sub-g1 DNA content was assessed. Means and standard deviations of three independent experiments are shown. (b) Quantitative RT-PCR of rrna synthesis. WS1 cells were treated with MG132 (10 µm) or act D (1 µm) for 12 h, after which total RNA was extracted using RNeasy kit. cdna was synthesized using SuperScript III Reverse Transcriptase (Invitrogen) and random hexamer primers. qpcr was performed using SYBR Green (Thermo Scientific, Rockford, USA) and specific primer pairs for precursor rrna (5ETS1 5 GCTGACACGCTGTCCTCTGG, 3 GAGAACGCCTGACACGCACG; 5ETS2, 5 CCTGCTGTTCTCTCGCGCGTCCGAG, 3 AACGCCTGACACGCACGGCACGGAG; 5ETS3, 5 CCGTGGTCTCTCGTCTTCTC, 3 CCACACGTCGCACGAAC; ITS1, 5 GTGGTGTGAAACCTTCCGAC, 3 TACGAGGTCGATTTGGCG; ITS2, 5 GTCCCCCTAAGCGCAGA, 3 GGCTCTCTCTTTCCCTCTCC; 3ETS, 5 GTCCTTCCGTTCGTCTTCCT, 3 CTCCCAAACCACGCTCC) and RNA polymerase II transcribed RNAs (RNU44, 5 CCTGGATGATGATAGCAAATGC, 3 GAGCTAATTAAGACCTTCATGTT; HY1, 5 GGCTGGTCCGAAGGTAGTGA, 3 GCAGTAGTGAGAAGGGGGGA). The data were normalized against 18S. All primers were ordered from Sigma. (c) Phase contrast images of WS1 cells mock-treated or treated with MG132, ALLN, lactacystin (LC), E64 or leupeptin as in Figure 1. (d) Immunohistochemistry of ex vivo cultured human prostate tissues. Prostate tissues were treated with MG132 (20 µm) for 24 h, fixed and stained for p53 (DO7 antibody, green) and costained for DNA using Hoechst (blue) according to previously published methods 1
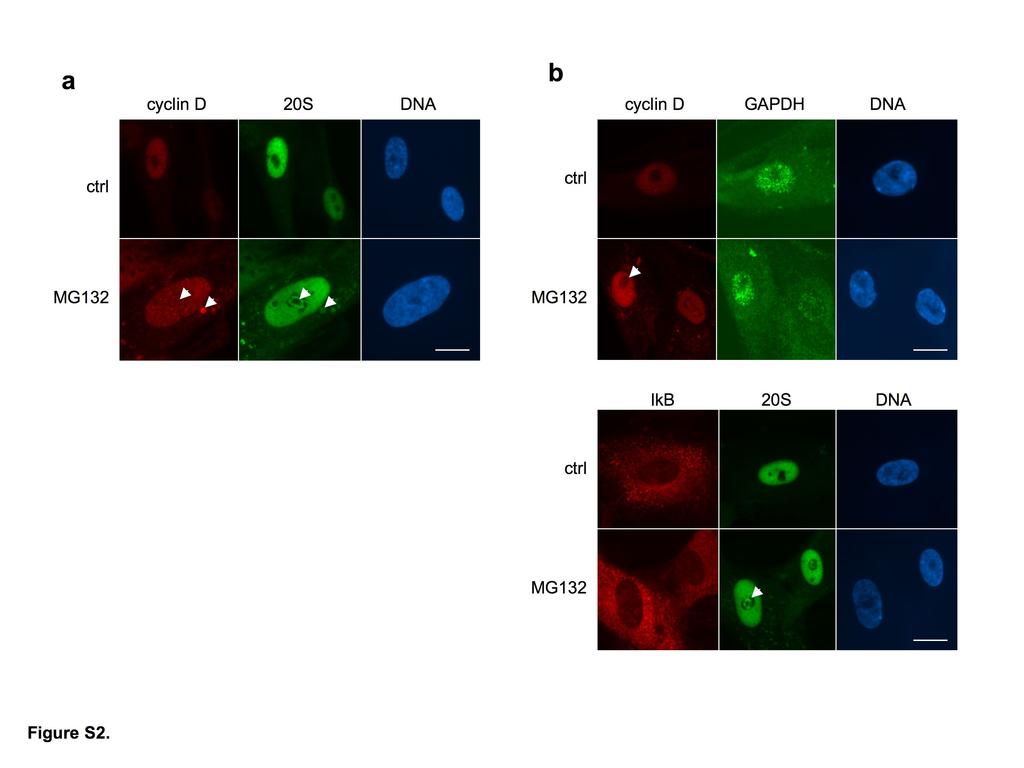
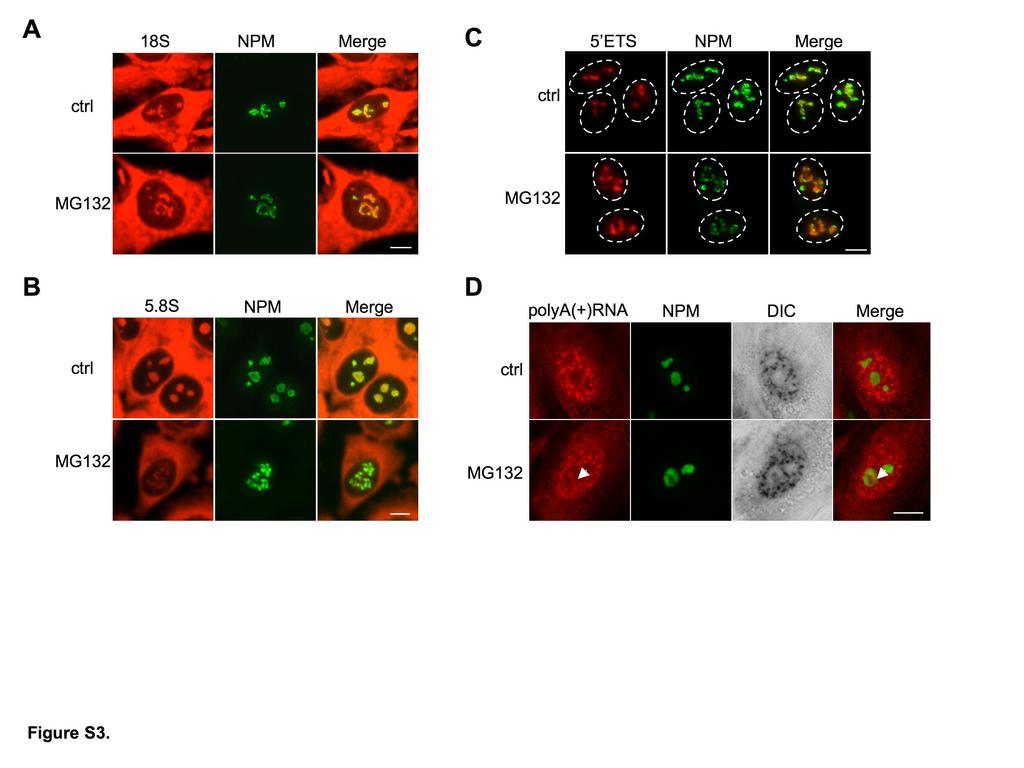
2 (Kiviharju-af Hällström et al., 2007). Confocal images and an inset are shown. Arrowheads indicate nucleolar aggregates. Bar, 50 µm. Figure S2 Aggregation to nucleoli by proteasome inhibition is specific for nuclear proteasome targets. (a) Immunostaining for cyclin D (red) and 20S proteasome (green) of WS1 cells treated with MG132 for 12 h or left untreated. Arrowheads indicate nucleolar and cytoplasmic aggregates. (b) Immunostaining for lysosomal degradation target protein GAPDH (green) and cytoplasmic proteasome target IkBα (red). Co-staining for cyclin D (red) and 20S proteasome (green) are shown, respectively. DNA was stained with Hoechst (blue). Arrowheads indicate nucleolar aggregates. Bars, 20 µm. Figure S3 Nucleolar aggregates contain RNA but not rrna. (a, b) In situ hybridization of 18S, and 5.8S rrna (red) and co-staining for NPM (green). (c) In situ hybridization of 5 ETS of rrna precursor and co-staining of NPM. (d) In situ hybridization of polya() RNA and co-staining for NPM. Arrowheads indicate nucleolar aggregates. Bars, 10 µm. Movie S1 p53 and FBL display distinct spatial localizations in proteasome inhibitor-treated cells. WS1 cells were treated with MG132 (10 µm) and stained for p53 (green) and FBL (red) and confocal images were acquired. A z-stack was obtained at 0.43 µm intervals. The projection shown was generated using 3D projection of LSM Physiology software (Zeiss). 2
3 Table S1 Aggregate formation in cell lines* Aggregates** p53 aggregate MDM2 aggregate Cell type Tissue Pathology Species WS-1 fibroblast skin normal human CCL-137 fibroblast lung normal human HeLa /*** /- epithelial cervix transformed human HCT116 epithelial colon transformed human U2-OS /- osteosarcoma bone transformed human G melanoma skin transformed human NIH3T3 fibroblast embryo immortal murine MEF fibroblast embryo normal murine MEF (E6/E7) fibroblast embryo transformed murine COS7 fibroblast-like kidney transformed simian *, < 20% cells positive; 20-50% cells positive; > 50% cells positive; **phase contrast; *** two different strains of HeLa 3
4
5
6