SUPPLEMENTARY INFORMATION SUPPLEMENTARY FIGURES
|
|
|
- Kristopher Long
- 5 years ago
- Views:
Transcription

1 SUPPLEMENTARY INFORMATION SUPPLEMENTARY FIGURES Supplementary Figure 1. Generation of inducible BICD2 knock-out mice. A) The mouse BICD2 locus and gene targeting constructs. To generate an inducible Bicd2 knockout allele, we introduced a neomycin-resistance gene surrounded by loxp sequences into intron 1, and a puromycin selection marker, surrounded by loxp sequences and followed by β-galactosidase (lacz) reporter gene fused to a nuclear localization signal (NLS), downstream of the mouse Bicd2 gene. The top line represents Bicd2, with exons indicated by solid boxes (white boxes, 5 and 3 UTRs; black boxes, coding regions). Exon 1 contains the start codon (ATG) and exon 9 contains the stop codon (asterisk). The positions of Southern-blot probes 1 and 2 (horizontal lines) and PCR primers a, b, c and d (arrows) are indicated. Selected
2 restriction enzyme sites are shown (BamHI and XbaI). The targeting constructs are shown below Bicd2. Homology with the Bicd2 gene is indicated, as are the lengths of the homologous regions. The loxp sites are represented by arrows. NEO, neomycinresistance cassette; PURO, puromycin-resistance cassette; TK, thymidine kinase gene; HA NLS lacz, HA- and NLS-tagged lacz cassette, containing an engineered splice acceptor site (3 splice) and polyadenylation signal (not indicated). The doubly targeted BICD2 allele, Bicd2 f (targeted), is shown below the targeting constructs. Cre-mediated recombination at the outermost loxp sites of the Bicd2 f allele removes most of the Bicd2 sequences and generates the Bicd2 - allele, which is represented by the bottom line. The splice acceptor site at the 5 end of the reporter lacz cassette can be spliced onto Bicd2 exon 2 sequences, generating a hybrid Bicd2 lacz transcript. B) Southern-blot analysis of gene targeting and Cre-mediated recombination events. Left, Southern blot of DNA derived from wildtype (wt) and 5 NEO-targeted ES cells and digested with BamHI. The blot was hybridized with (external) probe 1, which detects fragments of 8 kb (wildtype allele) and 4.2 kb (NEO-targeted allele). One NEO-targeted clone with the correct karyotype was electroporated with the PURO targeting construct. Middle, blot with XbaI-digested DNA from a doubly targeted line (Bicd2 f ) probed with external probe 2, which detects fragments of 11.7 kb (NEO allele) and 5.8 kb (NEO/PURO allele). This Bicd2 f ES cell line was electroporated with a Cre-recombinase construct to knocked-out the Bicd2 locus (Bicd2 - ). Cre-mediated recombination was identified (right) using PCR analysis using primers a/d.
 Macroscopic images (A-C) and coronal thionin-stained section of P10 nervous system showing enormous")
3 Supplementary Figure 2. Hydrocephalus and disrupted laminar organization of the cortex in BICD2-deficient mice A-D) Macroscopic images (A-C) and coronal thionin-stained section of P10 nervous system showing enormous expansion of caudal lateral ventricles (LV, arrow in C) and thinning of the cortex (arrows in A B) in Bicd2 -/- brain. Also note disorganized pyramidal layer in the hippocampus (arrow in D) and smaller cerebellum (green contour) in Bicd2 -/- brain. E) Coronal sections at the level of the mesencephalon showing the aqueduct. Sections are processed for neurofilament-m immunohistochemistry and counterstained with thionin. Note the absence of a clear lumen in Bicd2 -/- aqueduct indicative of aqueductal stenosis. F) Coronal thioninstained sections at the level of the rostral myelencephalon. The facial motor nucleus (Mo7) has a normal appearance in Bicd2 -/- mice; RF, reticular formation; Ve, vestibular nuclei. Scale bars: 2 mm (A-C), 1 mm (D), 200 μm (E,F)
 or processed for NeuN immunofluorescence and Dapi")
4 Supplementary Figure 3. Hippocampal abnormalities in BICD2-deficient mice Coronal brain sections of P20 mice stained for LacZ and neutral red (A) or processed for NeuN immunofluorescence and Dapi counterstaining (B), showing disorganized pyramidal layer in CA1 and ubiquitous lacz expression in hippocampus of GFAP-Cre Bicd2 f/f mice. Scale bars: 200 μm
 Maximal projections of confocal stacks (optical section, 5 μm) of antimetabotropic mglur2 receptor and")
5 Supplementary Figure 4. Unaltered laminar distribution of Golgi cells and mossy fibers in BICD2-deficient mice A, B) Maximal projections of confocal stacks (optical section, 5 μm) of antimetabotropic mglur2 receptor and anti-vglut1 immunofluorescence in transverse sections of P20 cerebellum showing that cerebellar Golgi cells (mglur2+, arrow in) are distributed in or below the Purkinje cells (mglur2-, outlined by dashed lines) in Bicd2 -/- cerebellum. C, D) Maximal projections (optical section, 5 μm) of VGluT2 and calbindin immunofluorescence showing VGluT2-labeled climbing fibers (arrow in C ) and mossy fibers (arrow head in C) in wild-type cerebellum, and a few synaptic terminal-like structures on proximal Purkinje cell dendrites (Calb+) in Bicd2 -/- cerebellum. F) Anti-zebrin immunohistochemistry and thionin counterstaining in transverse sections of the anterior vermis (lobule III, IV) showing parasagittal zones with zebrin-positive (p1, p2) and zebrin-negative Purkinje cells. Bicd2 -/- cerebellum retains the zonal organization of Purkinje cells. Scale bars: 25 µm (A), 50 μm (B)
 Western blot with BICD2 antibody (#2294) showing reduced and no expression of BICD2 in tissue homogenates of P20 heterozygote Bicd2 +/- (+/-) and")
6 Supplementary Figure 5. Full size Western blots related to Figure 4A-C A) Western blot with BICD2 antibody (#2294) showing reduced and no expression of BICD2 in tissue homogenates of P20 heterozygote Bicd2 +/- (+/-) and homozygote Bicd2 -/- (-/-) mice, respectively. B) Western blot showing relatively high BICD2 expression in developing nervous system. C) Comparative Western blot analysis using BICD1 (antibody #2295 for BICD1 and antibody #2293 for BICD1/2), dynein components and interacting proteins (dynactin p150, dynein intermediate chain 74, Lis1) and Rab6 expression in Bicd2 -/- cortex and cerebellum. M = marker. Selected parts of the Western blots (indicated in white boxes) can be found in Figure 4.
 Immunohistochemistry with anti-bicd2 antibody in coronal sections of the caudal brain stem of P20 mice showing the absence of staining in Bicd2")
7 Supplementary Figure 6. BICD2-immunoreactivity in glia and large neurons A, B) Immunohistochemistry with anti-bicd2 antibody in coronal sections of the caudal brain stem of P20 mice showing the absence of staining in Bicd2 -/- mice and ubiquitous staining in wild-type brain stem and cerebellum. RF, reticular formation; IO, inferior olive. C) Anti-BICD2 staining in the trigeminal motor nucleus (Mo5) and adjacent reticular formation, showing increased staining levels in motor neurons (arrow head) and glial cells (arrows). D, E) Double-labeling confocal immunofluorescence (optical sections 1µm) of BICD2 and NeuN showing the lower BICD2 staining intensities in neurons (NeuN+ in D) as compared to surrounding glia (NeuN- in D). Some neurons such as large neurons in the reticular formation (arrow head in E), however showed higher BICD2 staining levels. F, G) Double-labeling of BICD2 with MAP2 (F) or GFAP (G), respectively in primary neuron-astrocyte cerebellar co-cultures, indicates the absence of BICD2 in Map2+ cells and a fin punctate distribution of BICD2 in GFAP+ cells. Scale bars: 500 µm (A), 200 μm (C), 20 μm (D-F).
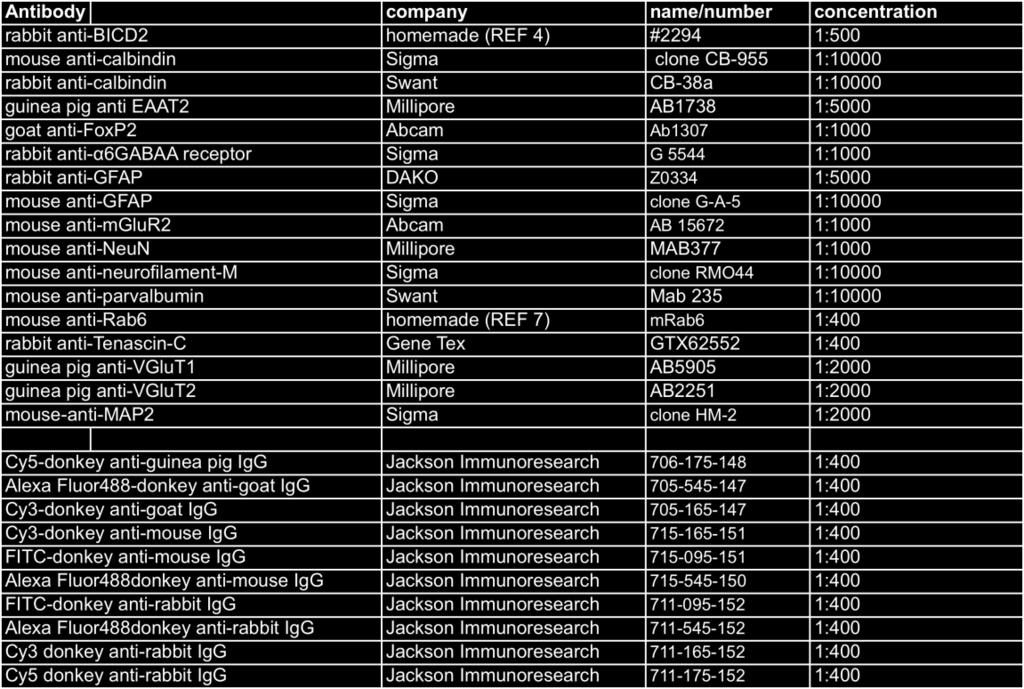
8 SUPPLEMENTARY METHODS Antibodies used in this study