doi: /nature09408 Figure S1
|
|
|
- Julie George
- 5 years ago
- Views:
Transcription

1 doi: /nature09408 A Figure S1 1

, BAA31456.1 (NorM V. parahaemolyticus), CAQ51477.")
.")


2 RESEARCH SUPPLEMENTARY INFORMATION Figure S1 Primary sequence, and structure of NorM VC. A. Amino acid sequence alignment of NorM VC with selected orthologs. Similar residues are shaded blue, identical residues are shaded yellow. Threshold for shading is 60%. NCBI reference sequences used are: AAF (NorM V. cholerae), BAA (NorM V. parahaemolyticus), CAQ (Nt JAT1 Nicotiana tabacum), XP_ (MatE Dictyostelium discoideum AX4), and NP_ (SCL47A homo sapiens). The extra C term sequences of both slime mold and human MATE are not comparable to the other orthologs and are omitted for clarity. Secondary structure of NorM VC is shown as a cartoon above the sequence alignment. Residues that were mutated to cysteines for structure and topology verification are indicated by black arrowheads. Residues that constitute the cation binding site (Fig. 4 and Table S4) are highlighted with red rectangles. Residue D36 (highlighted with a pink rectangle) corresponds to D32 in NorM VP. B D, Structure of NorM VC presented in stereo. 2
 or with pet19b norm VC (red column).")
3 RESEARCH Figure S2 Effect of recombinant NorM VC on EtBr uptake by E. coli BL21 DE3 acrab as measured by EtBr accumulation. Cells were transformed with pet19b vector alone as a control (black column) or with pet19b norm VC (red column). Fluorescence intensity values reflect EtBr accumulation between cell samples of equal mass. Error bars show the standard deviation among runs. 3
4 RESEARCH SUPPLEMENTARY INFORMATION Figure S3 Biochemical characterization of the substrate binding activity of native NorM VC. A, NorM VC binds to doxorubicin ( ) and B, rhodamine 6G ( ) as determined by fluorescence polarization. Data is plotted as flourescent counts of substrate versus the logarithim of NorM VC concentration (molar). Curves were fit by the Hill equation. Data points represent the mean of three independent runs using distinct protein populations with at least two replicates per run. Error bars show the standard deviation among runs. Dissociation constants, excitation, and emission wavelengths are presented in Table S1. 4
 contoured at 1 σ derived from NCS averaging of the dataset at")

5 RESEARCH A B. Figure S4 Experimental electron density map of NorM VC. A, B, Stereo views of electron density (blue mesh) contoured at 1 σ derived from NCS averaging of the dataset at 4.5 Å. The NorM VC monomer is presented in gray ribbon. Additional electron density surrounding the molecule is from symmetry related copies in the unit cell. The map was generated using the program PHASES 27 as described in the supplemental text. 5


6 RESEARCH SUPPLEMENTARY INFORMATION 6


7 RESEARCH 7


8 RESEARCH SUPPLEMENTARY INFORMATION 8


9 RESEARCH 9


10 RESEARCH SUPPLEMENTARY INFORMATION 10


11 RESEARCH 11
 were generated as described in the text.")

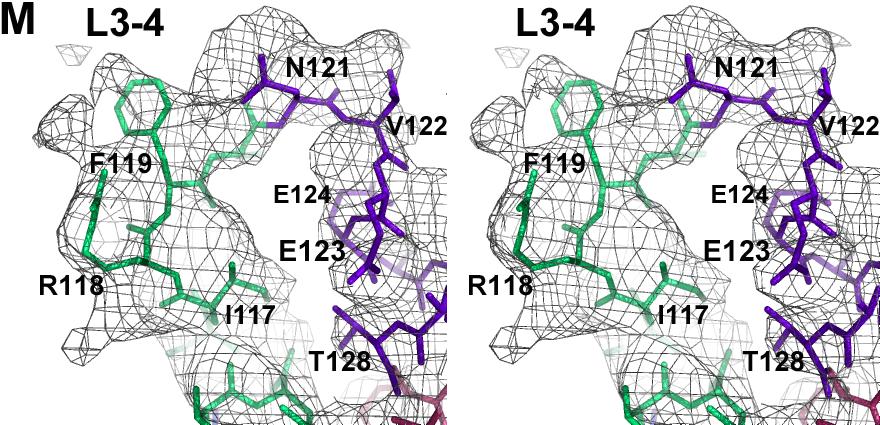
12 RESEARCH SUPPLEMENTARY INFORMATION Figure S5 Stereo views of Fo Fc simulated annealing omit density. A J, TM helices of NorM VC (Crystal 1) with multiple density maps superimposed. K, Stereo view of the C terminal helix following TM12. L O, Stereo views of select loop regions. The Fo Fc density maps (grey) were generated as described in the text. Difference density for an entire NorM VC molecule was achieved by superimposing individual Fo Fc maps calculated using sequential segments of eight residues that were iteratively omitted from the model calculated with a neighboring sphere size of 4 Å and a map cushion of 2 Å. The windows of residues omitted from the model are shown in different colors. Maps B D and F K were contoured at 2.0 σ while A, E, and L O were at 1.5 σ. 12


13 RESEARCH Figure S6 13


14 RESEARCH SUPPLEMENTARY INFORMATION 14
 with multiple density maps superimposed.")

15 RESEARCH Figure S6 Stereo views of Fo Fc simulated annealing omit density. A F, NorM VC (Crystal 2) with multiple density maps superimposed. The Fo Fc density maps (grey) were generated in the same manner as Fig. S5. The windows of residues omitted from the model are shown in different colors. Maps A F were contoured at 2.0 σ. 15


16 RESEARCH SUPPLEMENTARY INFORMATION Figure S7 16
17 RESEARCH Figure S7 Topology verification of NorM VC structure, stereo views. A, Front view of NorM1 showing 16 mercury peaks corresponding to single cysteine mutations as viewed parallel to the membrane plane. B, Back view rotated 180 about the pseudo molecular 2 fold axis relating the two halves of the molecule. Difference Fourier maps were obtained as described for Fig. 2a 2b from single cysteine mutant crystals soaked with mercury compounds (Table S3). The NorM VC model is rendered as grey ribbon. Each isomorphous difference Fourier peak represents Hg covalently linked to a cysteine residue introduced by single site mutation. The mutation positions and sigma cutoffs of the difference maps are: A149C: 5.0 ; A260C: 4.0 ; A296C: 4.5 ; E91C: 4.0 ; F429C: 4.0 ; K10C: 3.5 ; L101C: 4.0 ; M164C: 5.0 ; M323C: 5.5 ; S26C: 4.0 ; S103C: 4.5 ; S397C: 5.0 ; V76C: 7.0 ; V182C: 4.5 ; V216C: 6.0 ; Y367C: 5.0. C, D, Identical views of Fig. 2a, b for NorM

18 RESEARCH SUPPLEMENTARY INFORMATION Figure S

19 RESEARCH 19


20 RESEARCH SUPPLEMENTARY INFORMATION 20

21 RESEARCH 21
22 RESEARCH SUPPLEMENTARY INFORMATION 22


23 RESEARCH 23

24 RESEARCH SUPPLEMENTARY INFORMATION 24

25 RESEARCH 25
26 RESEARCH SUPPLEMENTARY INFORMATION Figure S8 Close up views of mercury sites resolved from Hg soaked crystals of cysteine substitution mutants used for topology verification (Fig. S7). The relative positions of the Hg sites for both NorM1 and NorM2 are shown, validating both the position and identity of each residue for each monomer in the asymmetric unit. Fourier syntheses were generated as described in the supplemental text, and in Table S3. The mutation positions and sigma cutoffs of the difference maps for both monomers are the following. A, K10C, 3.5 for NorM1 and 4.0 for NorM2. B, S26C, 4.0 NorM1 and 3.5 for NorM2. C, V76C, 7.0. D, E91C, 4.0. E, L101C, 4.0 for NorM1 and 4.5 for NorM2. F, S103C, 4.5 for NorM1 and 4.0 for NorM2. G, A149C, 5.0. H, M164C, 5.0 for NorM1 and 4.0 for NorM2. I, V182C, 4.5. J, V216C, 6.0 for NorM1 and 5.0 for NorM2. K, A260C, 4.0 for NorM1 and 3.5 for NorM2. L, A296C, 4.5. M, M323C, 5.5. N, Y367C, 5.0 for NorM1 and 4.0 for NorM2. O, S397C, 5.0 for NorM1 and 4.5 for NorM2. P, F429C, 4.0. Mesh coloring is the same as in Fig. 2a 2b and Fig. S

27 RESEARCH Figure S9 27

28 RESEARCH SUPPLEMENTARY INFORMATION Figure S9 Stereo views of electrostatic potential surface of NorM VC. A, B, Side stereo views rotated as viewed parallel to the lipid bilayer. Views from the C, extracellular and D, cytoplasmic sides of the membrane. The internal cavity from the cytoplasmic side of the molecule is occluded in this outward facing conformation. The surface of NorM is colored according to amino acid residue charge ranging from blue (positive charges) to red (negative charges). Hydrophobic and aromatic residues are colored in white. 28
 as generated using the program 3V Channel Extractor with a probe size of 1.")
29 RESEARCH Figure S10 NorM VC internal cavity. Stereo view of the volume of the internal cavity (blue) as generated using the program 3V Channel Extractor with a probe size of 1.6 Å (ref 38). The C trace of the protein is shown as golden ribbon. 29
 to least (red) conserved.")

30 RESEARCH SUPPLEMENTARY INFORMATION A. B. Figure S11 Conserved amino acid residues of NorM VC. A, Stereo view from the extracellular side showing residue conservation, colored as a rainbow going from most (blue) to least (red) conserved. The most conserved residues are located towards the internal cavity where cation and substrate binding are expected. B, Side stereo view with TMs 3 and 9 rendered as ribbons for clarity, emphasizing the relatively lower conservation of these helices. The color range is the same as in A. The analysis was generated using ConSurf ( with the MUSCLE option for the sequence alignment and the 50 most recent unique homologous sequences from SWISS PROT. Three PSI BLAST iterations were used

31 RESEARCH Figure S

32 RESEARCH SUPPLEMENTARY INFORMATION 32
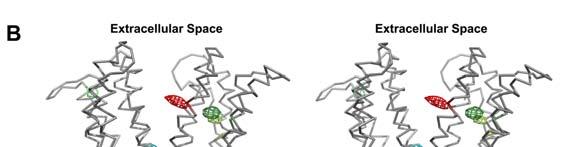
33 RESEARCH Figure S12 D371N and D371A mutations abolish cation binding. A, Composite Fo Fc simulated annealing omit map (gray mesh, contoured at 2.0 ) of the cation binding site superimposed with isomorphous difference Fourier map calculated between Crystal 2 (containing Rb+) and Crystal 3 (native) (Table S3), revealing a Rb + peak at 5.5 (red mesh). B, Cs + peak at 5.0 (orange mesh) in the same view as shown in A. C, Shows a loss of Rb + binding in the D371N mutant as indicated by a 5.0 peak (purple mesh) in the isomorphous difference Fourier map calculated between a RbCl soaked D371N crystal and Crystal 2, which contains Rb + (Figs. 4a, and Tables S2 S3). The center of this peak coincides with the Rb+ site in Crystal 2. D, Shows a loss of Cs + binding in D371N mutant by a 5.5 peak (dark green mesh) in an isomorphous difference Fourier map calculated between a CsCl soaked D371N crystal and Crystal 4, which contains Cs + (Figs. 4b and Table S3). E, Shows the loss of Rb + binding by D371A mutant by a 5.0 peak (dark blue mesh) by in an isomorphous difference Fourier map calculated between a RbCl soaked D371A crystal and Crystal 2. Isomorphous difference Fourier maps are calculated as described in the supplemental text. Residues that make up the cationbinding site are marked. Isomorphous difference Fourier maps with native data reveals no peaks for C E. 33
34 RESEARCH SUPPLEMENTARY INFORMATION Table S1 Affinity of NorM VC to its substrates determined by fluorescent polarization Compound K d, M Ex, nm Em, nm Doxorubicin 1.00 ± Rhodamine 6G 2.09 ± Table S2 Data collection, phasing, and refinement statistics Crystal 1 a (Native) Crystal 2 a (Rb + -bound) CLS 08ID-1 ALS BL SSRL BL 11-1 Data collection Space Group P P P P P Unit Cell a,b,c (Å) α, β,γ ( o ) a=142.8 b=240.8 c=45.7 α, β,γ =90.0 a=159.6 b=241.7 c=46.2 α, β, γ=90.0 o a=163.3 b=242.9 c=45.2 α, β, γ=90.0 o a=161.0 b=242.5 c=45.9 α, β, γ=90.0 o a=164.1 b=242.7 c=45.6 α, β, γ=90.0 o E1 E2 E1 E2 E1 E2 Wavelength (Å) Resolution (Å) Redundancy R sym, % (0.42) Completeness, % 86.5 (90.4) (0.27) 99.0 (99.0) (0.305) 95.6 (85.7) (0.304) 94.7 (86.7) (0.228) 95.5 (84.8) (0.278) 94.9 (85.5) 0.13 (0.334) 89.5 (87.8) (0.324) 89.2 (87.8) Model Building and Refinement Resolution (Å) Sigma Cutoff R cryst, % / R free,% 31.2 / / 34.2 Completeness, % R.m.s deviations Bond lengths (Å) Bond angles ( o ) <B>, (Å 2 ) R shrink, R probe (Å) 0.5, , 0.5 Bulk Solvent Param: K, B sol (Å 2 ) 0.25, , 10.0 a Diffraction data collected at APS 23 ID D. Values in parenthesis are those in the outer resolution bin. 34
35 RESEARCH Table S3 Data Processing of Mutants and Additional Data Sets Data Set Source a(å) Unit Cell b(å) 1: K10C a (11) APS 23ID B : S26C a (7) CLS08ID : V76C a (8) CLS08ID C a APS 23ID B : L101C a (3) CLS08ID : S103C a (7) CLS08ID : A149C a (6) APS 23ID B : M164C a (3) APS 23ID B : V182C a (13) APS 23ID B : V216C a (18) APS 23ID B : A260C a (1) APS 23ID B : A296C b (13) SSRL : M323C c (19) SSRL : Y367C b (3) SSRL : D371A d (crystal2) APS 23ID D : D371N d (crystal2) APS 23ID D : D371N e (21) APS 23ID D : S397C a (4) SSRL : F429C b (13) SSRL : Crystal 3 SSRL : Crystal 4 e APS 23ID D R sm a = (I <I>) <I>, where I is the measured intensity of each reflection, and <I> is the intensity averaged from symmetry equivalents. c(å) Resolution (Å) Redundancy Redundancy a R sym Completeness % Table S3 Summary of mutant, and native datasets used for topological and cation site verification. Superscript denotes compound used for derivation where a=hg(oac) 2, b= Baker s dimercurial, c= Hg(CN) 2, d= RbCl, and e= CsCl. Subscript denotes corresponding dataset used for isomorphous Fourier synthesis. 35
36 RESEARCH SUPPLEMENTARY INFORMATION Table S4 Residues in the internal cavity Position Residue Hydrophobic Polar Charged Aromatic Rb + Position Residue Hydrophobic Polar Charged Aromatic Rb + TM6 TM5 TM4 TM2 TM1 22 VAL X 248 VAL X 25 ALA X 251 ALA X 26 SER X 252 LEU X 28 ALA X 253 PHE X X TM7 29 GLN X 255 GLU X X 30 THR X 256 VAL X 32 MET 259 PHE X X X 33 GLY 260 ALA X 36 ASP X 263 ALA X 37 THR X 273 VAL X 38 ILE X 274 VAL X 50 ALA X 276 ALA X 51 VAL X 277 HIS X 53 ILE X 278 GLN X 54 ALA X 280 ALA X 55 ALA X 281 LEU X 57 ILE X 282 ASN X TM8 58 TRP X X 285 SER X X 60 PRO 286 LEU X 61 SER X 288 PHE X X X 63 LEU X 289 MET 64 PHE X X 292 MET 67 GLY 293 SER X 68 LEU X 295 GLY 71 ALA X 296 ALA X 72 LEU X 299 SER X 75 VAL X 363 PHE X X 135 HIS X 367 TYR X X X X TM ILE X 371 ASP X X 141 VAL X 374 GLN X 142 PRO 375 VAL X 144 TYR X X X 378 ALA X 145 LEU X 379 GLY 148 GLN X 391 PHE X X TM SER X 395 PHE X X 153 PHE X X 398 TYR X X X X 163 ALA X 403 LEU X 166 ILE X 426 TRP X X TM GLY 429 PHE X X X 170 GLY 433 LEU X X 174 ASN X 436 ALA X 178 ASN X 440 LEU X 182 VAL X 196 CYS X 199 ALA X Residues 200 THR X VAL X 206 ILE X Total 207 MET Table S4 Residues in the internal cavity. Ala, Ile, Leu, Phe, Trp, Tyr, and Val are classified hydrophobic; Asn, Cys, Gln, Ser, Thr, Tyr Polar; Asp, His, Glu charged; and Phe, Trp, and Tyr aromatic. The Rb + column denotes residues bounding the cation site. 36
37 RESEARCH Supplementary Notes 38. Voss, N. R., Gerstein, M. Steitz, T. A. & Moore, P. B. The geometry of the ribosomal polypeptide exit tunnel. Journal of Molecular Biology 360, (2006). 39. Glaser, F., Rosenberg, Y., Kessel, A., Pupko, T. & Ben Tal, N. The ConSurf HSSP database: The mapping of evolutionary conservation among homologs onto PDB structures. Proteins Structure Function and Bioinformatics 58, (2005). 40. Goldenberg, O., Erez, E., Nimrod, G. & Ben Tal, N. The ConSurf DB: precalculated evolutionary conservation profiles of protein structures. Nucleic Acids Res 37, D323 D327 (2009). 41. Landau, M. et al. Consurf 2005: the projection of evolutionary conservation scores of residues on protein structures. Nucleic Acids Res 33, W299 W302 (2005). 37