Model based inference of mutation rates and selection strengths in humans and influenza. Daniel Wegmann University of Fribourg
|
|
|
- Kelly Stephens
- 5 years ago
- Views:
Transcription
1 Model based inference of mutation rates and selection strengths in humans and influenza Daniel Wegmann University of Fribourg
2 Influenza rapidly evolved resistance against novel drugs Weinstock & Zuccotti (2009)


3 Molecular Evolution Mutation Genetic drift Selection Molecular Evolution (Change in allele frequencies over time) Statistical challenge: How can we learn about these processes?
4 Molecular Evolution Mutation Genetic drift Selection Molecular Evolution (Change in allele frequencies over time) Statistical challenge: How can we learn about these processes?

5 Experimental evolution in the lab Foll et al. (2014)
6 Experimental evolution in the lab
7 Experimental evolution in the lab
8 Experimental evolution in the lab

9 Experimental evolution in the lab

10 Wright-Fisher Model A classic model incorporating random genetic drift and selection. It is a first order Markov model with binomial transition probabilities.
 with binomial emission probabilities.")
11 Wright-Fisher Model A classic model incorporating random genetic drift and selection. It is a first order Markov model with binomial transition probabilities. Time-series samples are naturally modeled as a hidden Markov model (HMM) with binomial emission probabilities. Computationally prohibitive as the forward or backward variable require (N+1) 2 multiplications per generation / sample point!
12 Approximate Wright-Fisher To render HMM inference computationally feasible, one would like to have a coarse grid on the allele frequencies. However, the resulting process is no longer first-order Markovian.

13 Approximate Wright-Fisher We seek to approximate a continous diffusion process X with a discretestate Markov process U that captures the main characteristics. Anna Ferrer Admetlla Chris Leuenberger

14 Approximate Wright-Fisher We seek to approximate a continous diffusion process X with a discretestate Markov process U that captures the main characteristics. Proposal: the mean transition time approximation Anna Ferrer Admetlla Chris Leuenberger
15 Mean Transition Time Approximation Approximate the transition probability k k+1 as, where : probability the diffusion process exits at the upper limit. : expected time a diffusion process now at u k remains in (u k-1,u k+1 ).
16 Mean Transition Time Approximation Approximate the transition probability k k+1 as, where : probability the diffusion process exits at the upper limit. : expected time a diffusion process now at u k remains in (u k-1,u k+1 ). These quantities can be calculated using Green s functions. We approximate the diffusion, for which transition probabilities are obtained with a few numerical integrations.

17 Mean Transition Time Approximation

18 Mean Transition Time Approximation
19 Bayesian inference Embed in an MCMC scheme to estimate N and locus specific s.
20 Working with NGS == high error rates
21 Working with NGS == high error rates
22 Working with NGS == high error rates Mutations staying at very low but non-zero frequencies for an extended time is highly unlikely given the low effective population size. But these patterns can be explained by (a combination of): Purifying selection Sequencing errors Recurrent mutation
23 Application to Influenza data
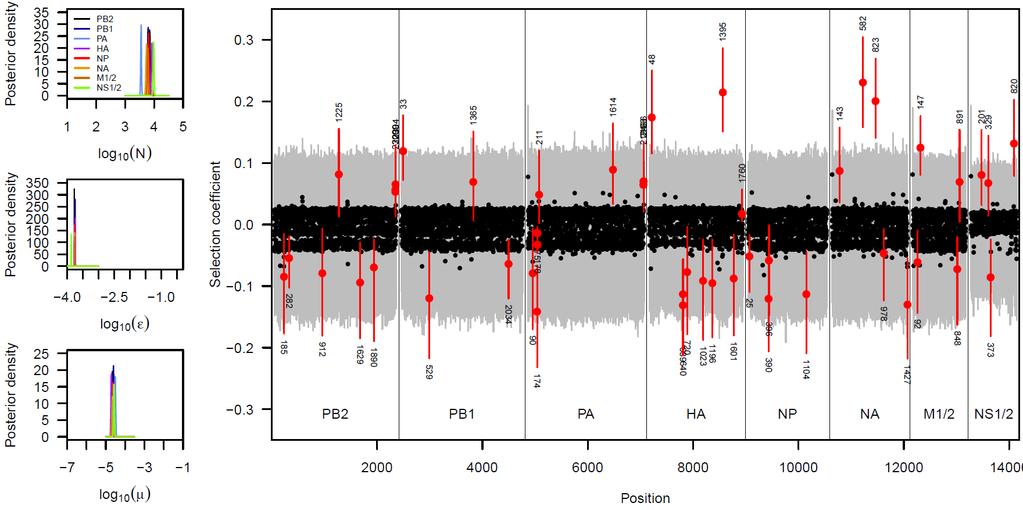


24 Application to Influenza data
25 How about Humans? Evolutionary experiments are a bit difficult in humans... Statistical challenge: How can we learn about molecular evolution from a single time points?

26 How about Humans? Evolutionary experiments are a bit difficult in humans... Statistical challenge: How can we learn about molecular evolution from a single time points? Coalescent Theory A population genetic theory that considers the history of a sample backward in time. A statistically elegant way to look at the relationship between samples


27 Joint inference of demography and mutation rates Mutation rate and population size N have similar effects on genetic diversity. large population small population low mutation rate large mutation rate Wakeley and Takahashi 2002
28 Joint inference of demography and mutation rates Mutation rate and population size N have similar effects on genetic diversity. large population small population low mutation rate large mutation rate If sample size > effective population size: the effect of the population size is affecting the number of singletons only which rensers estimation of and N individually possible. Wakeley and Takahashi 2002


29 Deep resequencing data set Data set: 202 known or prospective drug target genes 14,002 individuals, of which 12,514 Europeans Median coverage of 27x and a call rate of 90.7% Extensive quality control John Novembre Matt Nelson Heterozygous concordance 99.1% in 130 sample duplicates 99.0% in comparison to 1000G Trios Singleton concordance 98.5% in 130 sample duplicates 98.3% of 245 validated via Sanger Wegmann & Nelson et al. 2012

 variants: 0-30 per gene Number rare variants (<0.")
30 Overall Patterns of Variation Among 12,514 Europeans, we found 38,535 SNVs Corresponds to 1 every 21 base pairs Common variation as just the tip of the iceberg of human genetic diversity Number of common (>=0.5%) variants: 0-30 per gene Number rare variants (<0.5%) variants: per gene 74% of all variants have MAF < 0.01% Wegmann & Nelson et al. 2012
31 Rare variants are only weakly affected by selection Expected number of alleles with frequency x Advantageous alleles Neutral alleles Disadvantageous alleles Messer 2009


32 Phenotypic Effect of Rare Variants Rare variants have a strong, negative impact on the phenotype 85% of NS mutations are deleterious enough never to get fixed 75% never to never get common (MAF of 5%) Similar patterns found by PolyPhen Wegmann & Nelson et al. 2012
33 Joint inference of demography and mutation rates Likelihood: probability of data D given parameters,θ Polymorphisms Mutation rates & Population sizes Maximum-Likelihood: Find, θ that maximize P(D, θ)
34 Joint inference of demography and mutation rates Likelihood: probability of data D given parameters,θ Polymorphisms Mutation rates & Population sizes Maximum-Likelihood: Find, θ that maximize P(D, θ) For many evolutionary models, analytical solutions of the likelihood are very hard and often impossible to obtain We will use two tricks: 1) Use summary statistics S instead of the full data D The hope is that P(D,N) is proportional to P(S,N), 2) Use simulations to approximate the likelihood function P(S,N)

35 Joint inference of demography and mutation rates Frequency 1) Using Site Frequency Spectrum SFS instead of the full data D AGATTCAC AGCTTCAT AGATTCAT AGATTCAT AGCTTCGC Minor Allele Count 22,000 Sequences of 202 genes Site Frequency Spectrum SFS
36 Joint inference of demography and mutation rates 1) Using Site Frequency Spectrum SFS instead of the full data D 2) Using Monte Carlo simulations to approximate P(SFS,N): a) Simulate genealogies with fixed parameter values Africa Asia Europe Exponential growth in Europe All other parameters fixed to Schaffner estimates Nielsen 2000; Coventry et al. 2010
 Using Monte Carlo simulations to")


37 Joint inference of demography and mutation rates 1) Using Site Frequency Spectrum SFS instead of the full data D 2) Using Monte Carlo simulations to approximate P(SFS,N): a) Simulate genealogies with fixed parameter values b) Compute average likelihood of the SFS across genealogies Africa Asia Europe Exponential growth in Europe All other parameters fixed to Schaffner estimates Likelihood 1 Likelihood 2 Likelihood 3 Average Likelihood Nielsen 2000; Coventry et al. 2010


 But in good agreement with recent estimates")
38 Mutation rate Joint inference of demography and mutation rates Rapid population growth in Europe Variable mutation rates across genes (p ) Median mutation rate of 1.2x10⁻⁸ Lower than divergence based estimates (2.5x10⁻⁸ ) But in good agreement with recent estimates from pedigrees Population size (millions)


39 Drivers of mutation rate variation p = p = 0.60


40 Effect of GC due to CpG sites only


41 Effect of GC due to CpG sites only
42 Recombination rate has no effect on mutation rates


43 Recombination rate has no effect on mutation rates Consistent with Biased Gene Conversion (BGC) and Background Selection
44 Conclusions Experimental evolution may reveal how pathogens evolve drug resistance. But just like in real hosts, demographic processes result in stochastic outcomes that need to be accounted for. We propose an approximate scheme based on the mean transition time approximation Very fast as it requires only few frequency states and is evaluated analytically. Yet it is powerful to infer selection from such time series data. Using coalescent theory, we showed highly variable mutation rates among human genes. Mutation rate variation is due to sequences composition, not recombination

45 Recombination rate has no effect on mutation rates