SUPPLEMENTARY INFORMATION FIGURE LEGENDS
|
|
|
- Gwendolyn Gregory
- 5 years ago
- Views:
Transcription
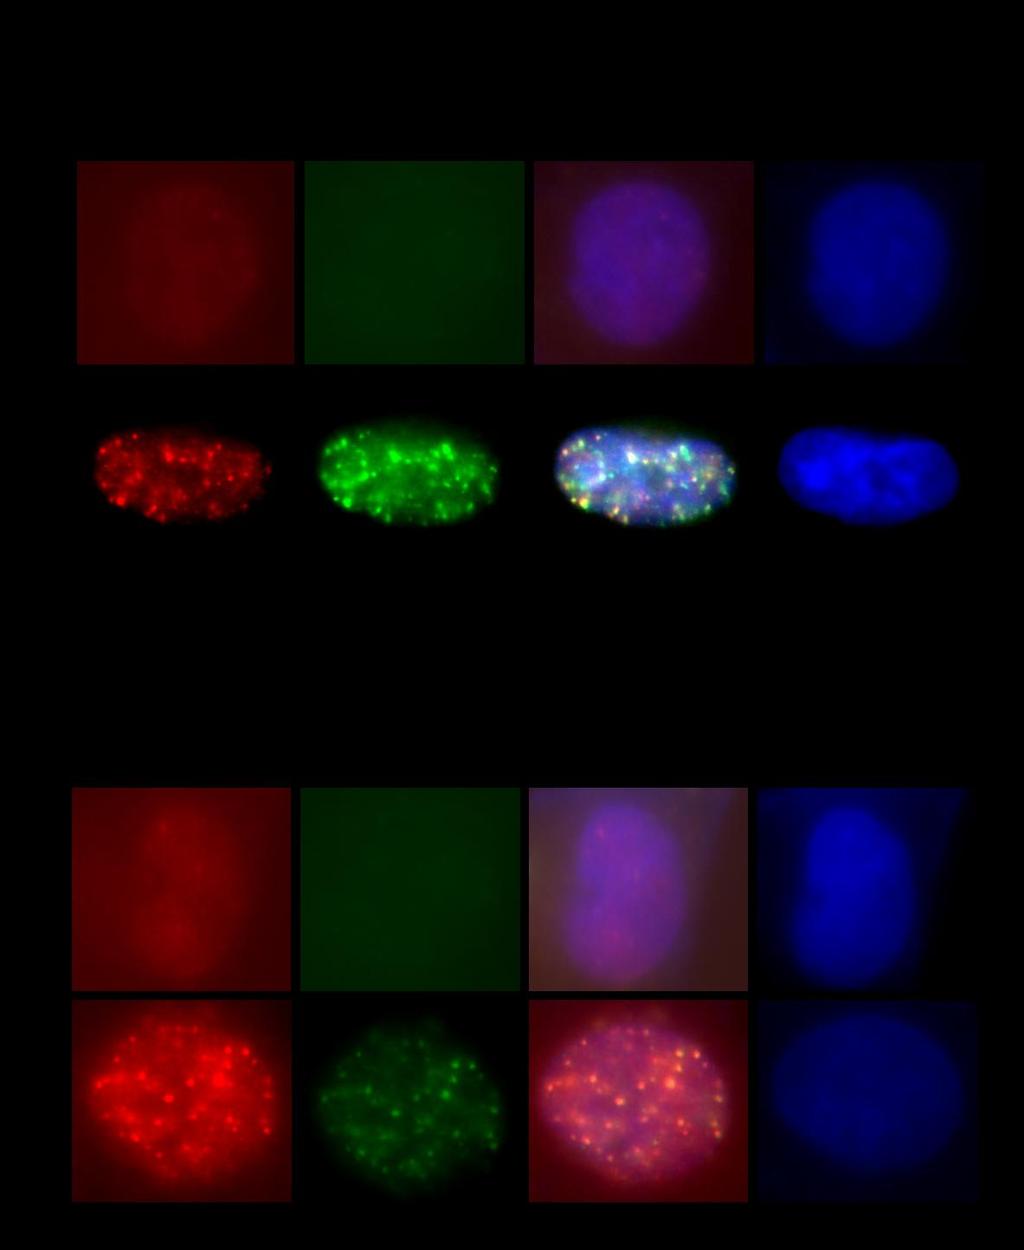
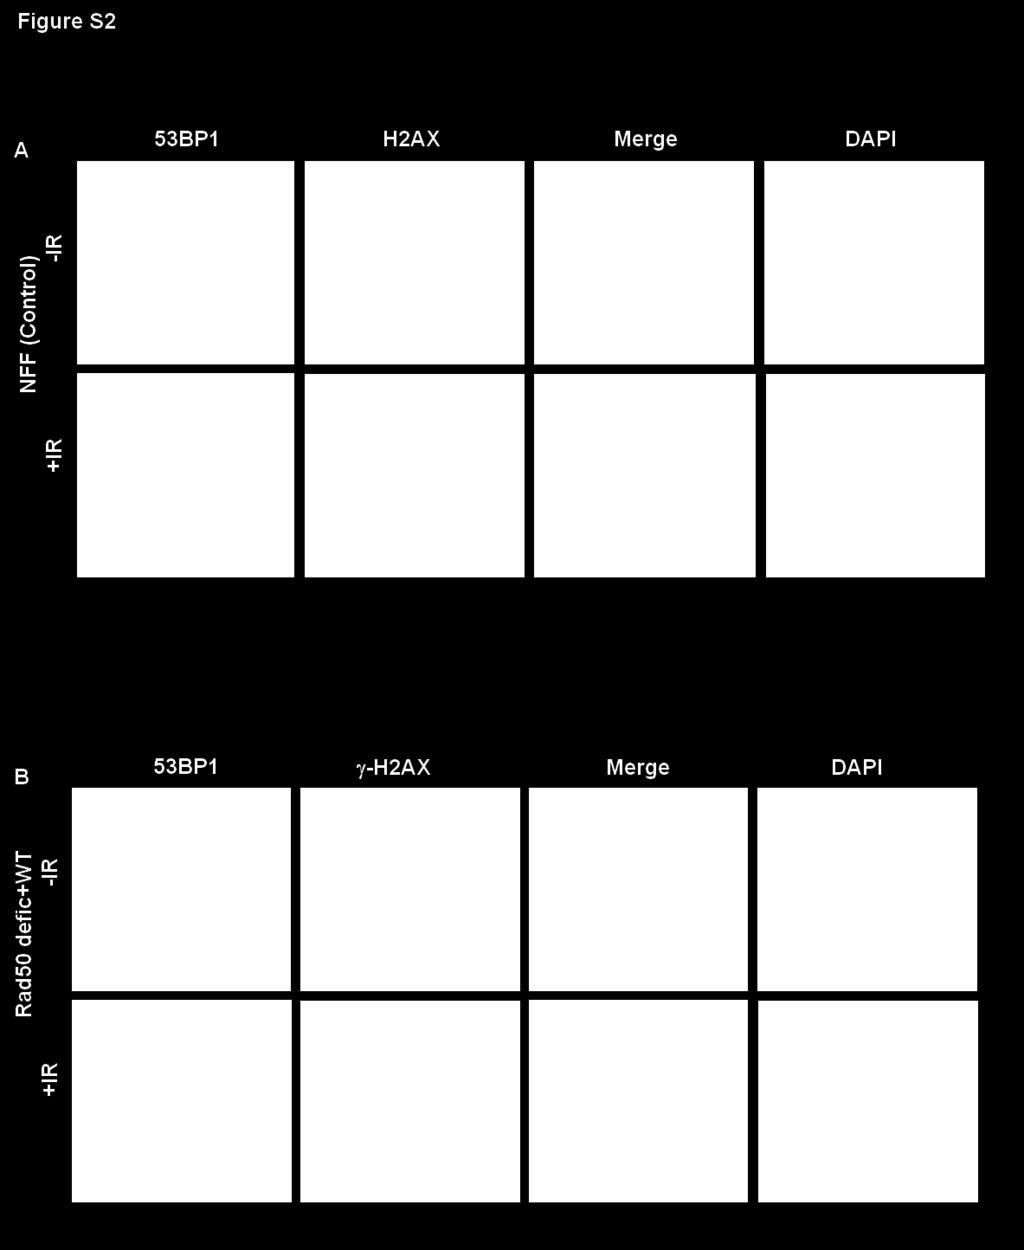
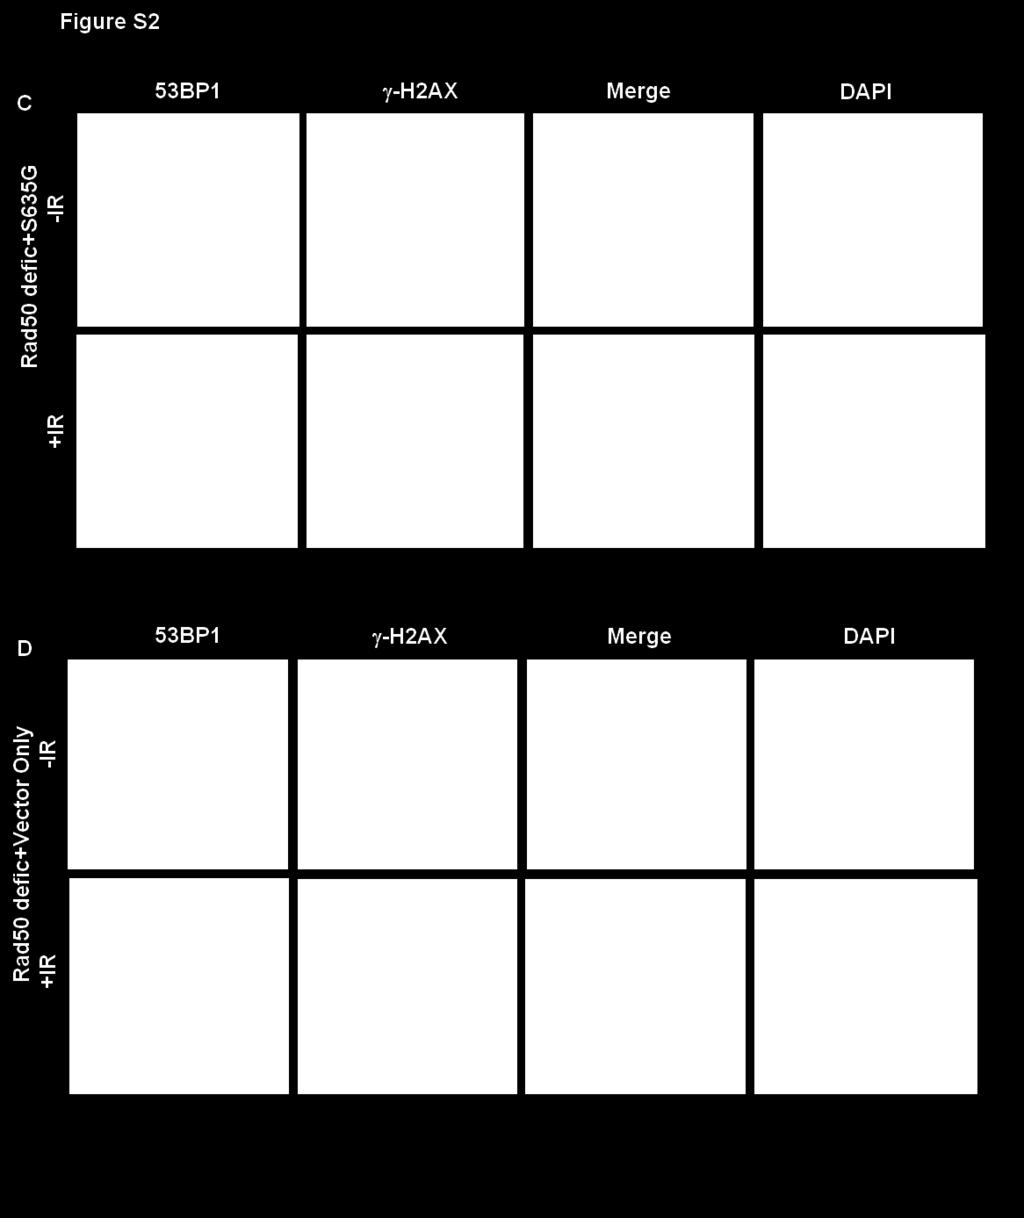
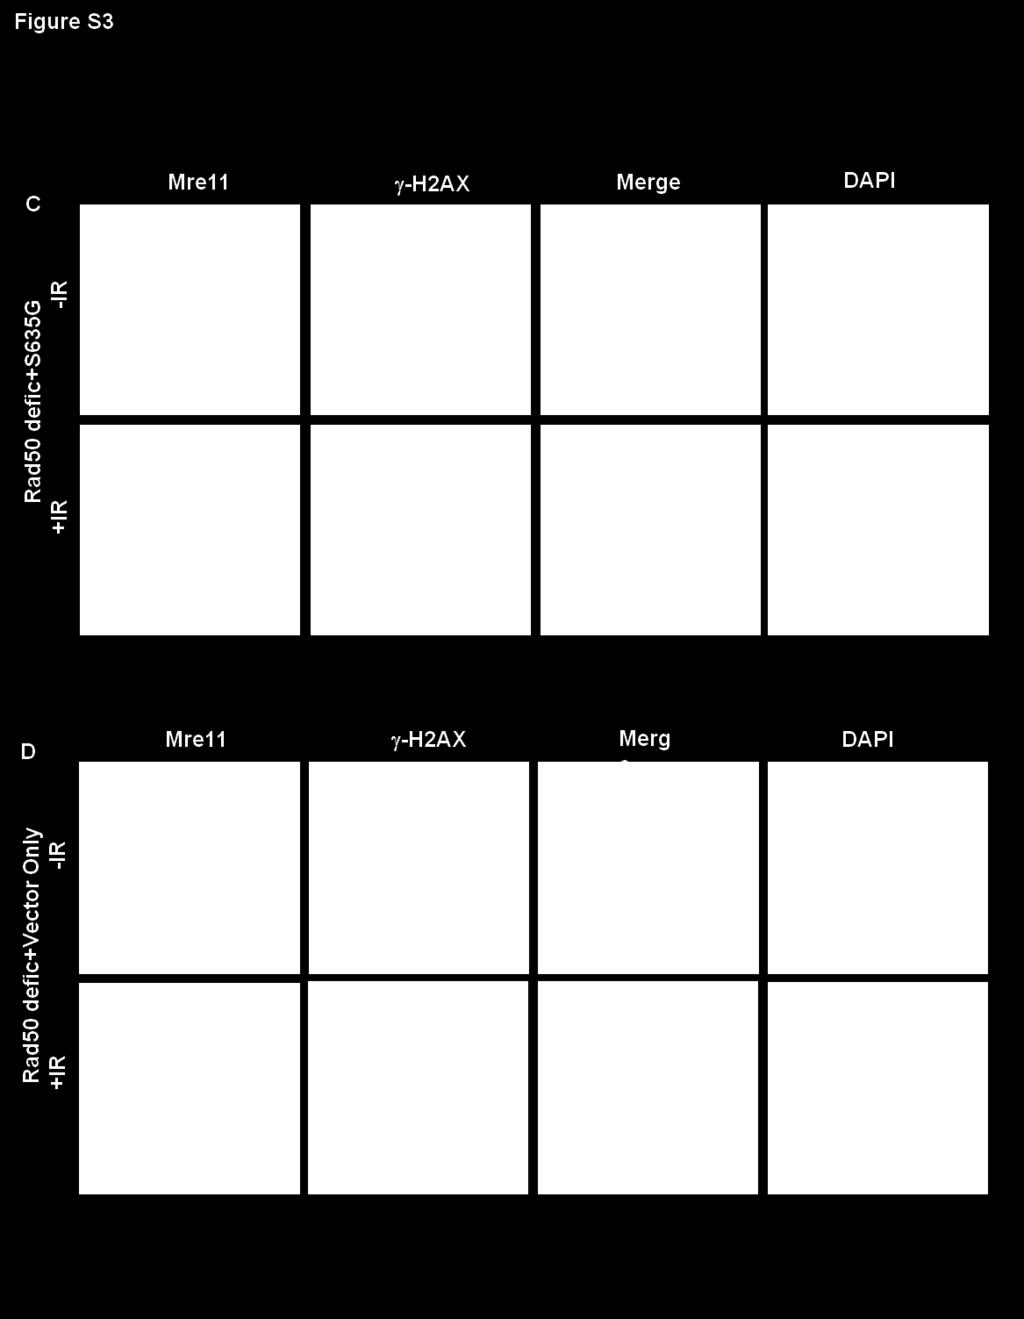
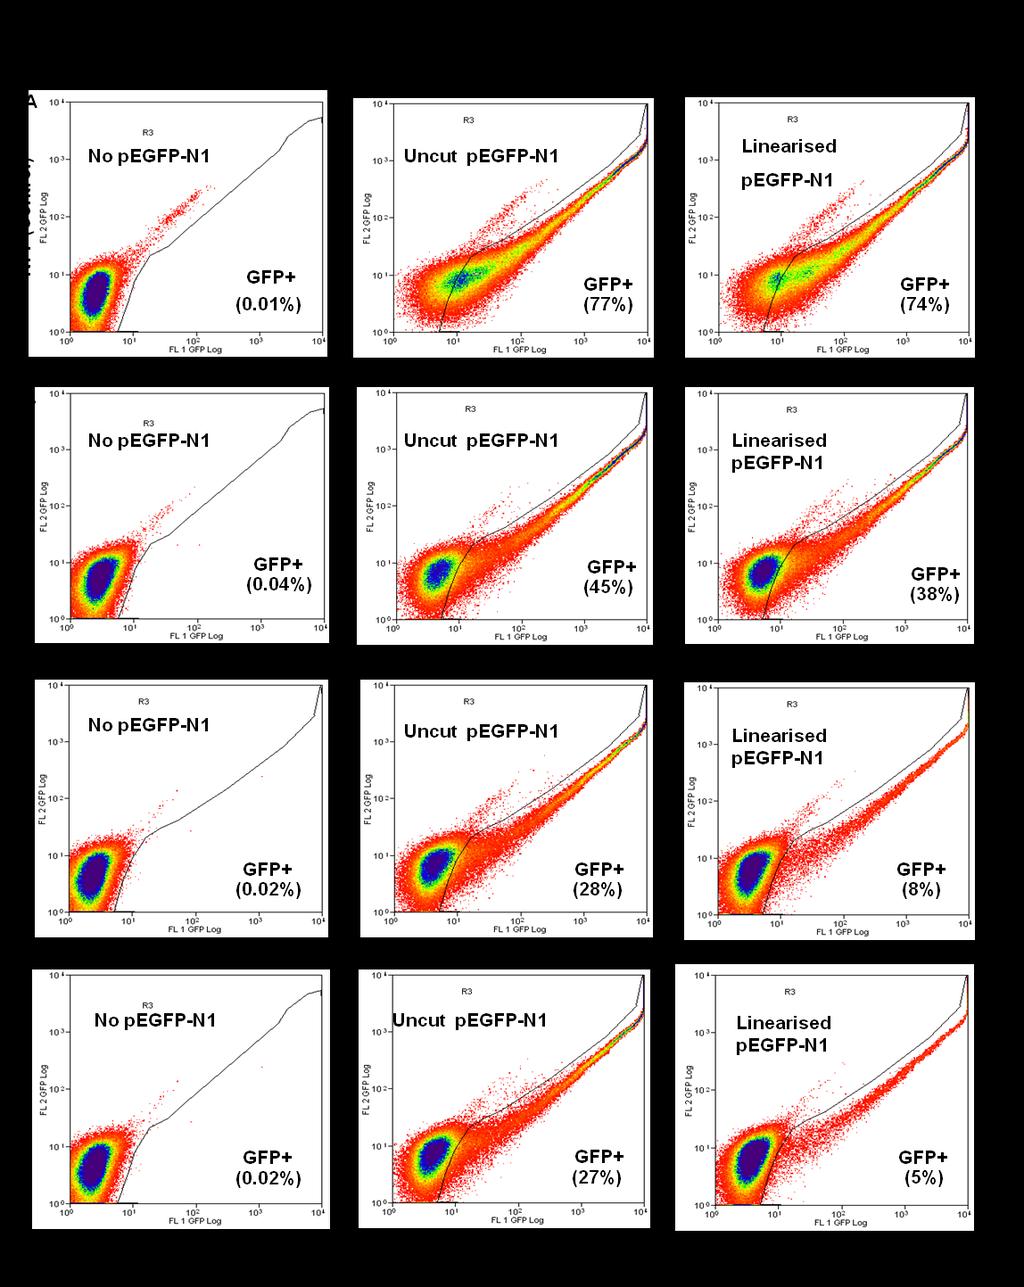
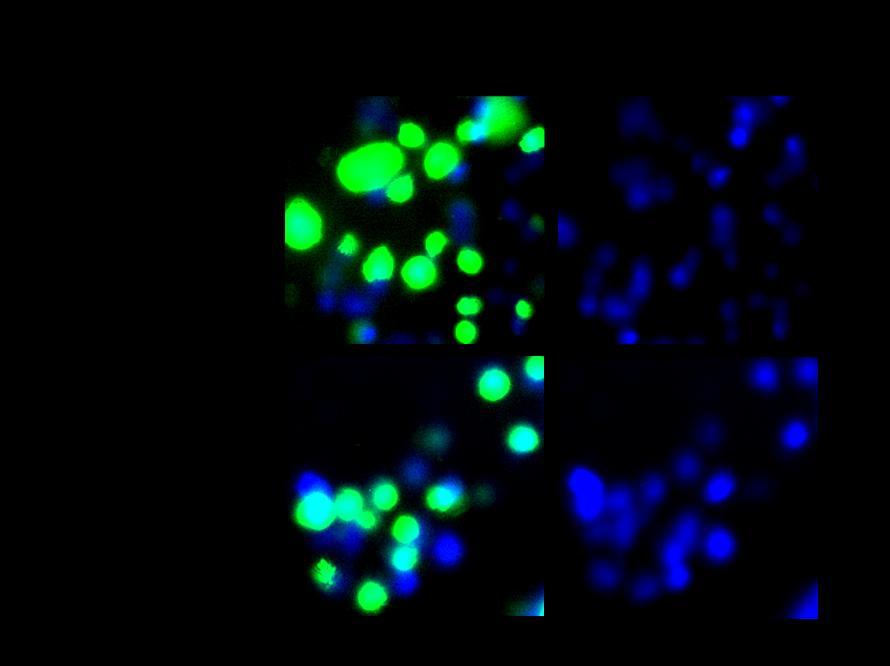
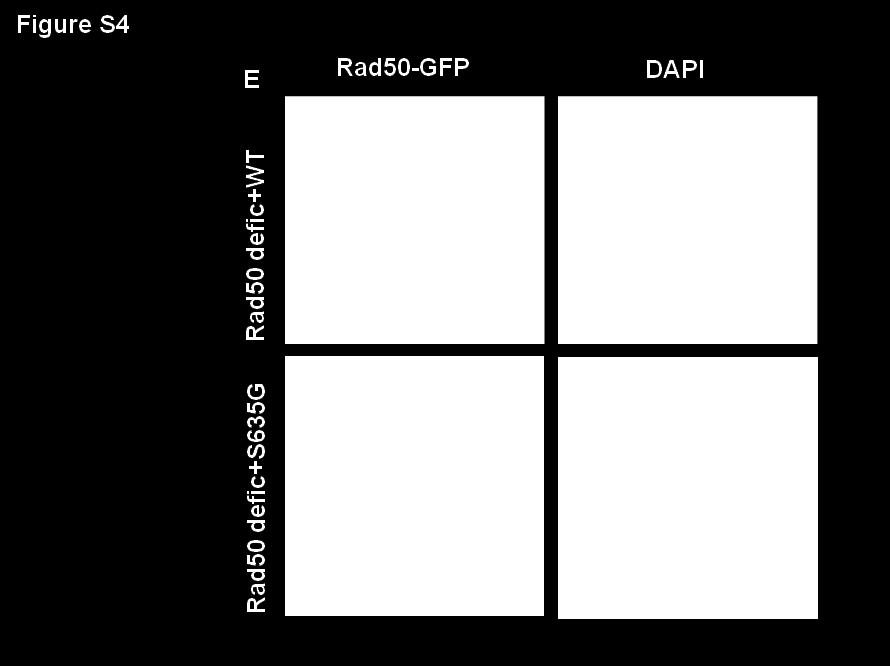
1 SUPPLEMENTARY INFORMATION FIGURE LEGENDS Fig. S1. Radiation-induced phosphorylation of Rad50 at a specific site. A. Rad50 is an in vitro substrate for ATM. A series of Rad50-GSTs covering the entire molecule were utilised to map Rad50 phosphorylation site(s). ATM was immunoprecipitated from control lymphoblastoid (C2ABR) and irradiated (10 Gy) cells incubated for 1 h and ATM kinase activity was assayed using Rad50 GST fusion proteins, covering the full-length of the molecule. Incorporation of 32 P was determined by autoradiography. Amount of GST substrate was determined by Coomassie blue staining and ATM was determined by immunoblotting. B. Mapping of ATM phosphorylation sites on Rad50. Three ATM consensus sites within Rad50 GST 2 were mutated (T367A, T536A and S635G) and used as substrates in ATM kinase assays. ATM immunoprecipitates were prepared as described in (A). C. Rad50 interacts with ATM. Control (C2ABR) and A-T (AT25ABR) lymphoblastoid cells were treated with 6 Gy and harvested after 30 min. Immunoprecipitations were carried out with either ATM (upper panel) or Rad50 (lower panel) antibodies followed by electrophoresis on 4.2% SDS-PAGE and immunoblotting with either ATM or Rad50 antibodies. D. Constitutive interaction of Rad50 and ATM. Whole lysates from C2ABR lymphoblastoid cells containing 0, 10, 25, 50, 100 ng/ml of ethidium bormide were immunoprecipitated with ATM antibody. Immune complexes were analysed with ATM and Rad50 antibodies. E. ATM-dependent phosphorylation of Rad50 on S635. Control (C2ABR) and A-T (AT25ABR lymphoblastoid cells were treated with 10 Gy and incubated for 1h. ATM was immunoprecipitated and kinase assays were carried out as using incorporation of 32 P into GST-Rad50 substrate. GST-p substrate was used as a positive control. F. Rad50 S635 phosphorylation is also defective in Rad50 lymphoblastoid deficient cells (HA239). Whole lysate immunoprecipitations from control (C2ABR); A-T (AT25ABR) and HA239 (Rad50 deficient) lymphoblastoid cells were prepared with ATM antibody. ATM kinase assays were performed as in (A). Fig. S2. 53BP1 and H2AX foci formation in response to DNA DSBs in Rad50 deficient cells transfected with either Rad50 wild type, Rad50 S635G or vector only. Control and Rad50 deficient fibroblasts complemented with Rad50 were treated with 5 Gy of IR and allowed to recover for 1 h, or unirradiated. After permeabilisation, cells were fixed in paraformaldehyde, immunostained with primary and secondary antibodies, and then visualised by fluorescene microscopy. In untreated cells, there was a diffuse nuclear staining. After the induction of DNA damage, 53BP1 (red) and H2AX (green) are distributed to discrete nuclear co-localised foci in all cells. (A) NFF control, (B) Rad50WT, (C) Rad50S635G and (D) Rad50 deficient transfected cells with vector only. Fig. S3. Recruitment of Mre11 to the site of the DNA damage. Fibroblasts were treated and processed as in Figure S2. Cells were stained with anti-mouse H2AX (green) and anti-rabbit Mre11 antibody (red). IR induced nuclear Mre11 foci in control and in Rad50 deficient cells complemented with either Rad50WT or RAd50S645G. H2AX and Mre11 localized to discrete nuclear foci. (A) NFF Control, (B) Rad50WT, (C) Rad50 S635G and (D) Rad50 deficient transfected cells with vector only. Fig. S4. Flow cytometric analysis of end-joining activity in Rad50 deficient fibroblasts following complementation with Rad50. NFF fibroblasts were used as a control (A), Rad50 deficient fibroblasts were reconstituted with Rad50 wild type (B), Rad50 S635G (C) or vector only (D). Fibroblasts were transfected with either circular EGFP-N1 or linearised with HindIII and incubated for 24 h prior to assay. Percentage of GFP positive cells was determined by flow cytometry using two colour fluorescence analysis. Green fluorescence FL1 (530/40) vs Yellow fluorescence FL2 (580/30). E. Efficiency of Rad50 transfection in Rad50 deficient cells. Rad50 deficient fibroblasts were transiently transfected with either Rad50WT-GFP or Rad50S635G-GFP. Cells were fixed and nuclear DNA was stained with DAPI. GFP positive (green) and DAPI stained (blue) cells were determined by fluorescence microscopy.
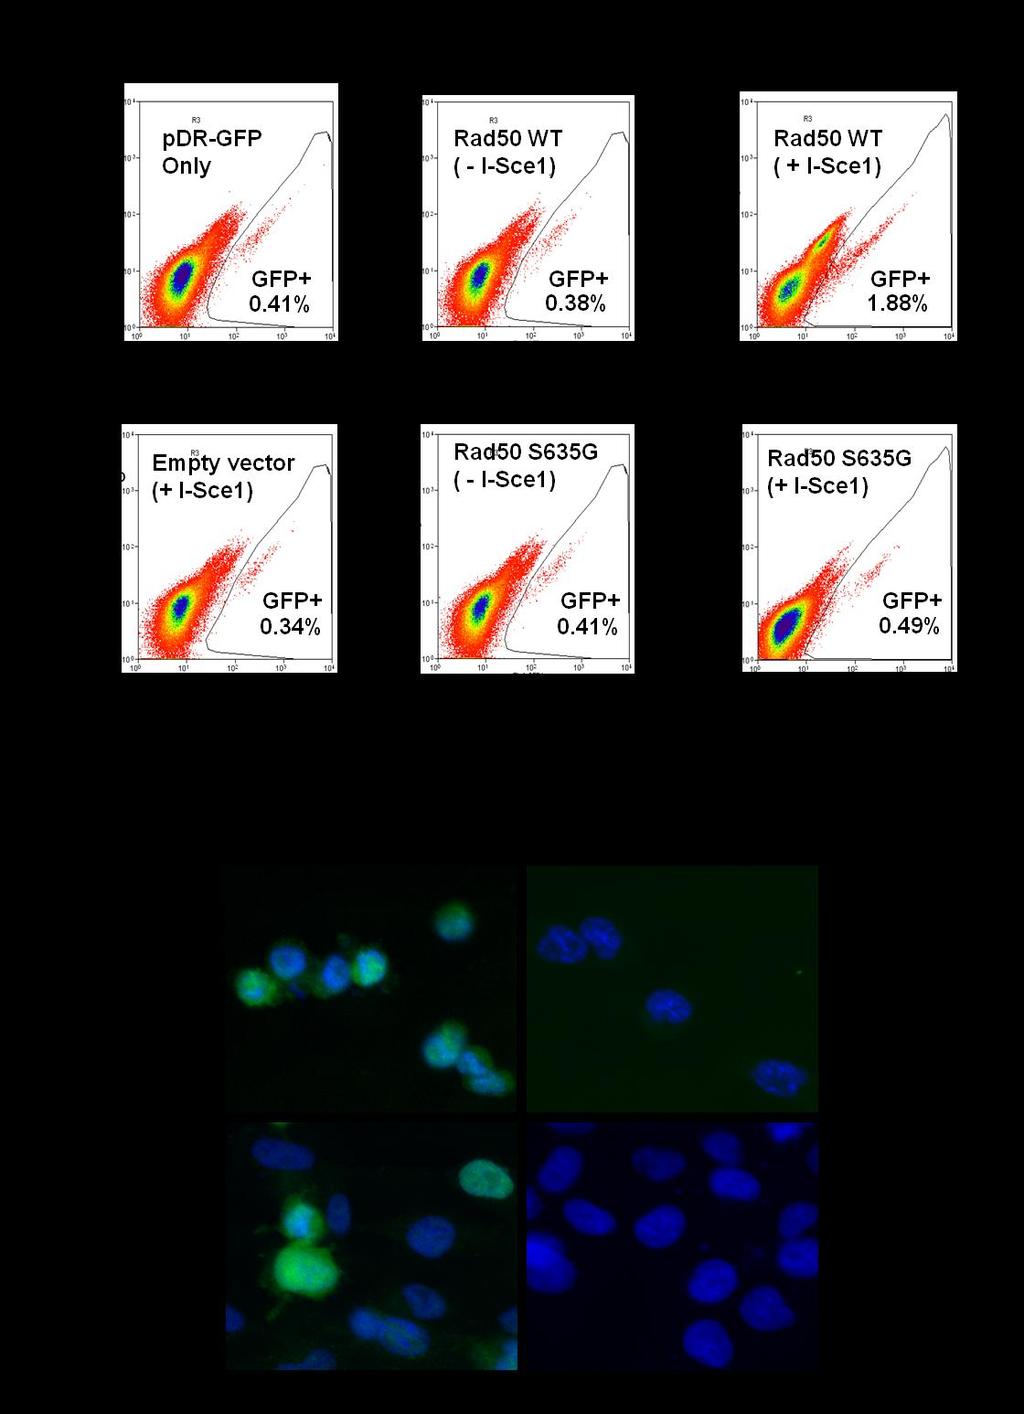
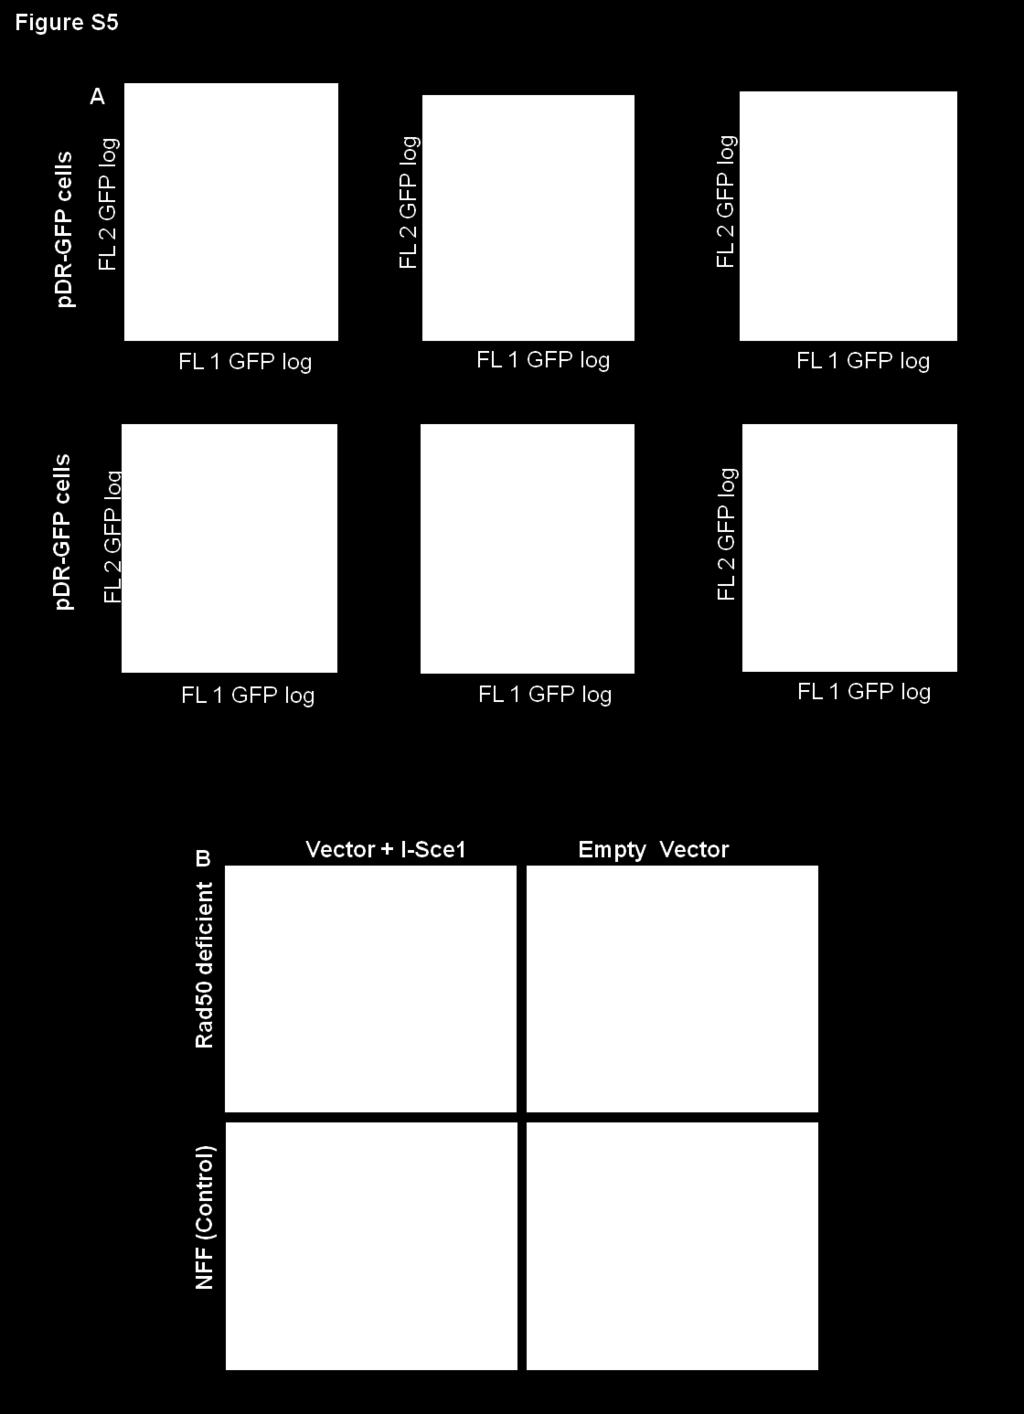
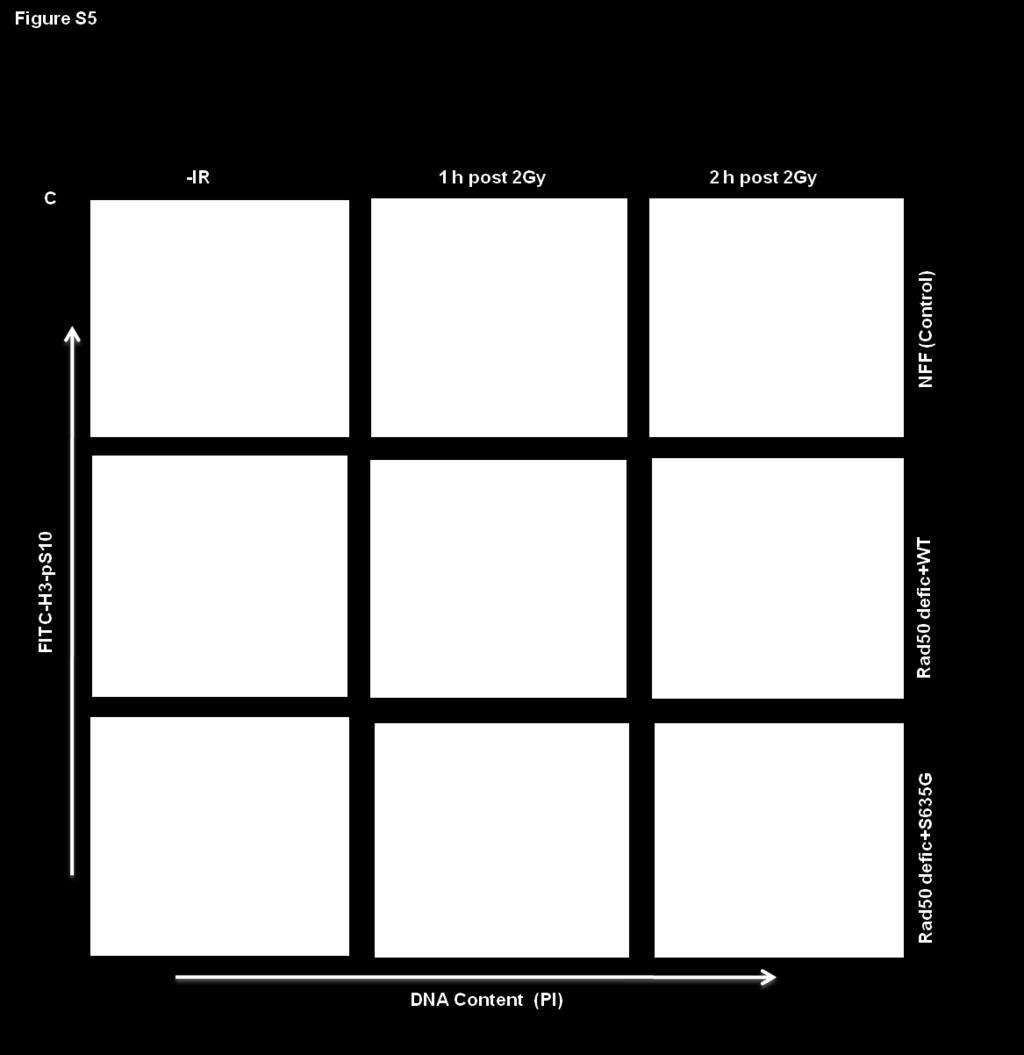
2 Fig. S5. Flow cytometric analysis of homologous recombination activity in Rad50 deficient fibroblasts complemented with Rad50. A. Stable cell lines were established by transfection of Rad50 deficient cells with pdr-gfp reporter. These cells were subsequently transfected with either Rad50 wild type, Rad50S635G or empty vector and incubated for 24h. Prior to assay, I-Scel was transfected and cells were incubated further for 24 h. Cells either without I-Scel or with pdr-gfp were also included. Percentage of I-Scel induced GFP positive cells was determined by flow cytometry using two colour fluorescence analysis. Green fluorescence FL1 (530/40) vs Yellow fluorescence FL2 (580/30). B. Efficiency of I-Scel transfection into NFF (control) and Rad50 deficient fibroblasts. Cells were transfected with either empty vector or with I-Scel expression vector for 24h prior to staining with I-Scel antibody. I-Scel positive cells (green) and DNA staining with DAPI were defined by immunoflurorescence. Use of mitotic phosphorylation of histone H3-pS10 to determine G2/M checkpoint. Fibroblasts were treated with 2 Gy and incubated for either 1 or 2 h after IR. Cells were stained with Histone H3-pS10 conjugated antibody and propidium iodide (PI). Cellular fluorescence was measured using flow cytometry to analyse for Histone phosphorylation and for DNA content (PI staining). C. Control (NFF) cells and Rad50 deficient cells transfected with either Rad50WT or Rad50S635G. D. Rad50 deficient cells transfected with vector only and A-T cells.

3

4
5

6


7

8
9
10
11
12

13