Structural basis of transferrin sequestration by transferrin-binding protein B
|
|
|
- Brandon Cain
- 5 years ago
- Views:
Transcription
1 Supplementary Information for Structural basis of transferrin sequestration by transferrin-binding protein B Charles Calmettes, Joenel Alcantara, Rong-Hua Yu, Anthony B. Schryvers and Trevor F. Moraes* * To whom correspondence should be addressed trevor.moraes@utoronto.ca This PDF file includes: Supplementary Figs. 1-4 Supplementary Tables 1-2 Supplementary Methods
2 Supplementary Figure 1
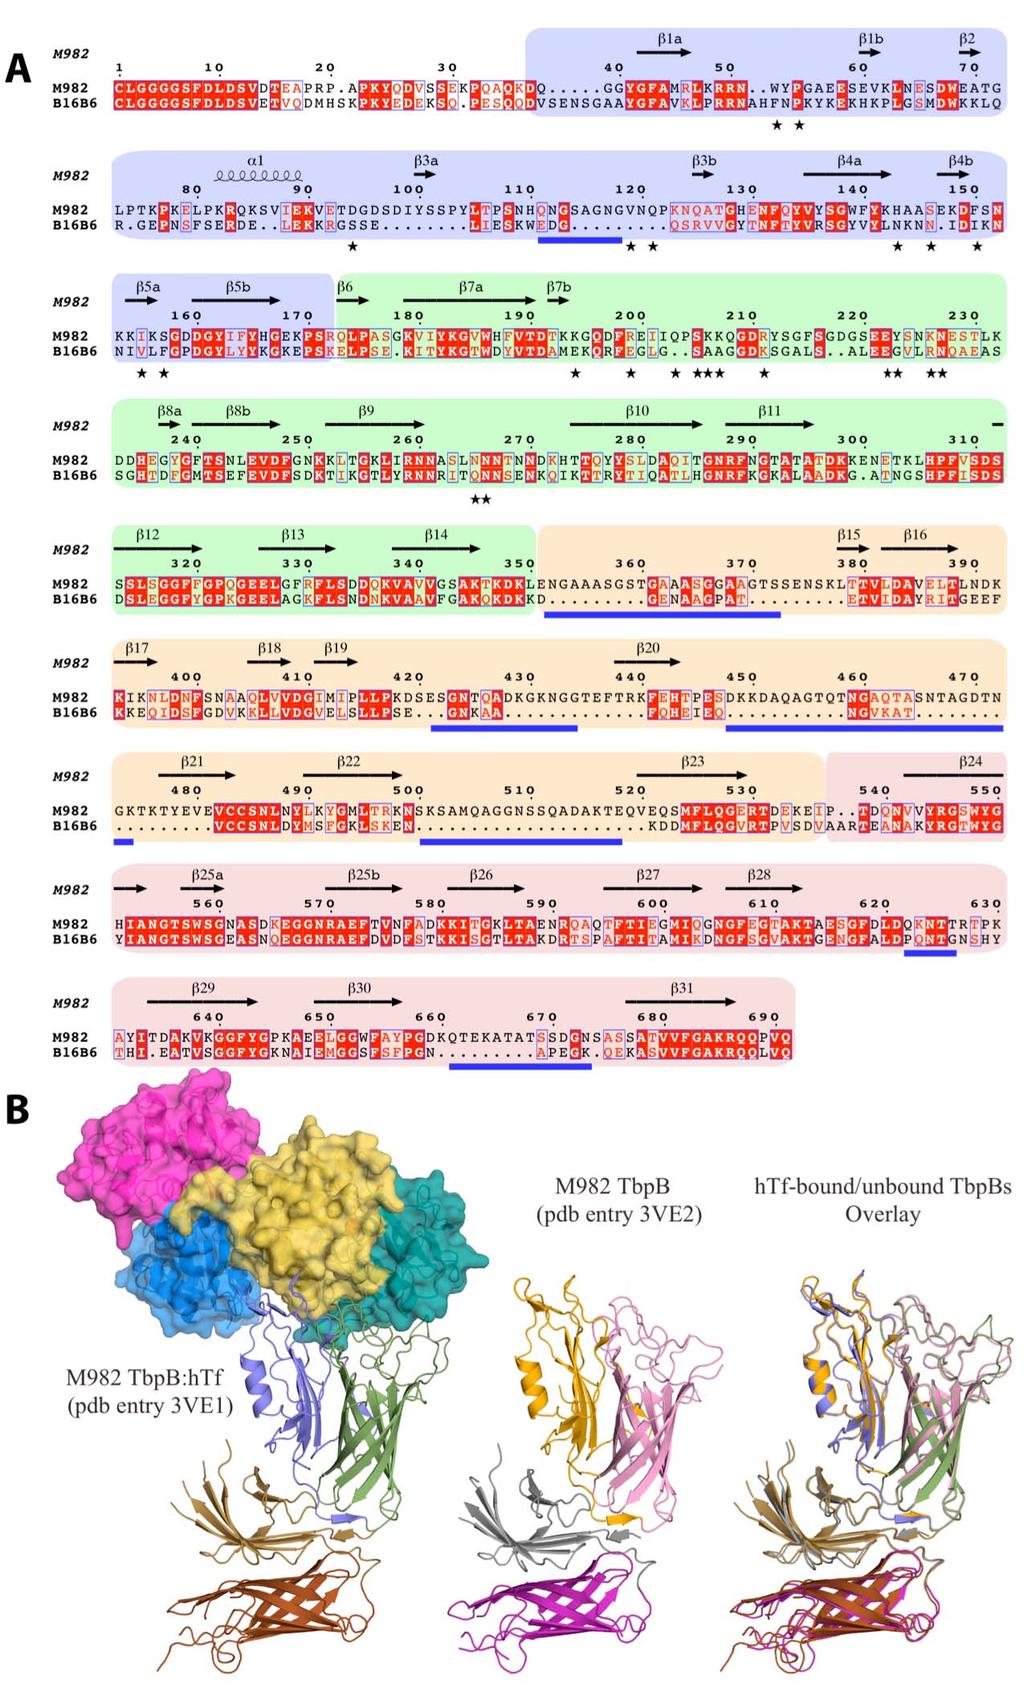
3 Supplementary Figure 1: Structure of Neisseria meningitidis isotype2 TbpB. (A) is a sequence alignment of mature TbpB of NmM982 and NmB16B6 from isotype 2 and isotype 1, respectively. Background colors blue, green, orange, and peach denote the domain architecture of the handle and barrel domain from the N and C lobes, respectively. The secondary structure elements from NmM982 TbpB are shown above the sequence according to the nomenclature employed by Moraes et al. 21. Identical and conserved residues are highlighted red. The stars below the sequences represent amino acids from NmM982 TbpB that interact with htf, and the blue lines indicate flexible loops for which there is no visible electron density. In panel (B), structures representations of the htf-bound and unbound M982 TbpB are presented together with an overlay of both states of TbpB also shown.
4 Supplementary Figure 2
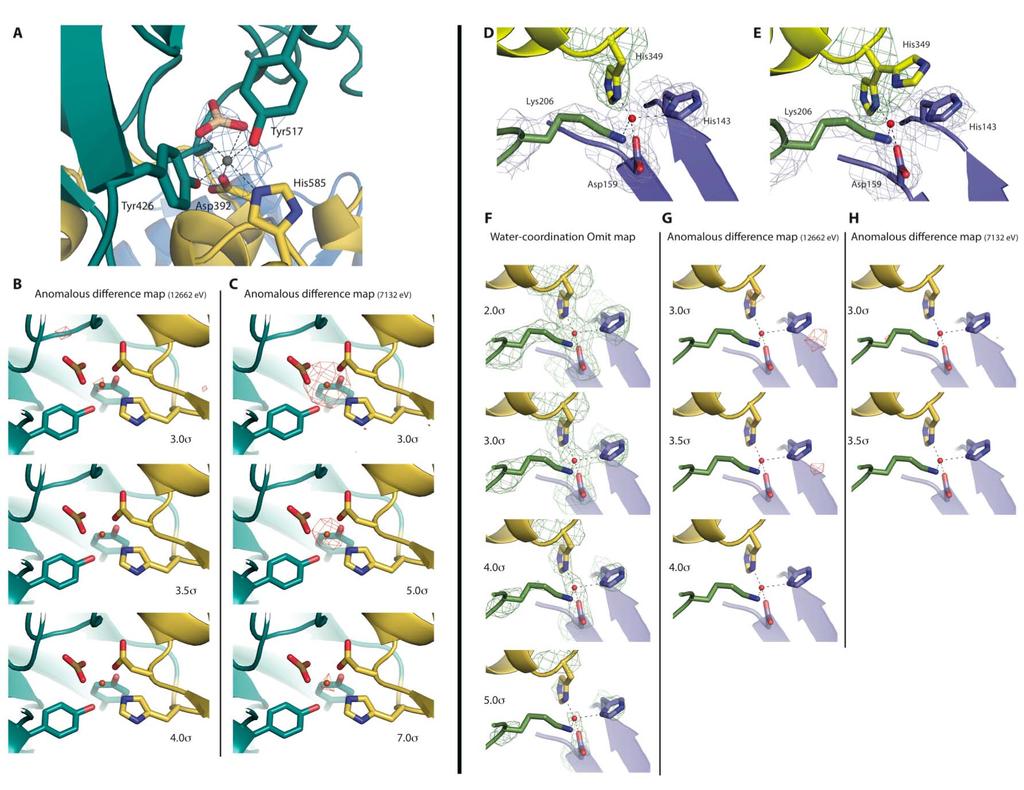
5 Supplementary Figure 2: The iron-binding and the water-coordination sites within the TbpB-hTf complex. (A) The iron-binding site from the human transferrin C-lobe involves Asp392, Tyr426, Tyr517, His585 and a coordinating carbonic acid. The 2Fo-Fc electron density map of the carbonic acid and the hexa-coordinated iron is represented at 3.0 sigma. Color code is conserved from Figure 1A (cyan, yellow and blue denote the C1 and C2 htf domains and the N- lobe TbpB handle domain, respectively). Within panel (B) and (C) the anomalous difference electron density map (red meshes) at the iron-binding site of the htf C-lobe, collected at 12662eV (selenium anomalous peak) and 7132eV (iron anomalous peak) are illustrated. Panel (D) and (E) are cartoon and stick representations of the tetra-coordinated water buried within the TbpB-hTf interface from the two complexes crystallized within the asymmetric unit. The point of view and the color code are similar as the Figure 2A. The blue mesh represents the electron density from the 2Fo-Fc contoured at 1.0 sigma, and green mesh represents of a 2Fo-Fc simulated annealing omit map contoured at 3 sigma calculated with the His349 occupancy set to 0. Within panel (D), the His349 omit map reveals a single conformation for H349 (that we describe as the major conformation) in coordination with the tetra-coordinated water from the heterodimeric complex composed of chains A/B, while the panel B shows continuous density for the two His349 conformations buried within the TbpB-hTf interface of chain C/D. In panel (F) we calculated the simulated annealing map using phenix.refine while setting the occupancies for the water and the 4 coordinating residues (His349[hTf], Asp149[TbpB], Lys206[TbpB] and His149[TbpB]) to 0. The green meshes represent the Fo-Fc simulated annealing map contoured at 2.0, 3.0, 4.0 and 5.0 sigma, respectively. Within panel (G) and (H) are represented the anomalous difference map (red meshes) at the water coordination site within the TbpB-hTf interface, collected at 12662eV and 7132eV respectively.
 and (B) are two orthogonal views of the crystal lattice from the Tf-unbound TbpB crystal in the P222 1 space group. In blue and yellow are represented the N and C lobes of TbpB.")
6 Supplementary Figure 3: Crystal packing within the apo-tbpb and TbpB-hTf crystals. (A) and (B) are two orthogonal views of the crystal lattice from the Tf-unbound TbpB crystal in the P222 1 space group. In blue and yellow are represented the N and C lobes of TbpB. The asymmetric unit dimer of TbpB is colored in purple. (B) and (C) are two orthogonal views of the crystal lattice from the Tf-bound TbpB crystal in the P space group. The transferrin is drawn in grey cartoon representation, and the TbpB N and C lobes are colored in blue and yellow. The only feature differentiating the Tf-bound to the unbound TbpB consists of a torsion rotation of 5.4 into the orthogonal lattice between the TbpB N and C-lobe, while this orientation has been shown to be conserved based on the three solved porcine pathogen TbpB structures determined (Calmettes et al.) 22. The Tf-unbound TbpB N-lobe contains extensive surface crystal contacts and has an overall lower B-factor than the C-lobe (B-factor of 35 and 89, respectively). The N and C lobe relative flexibility observed in the Tf-unbound NmM982 TbpB structures could result from the crystal packing that exposes the C-lobes to the large solvent channel, whereas the multiple crystal contacts within the Tf-bound TbpB structure prevents dynamic motion between lobes as reported by the overall N and C lobes B-factors (45 and 62, respectively). The N/C lobe orthogonal lattice flexibility observed between the two Tf-bound and unbound forms of TbpBs
7 represents more an intrinsic property of NmM982 TbpB than an induced conformational change driven by htf.
8
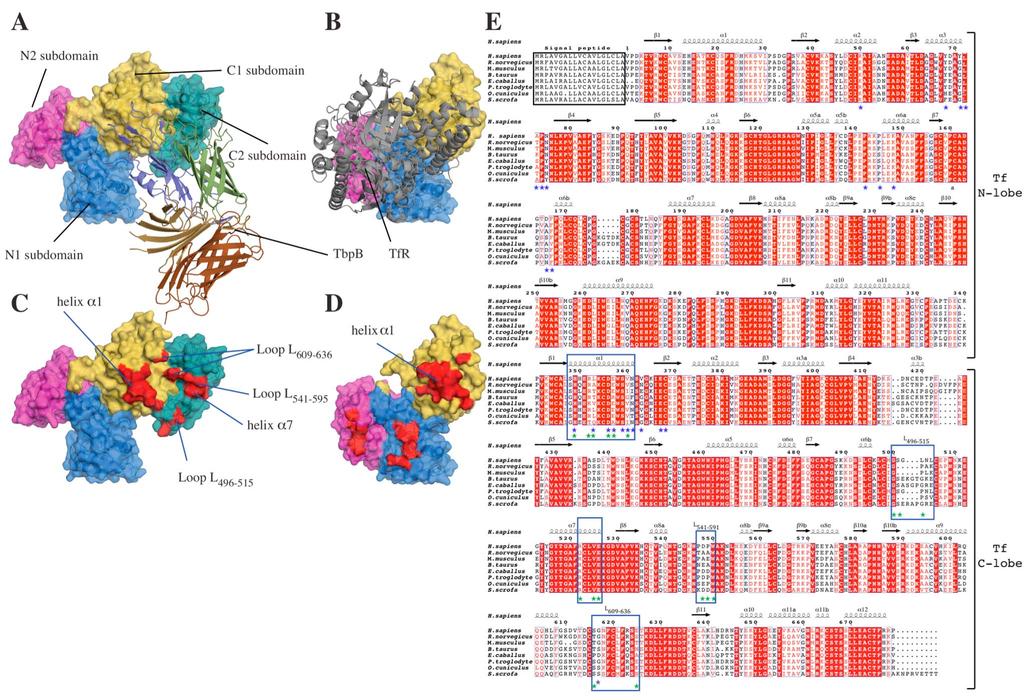
9 Supplementary Figure 4: TbpB and TfR binding sites overlap on htf. (A), (B) are surface and cartoon representation of the TbpB-hTf and htf/tfr (3VE1 and 3SL9 PDB code) complexes, respectively. These two complex structures are presented in the identical orientation, aligned on the N1 and C1 subdomains of htf. The htf is shown in surface representation, TbpB and TfR are drawn in cartoon representation. The color-coded domain definition of htf and TbpB are conserved from figure1, TfR is colored in grey. In panel (C) and (D), surface regions indicated in red are points of contact identified within the bacterial and mammalian receptor-htf complex structures (Note: the PDB coordinates 3VE1 was determined in this study and the C2 subdomain is absent from the Tf/TfR published structure 3SL9). (E) is a sequence alignment of eight mammalian serotransferrins. The secondary structure elements of htf are shown above the sequences according to the labeling nomenclature employed by Hall et al 23. Identical and conserved residues are highlighted red. The blue and green stars represent amino acids from htf that have been shown to interact with the human TfR or with NmM982 TbpB, respectively.
10 Supplementary Table 1: Data collection and refinement statistic for NmM982 TbpB and NmM982 TbpB-hTf complex. Data collection NmM982 TbpB NmM982 TbpB in complex with htf Space group P222 1 P Cell dimensions a, b, c (Å) 46.6, 149.3, , 153.5, a, b, g ( ) 90, 90, 90 90, 90, 90 Resolution (Å) ( ) ( ) R sym or R merge (0.50) 0.11 (0.64) I / σi 13.0 (1.9) 27.6 (4.0) Completeness (%) 93.4 (95.1) 100 (100) Redundancy 2.9 (2.7) 10.5 (10.7) Refinement Resolution (Å) No. reflections R work / R free 0.17/ /0.25 No. atoms Protein Glycerol Fe 0 2 Carbonate 0 8 Sulfate 35 0 Sodium 1 0 Acetate 4 0 Water B-factors Protein Ligand/ion Water R.m.s deviations Bond lengths (Å) Bond angles ( ) *Highest resolution shell is shown in parenthesis
11 Supplementary Table 2: Contact residues in the interface of TbpB and htf α α α α α α β α α α β β β β β β β β α β β α β α β α β α β β β β β α β α * Salt bridge (H 2 O) Bridging water
12 SUPPLEMENTARY METHODS Protein purification TbpB from Neisseria meningitidis M982 was overexpressed in E. coli Bl21 (DE3) as a maltosebinding protein fusion partner containing a polyhistidine tag and a TEV cleavage sequence site preceding the region encoding the mature TbpB protein. As the first 36 residues of M982 TbpB were predicted to form a flexible anchoring peptide, they were removed to aid in crystallization. Cells were grown in Terrific Broth medium at 37 C, and fusion protein expression was induced overnight at 25 C by addition of 0.5 mm IPTG. Cells were harvested at 5000 x g and resuspended in 100 ml of lysis buffer (25 mm Hepes ph 7.5, 200 mm NaCl) containing 1 mm phenylmethylsulfonyl fluoride (PMSF). Cells were lysed with two passes through a French Press and whole cells and cell debris were removed by centrifugation at x g. The supernatant fraction was loaded into a 5 ml HisTrap column (Amersham Pharmacia). The column was washed with 20 mm imidazole in lysis buffer and proteins of interest were eluted with 250 mm imidazole. Purified fusion proteins were dialyzed for 18 hours at 4 C (25 mm Hepes ph 7.5, 20 mm NaCl) in presence of 10 mg of his-tagged TEV protease. Dialyzed proteins were pooled and incubated 4 days at room temperature for TEV cleavage completion. Digested proteins were loaded onto a 5 ml HisTrap column: cleaved TbpB was collected in the flow-through and His-tagged MBP and TEV protease together with uncleaved fusion-proteins were collected together with 250 mm imidazole. Pure TbpB was concentrated to 21 mg/ml using a centrifugal filter (cut off 30 kda) then loaded into Superdex200 column in order to check sample homogeneity. Enzymatic Deglycosylation of Commercial Transferrin Human transferrin (htf) (Sigma) was dissolved in 100 mm ph 8.5 sodium phosphate buffer to a final concentration of 1 mg/ml. Iron-loaded htf was enzymatically deglycosylated with recombinant deglycosylation enzymes peptide-n-glycosidase F (PNGase F) and b-n-
13 acetylglucosidase (Endo) F1, endof2 and EndoF3 derived from Flavobacterium meningosepticum. Prior htf deglycosylation, small-scale analytical deglycosylation experiments were performed to determine the quantity of recombinant enzyme to add for preparative batches. Five hundred microliters each of PNGase F and Endo F1 preparations were added to 40 ml of the htf solution and incubated overnight at room temperature. The buffer was exchanged by cycles of concentration and dilution with an Amicon Ultra-30 centrifugal filter device to 100 mm sodium acetate ph 4.5. Five hundred microliters each of EndoF2 and EndoF3 enzymes preparations were added to the htf solution and incubated overnight at room temperature. Following the enzymatic treatments, the htf solution was subjected to a buffer exchange to 50 mm Tris-HCl ph 8.0 and concentrated to 40 mg/ml. The deglycosylation process was assessed by SDS-PAGE and Western analysis using Concanavalin A conjugated to horse radish peroxidase. TbpB-hTf complex formation Five milligrams of purified TbpB were mixed in a final volume of 300 μl with 5 mg of pure htf and left on ice for 30 minutes prior to gel-filtration chromatography using a Superdex200 column equilibrated with 25 mm Hepes ph 7.5. The heterodimeric TbpB-hTf complex elution was verified by elution volume compared to monomeric TbpB or htf single injections, and the complex elution peaks checked by SDS-PAGE. TbpB-hTf complex was concentrated using centrifugation (100kDa filter cut off) to 10 mg/ml. Solid phase binding assays Derivatives of M982-TbpB were used in solid phase binding assays to probe the interaction interface. Two microliters of varying concentration of M982-TbpB wild type, R199A and E222R mutants were spotted on nitrocellulose paper. After drying at room temperature, non-specific sites were blocked by incubation with 5% skim milk in PBS (10 mm sodium phosphate ph 7.2, 150 mm NaCl) for 1 hour at room temperature under gentle agitation. The membrane was washed with PBS (20 ml, three times) and then incubated with htf in PBS with 0.5% skim milk for 1 hour at
14 room temperature. The membrane was washed and incubated with primary rabbit antibody against htf, and washed in PBS and incubated with a secondary HRP-coupled anti-rabbit antibody for 1 hour under gentle agitation. The HRP was developed using a Western-Lightning Plus ECL from Perkin Elmer. Crystallization of TbpB and TbpB-hTf Purified M982-TbpB alone or in complex with htf were initially screened with 1:1 (protein:precipitant) ratio against the Index (Hampton research) and JSCG+ (Qiagen) suite commercial screen using sitting drop vapor diffusion at 10 and 20 mg/ml of TbpB , and 10 mg/ml of TbpB-hTf. TbpB crystals were observed in 2 M ammonium sulfate, 0.1 M sodium acetate ph 4.6, then optimized with a 2:1 ration sitting drop at 20 C in a precipitant condition composed of 1.9 M ammonium sulfate, 0.1M sodium citrate ph 4.5 and 10% (w/v) glycerol, yielding crystals in space group P TbpB-hTf clustered needle crystals were initially grown in 0.2 M sodium malonate and 20% (w/v) polyethylenglycol (PEG) 3350, and optimized using hanging drop vapor diffusion in 0.15 M sodium malonate, 0.1 M sodium cacodylate ph 6.5, 20% glycerol and 14% PEG3350 yielding single crystals in space group P Data collection and structure determination Crystallographic data was collected on crystals frozen at 105 K on beamline 24-ID-E to the NE- CAT facility at the Advance Photon Source (APS). Diffraction data set of TbpB bound and unbound to Tf were collected at a wavelength of using 1 oscillations with respectively 360 and 70 images. Data were processed with HKL to resolution of 2.95 and 2.15 Å for TbpB bound and unbound to htf. The first structural model for the protein complex was obtained by molecular replacement using PHASER 25, based on a combination of the AsH57 TbpB, the apo htf N-lobe, and the holo porcine transferrin C-lobe from the respective PDB entry 3PQU, 2HAU, and 1H76. The final model was generated following several rounds of model building and refinement using Coot 26 and Refmac5 27 program using non-crystallographic
15 symmetry (NCS) and pure TLS model, yielding a final R work /R free of 0.20/0.25. Unbound TbpB model was solved using molecular replacement based on the NmM982 TbpB structure from the TbpB-hTf complex prior several cycle of model building and refinement using the PHENIX software suite 28. TbpB was refined with NCS and TLS model yielding a final R work /R free of 0.17/0.21. A Ramachandran plot calculated 3.5% and 6.1% of residues in the allowed region and 0.1% and 0% as outlier, for TbpB-hTf and TbpB, respectively. The numbering of residues initiates with the first mature amino acid (Cis-1) remaining after signal peptide cleavage. REFERENCES 21. Moraes, T.F., Yu, R.H., Strynadka, N.C. & Schryvers, A.B. Insights into the bacterial transferrin receptor: the structure of transferrin-binding protein B from Actinobacillus pleuropneumoniae. Mol Cell 35, (2009). 22. Calmettes, C., Yu, R.H., Silva L.P., Curran D., Schriemer D.C., Schryvers A.B., Moraes T.F. Structural variations within the transferrin binding site on transferrin-binding protein B, TbpB. J Biol Chem 286, (2011). 23. Hall, D.R. et al. The crystal and molecular structures of diferric porcine and rabbit serum transferrins at resolutions of 2.15 and 2.60 A, respectively. Acta Crystallogr D Biol Crystallogr 58, (2002). 24. Otwinowski, Z. & Minor, W. Processing of X-ray diffraction data collected in oscillation mode. Methods in Enzymology 276, (1997). 25. McCoy, A.J. Solving structures of protein complexes by molecular replacement with Phaser. Acta Crystallogr D Biol Crystallogr 63, (2007). 26. Emsley, P. & Cowtan, K. Coot: model-building tools for molecular graphics. Acta Crystallogr D Biol Crystallogr 60, (2004). 27. Murshudov, G.N., Vagin, A.A. & Dodson, E.J. Refinement of macromolecular structures by the maximum-likelihood method. Acta Crystallogr D Biol Crystallogr 53, (1997). 28. Adams, P.D. et al. PHENIX: a comprehensive Python-based system for macromolecular structure solution. Acta Crystallogr D Biol Crystallogr 66, (2010).