SUPPLEMENTAL INFORMATION: 1. Supplemental methods 2. Supplemental figure legends 3. Supplemental figures
|
|
|
- Hilary Agnes Holt
- 5 years ago
- Views:
Transcription
1 Supplementary Material (ESI) for Lab on a Chip This journal is The Royal Society of Chemistry 2008 A microfluidics-based turning assay reveals complex growth cone responses to integrated gradients of substrate-bound ECM molecules and diffusible guidance cues SUPPLEMENTAL INFORMATION: 1. Supplemental methods 2. Supplemental figure legends 3. Supplemental figures SUPPLEMENTAL METHODS Control of valves and fluidic flow. The valves were actuated by pressure lines (30 psi) connected to off-device solenoid valves (Lee Company) that were controlled by custom Java software. Flow in the fluidic layer was driven by hydraulic height difference between the inlet and outlet. Actin and tubulin staining. Neurons cultured in micro-wells were fixed with 4% paraformaldehyde solution in PBS for 30 min at room temperature. After being thoroughly washed with PBS, neurons were then permeabilized with 0.1% Triton X-100 in PBS for 5 minutes at room temperature. Following another PBS wash, neurons were incubated with solution containing both Alexa Fluor 594 phalloidin (freshly prepared, 5 units/ml, Molecular Probes) and Oregon Green 488 Paclitaxel (freshly prepared, 5 µm, Molecular Probes) in methanol for 20 min at room temperature. After subsequent PBS wash, cultures were stored in a 4 o C refrigerator until the time of imaging. The stained growth cones were imaged with a Zeiss 200M inverted epifluorescence microscope using a 488/512nm (ex/em) filter set for visualizing the microtubule and a 572/628nm (ex/em) filter set for the actin. Confocal microscopy. Three dimensional montage images of the EGFP gradient inside the micro-well were sampled at 5 micron intervals, and acquired through the Zeiss LSM 510 NLO scanning confocal microscope with the 488 laser at the Integrated Imaging Center of Johns Hopkins University. Scanning electron microscopy. Glass micro-well samples were cross-sectioned, sputter coated with chromium, then imaged with a LEO field emission scanning electron microscope in the Johns Hopkins University School of Medicine Microscope Facility. SUPPLEMENTAL FIGURE LEGENDS Supplemental figure 1A. The definitions of the initial angle and turning angle. The reference axis in our analysis is the direction of the gradient, which is perpendicular to the direction of flow. The initial direction of extension is defined by the tangential direction of the distal 20 μm segment of the neurite right before the gradient is initiated. The angle between the initial direction and the axis is defined as the initial angle. The turning angle is defined as the
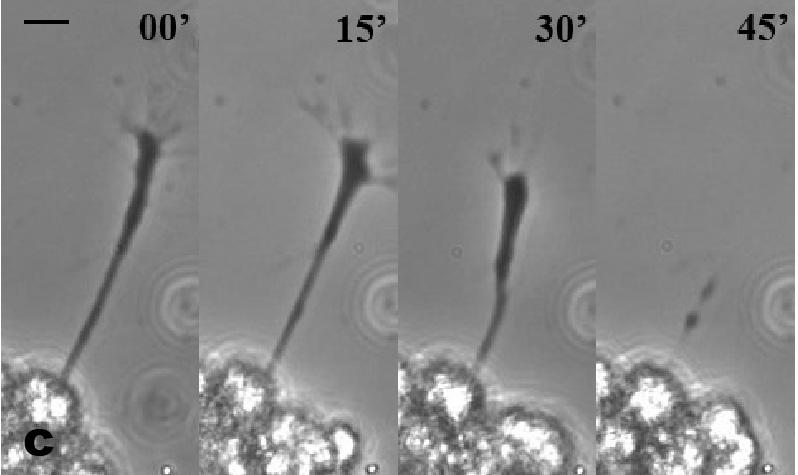
2 angle between the initial direction of neurite extension and the subsequent line connecting the center of the growth cone at the onset and at the end of the one-hour assay. Supplemental figure 1B. The soft-lithography process flow used for chip fabrication. (a) SU-8, a high-aspect ratio negative photoresist, was spin-coated onto a silicon wafer and (b) the mask patterns were lithographically transferred onto the photo-resist with an UV-aligner and following development, (c) resulting in precisely fabricated SU-8 microfeatures on the wafer. (d) This master was used as a mold for casting a ~5mm tall polydimethylsiloxane (PDMS) layer. (e) The elastomeric layer was released from the mold and laid flat on a clean glass coverslip, resulting in the final device. Supplemental figure 2. Neurite retraction following exposure to high shear stress. Timelapse images demonstrated the retraction of a neurite from an embryonic Xenopus spinal neuron following its exposure to a convective flow of 56.7 nl min -1 for indicated times. Scale bar: 10µm. Supplemental figure 3. Process flow of wet-etching micro-well on glass coverslip. (a) A glass coverslip was coated by thermal evaporation with layers of chromium/gold, and (b) spin-coated with SPR-220 positive photoresist. (c) Contact-printing with an UV-aligner transfers the mask design to the photoresist, followed by development. (d) Gold etchant and chromium etchant are then used to etch away the exposed metal areas not protected by the photoresist. (e) The glass coverslip is then wet etched in HF: HNO3: H2O (20:14:66 by percentage) to generate 100µmdeep micro-wells. (f)the etching masking tape is removed by hand peeling, and the masking layers are removed with acetone, gold etchant, and chromium etchant, respectively. Supplemental figure 4. Modeling the flow and diffusion in observation chamber using FEMLAB. (a) Model configuration. The model consists of a 30-µm high chamber incorporated with an array of 100-µm deep micro-wells. The flow is driven from the 5 inlets (the junctions of the pyramidal network with the chamber) to the outlet by constant pressure differential. The inflows, the output from repeated split and combinations within the pyramidal network, carry solutions with constant concentrations at various levels. (b) When the concentrations at the 5 inlets increases at a constant interval (0, 0.25, 0.5, 0.75 and 1 at the five inlets, respectively), a linear gradient can be generated throughout the chamber. The gradient is also preserved at the bottom of micro-wells. In the simulation shown here, the flow is driven by a pressure differential of 1 Pa; diffusion coefficient equals to 27µm 2 s -1. Supplemental figure 5. Verification of the uniformity of laminin coating. The cell culture surface in the observation chamber was coated with rhodamine-laminin, and imaged with fluorescent microscopy (expressed in arbitrary units). No gradient across the 2mm wide chamber was observed (data in well 4 was shown here). Supplemental figure 6. Transient time of gradient establishment in a micro-well. Using a FEMLAB simulation, the transient time to a steady-state gradient at the top slice (at the height of 0 µm using y-axis label convention in Fig. 1c) over 300 seconds was measured (upper panel). Similar analysis of the bottom slice (at the depth of -100µm; lower panel) suggested that the steady state was reached with less than 20 seconds delay compared to the top of the well.
3 Supplemental figure 7. The profiles of steady-state EGFP gradients at the bottoms of wells 2, 4, 6 and 8. EGFP (29kD) was applied for visualization of BDNF (27kD) gradient establishment using confocal microscopy in different wells. A well-defined linear gradient of EGFP was established in each well. Slight damping of gradient was observed at the downstream wells, probably due to passive diffusion. Supplemental figure 8. Multiple growth cones growing in micro-well(s). Multiple growth cones can be assayed in the same experiment. Typically, 1 to 5 growth cones can be located per micro-well and thus be assayed with precise linear gradient. The scale bar is 100 micrometer.
4 SUPPLEMENTAL FIGURES Supplemental figure 1A Supplemental figure 1B.

5 Supplemental figure 2 Supplemental figure 3.

6 Supplemental figure 4. a b
7 Supplemental figure 5
8 Supplemental figure 6 a. b.

9 Supplemental figure 7 Supplemental figure 8