Cell viability. Cell viability was examined by MTT assay (Sigma-Aldrich).
|
|
|
- Kimberly Mathews
- 5 years ago
- Views:
Transcription
1 Supplementary Materials Supplementary materials and methods Cell culture. Primary human dermal fibroblasts (DFs) were isolated from full-thickness skin samples. Tissue samples were dissected into small pieces and digested in DMEM with 1% (vol/vol) penicillin streptomycin, 5% (vol/vol) FBS (Gibco), type I collagenase (Worthington Biochemical Corporation) and DNase I (Roche Diagnostics) for up to 2 hours at 37 C. Cells were cultured in DMEM with 10% (vol/vol) FBS and 1% (vol/vol) penicillin streptomycin. Cells up to passage 2 were used for experiments. Cell viability. Cell viability was examined by MTT assay (Sigma-Aldrich). Immunoblot. Phosphoprotein-enriched fractions (eluate) and flow through were resolved by SDS-PAGE and analysed by western blotting using rabbit anti-human phospho-erk1/2 antibody (#4370), human phospho-p38 (#9211), human phospho-mkk3/mkk6 (#12280), human MKK3 (#8535) and human MKK6 (#8550) (Cell Signaling Technology), mouse 4G10 Platinum anti-phosphotyrosine antibody (# ; Millipore), rabbit anti-human - tubulin antibody (ab6046), rabbit anti-human PSMA6 antibody (ab97563), rabbit anti-human PSME1 antibody (ab140501), rabbit anti-human HSPA6 antibody (ab96754) (Abcam), rabbit anti-human DCD antibody (PA ; ThermoFisher Scientific) and rabbit anti-human COL1 antibody (H-197) (Santa Cruz Biotechnology). Cell extracts were analysed by western blotting using goat anti-human actin (I-19; Santa Cruz Biotechnology) and anti-human phospho-p38 (#9211, Cell Signaling Technology). Conditioned media from LPS- and FBGstimulated MDMs was analysed by western blotting using mouse anti-human MMP1 (ab25483; Abcam). Phosphoprotein gel staining. The Pro-Q Diamond Phosphoprotein Gel Stain (Molecular Probes) was used to selectively stain phosphoproteins in SDS-PAGE following manufacturer s instructions. Gels were visualized with a FLA-5100 Fluorescent Image Analyser (Fuji Photo Film Co) using excitation at 532 nm and a 580 nm longpass emission filter. Gels were then stained with silver stain for total protein. 1
2 Immunofluorescence. MDMs were plated on glass coverslips and stimulated with 1 M FBG or 1 ng/ml LPS. Cells were fixed with 4% (w/v) paraformaldehyde in TBS for 15 min at 4 C and permeabilised with 0.1% (v/v) Triton X-100 in TBS for 15 min at room temperature. Cells were incubated with blocking solution (5% (v/v) goat serum, 3% (w/v) BSA in TBS) for 1 hour at room temperature followed by incubation with anti-phospho-p38 (#9211, Cell Signaling Technology) diluted in blocking solution for 1 hour at room temperature. After washing 4xTBS, cells were incubated with Alexa Fluor 568-conjugated secondary anti-rabbit IgG (Molecular Probes, Eugene) diluted in blocking solution for 1 hour at room temperature and nuclei were stained with DAPI. After washing 4xTBS, cells were mounted onto glass slides using ProLong Gold Antifade Reagent (Invitrogen). Controls that were stained in the absence of primary antibody were included. Images were captured by fluorescence microscopy (Zeiss Axio ScopeA.1 light/fluorescent microscope and AxioCam HRc camera). Multichannel images were created using ImageJ software ( SEAP NF-kB activity assay. THP1-XBlue TM cells stably expressing a NF-kB and AP-1- inducible secreted embryonic alkaline phosphatase (SEAP) reporter gene (Invivogen) were cultured in RPMI 1640 supplemented with 10% (v/v) FBS (GIBCO), 100 U/ml penicillin/streptomycin (PAA), 100 g/ml Normocin (Invivogen) and 10 g/ml blasticidine S hydrochloride (Sigma). To monitor the activation of NF-kB signalling, cells were stimulated with 0.5 M FBG or 0.5 ng/ml LPS for 1, 4, 8 and 24 hours and secreted SEAP was measured by mixing 20 l of the culture medium with 180 l of QUANTI-Blue detection medium (Invivogen) and incubated for 2 hours at 37 C. Absorbance was measured at 620 nm with a FLUOstar Omega microplate reader (BMG Labtech). 2
3 Supplementary figures Supplementary figure 1. (A) ELISA of TNF- and IL-8 secreted by M-CSF-MDMs stimulated with 1 M of the FBG domain of tenascin-c or 1 ng/ml LPS for 24 hours. FBG and LPS were pre-incubated with medium alone or with 10 g/ml polymyxin B before being added to the cells. Data represent triplicate values from one experiment (mean ± SD). *** p<0.001 and ns, not significant, paired t test (B) MTT assay of M-CSF-MDMs stimulated with 0.001, 0.01, 0.1, 1 and 2 M FBG or 0.001, 0.01, 0.1, 1, 10 and 100 ng/ml LPS for 24 hours (mean ± SD). Data are representative of two independent experiments each with a different donor. 3
 Quantification of phosphoproteins enriched from cells lysates obtained from M-CSF-MDMs that were left unstimulated or stimulated with 1ng/ml LPS or 1 M of the FBG domain of tenascin-c for 30 min")
4 Supplementary figure 2. (A) Quantification of phosphoproteins enriched from cells lysates obtained from M-CSF-MDMs that were left unstimulated or stimulated with 1ng/ml LPS or 1 M of the FBG domain of tenascin-c for 30 min by Bradford protein assay. Data are shown as percentage of proteins in phosphoprotein enriched fractions relative to that of total cell lysate (n=4 donors per group; mean ± SEM). *** p<0.001 compared to control; ns, not significant, one-way ANOVA. Data are from four independent experiments, each with cells derived from a different donor. (B) Immunoblot analysis of phospho-erk1/2 (P-Erk1/2) in phosphoprotein enriched fraction (eluate; 1.5 g total protein loaded) and nonphosphorylated protein fraction (flow through; 1.5 g total protein loaded). M-CSF-MDMs were stimulated with 1ng/ml LPS for 30 min and cell lysates were subjected to IMAC to enrich phosphoproteins. (C) Immunoblot analysis of phosphotyrosine in phosphoprotein enriched fractions (eluate) and non-phosphorylated protein fraction (flow through) obtained from M-CSF-MDMs that were either left unstimulated (control) or stimulated with 1 M FBG or 1ng/ml LPS for 30 min. (D) Phosphoprotein (left panel) and total-protein (right panel) gel staining of phosphoprotein enriched fraction (eluate) and non-phosphorylated protein fraction (flow through). M-CSF-MDMs were stimulated with 1ng/ml LPS for 30 min and cell lysates were subjected to IMAC to enrich phosphoproteins. (E) Immunoblot analysis of -tubulin, PSMA6, PSME1, DCD, P-p38 and COL1 in phosphoprotein enriched fractions obtained from M-CSF-MDMs that were either left unstimulated (-) or stimulated with 1 M FBG or 1ng/ml LPS for 30 min. For western blots, results are representative of four independent experiments each with a different donor. 4
5 Supplementary figure 3. (A) Distribution of phosphoproteins differentially expressed in LPS- and FBG-stimulated M-CSF-MDMs using PANTHER classification system. Phosphoproteins were annotated and classified according to cellular component Gene Ontology (GO) terms (intracellular, GO: ; extracellular, GO: ). The pie charts display results as percentage of genes classified to a category against the total number of component and protein class hits, respectively. Component/class hit mean independent ontology terms. (B-C) Distribution of phosphoproteins differentially expressed in LPS- and FBG-stimulated M-CSF-MDMs using PANTHER classification system. Phosphoproteins 5
6 were annotated and classified according to protein class (H) and biological process (I) component Gene Ontology (GO) terms. The histograms display results as percentage of genes classified to a category against the total number of biological process hits, respectively. 6

7 Supplementary figure 4. (A) Sequences of human MAPK11 (p38 ) and MAPK14 (p38 ). N- and C-terminal regions flanking the protein kinase domain are highlighted in underlined, italic. Peptide sequences, which were found by MS analysis in this study, are highlighted in blue and experimentally observed phosphorylation sites, are highlighted in yellow. (B) 7
8 Immunoblot analysis of P-p38, p38 and actin in phosphoprotein enriched fractions (eluate) and non-phosphorylated protein fraction (flow through) obtained from M-CSF-MDMs that were either left unstimulated (-) or stimulated with 1 M of the FBG domain of tenascin-c or 1ng/ml LPS for 30 min. Results are representative of four independent experiments each with a different donor. (C) DAPI/phospho-p-38 or DAPI/no primary antibody doubleimmunofluorescence staining of M-CSF-MDMs 30 min after addition of media alone (-), 1 M FBG (pre-incubated with polymyxin B) or 1 ng/ml LPS. (D) Immunoblot analysis of phospho-mkk3/6 (P-MKK3/6), MKK3 and MKK6 in phosphoprotein enriched fractions obtained from M-CSF-MDMs that were either left unstimulated or stimulated with 1ng/ml LPS or 1 M FBG for 30 min. Results are representative of four independent experiments each with a different donor. (E) Measurement of NF-kB/AP-1 activation in THP1-XBlue TM cells upon stimulation with 1 M FBG (pre-incubated with polymyxin B) or 1ng/ml LPS for 1, 4, 8 and 24 hours (n=6; mean ± SEM). *p<0.05 and ****p< compared to 0, twoway ANOVA. (F) Immunoblot analysis of P-p38 and p38 in cell lysates obtained from M- CSF-MDMs that were not stimulated or 30 min after stimulation with 1ng/ml LPS in the presence or absence of 1, 10 or 25 g/ml polyclonal antibody specific for human TLR4 (PAb-h TLR4) or 1, 10 or 25 g/ml isotype control). Results are representative of two to four independent experiments each with a different donor. 8
9 9
10 10
11 11
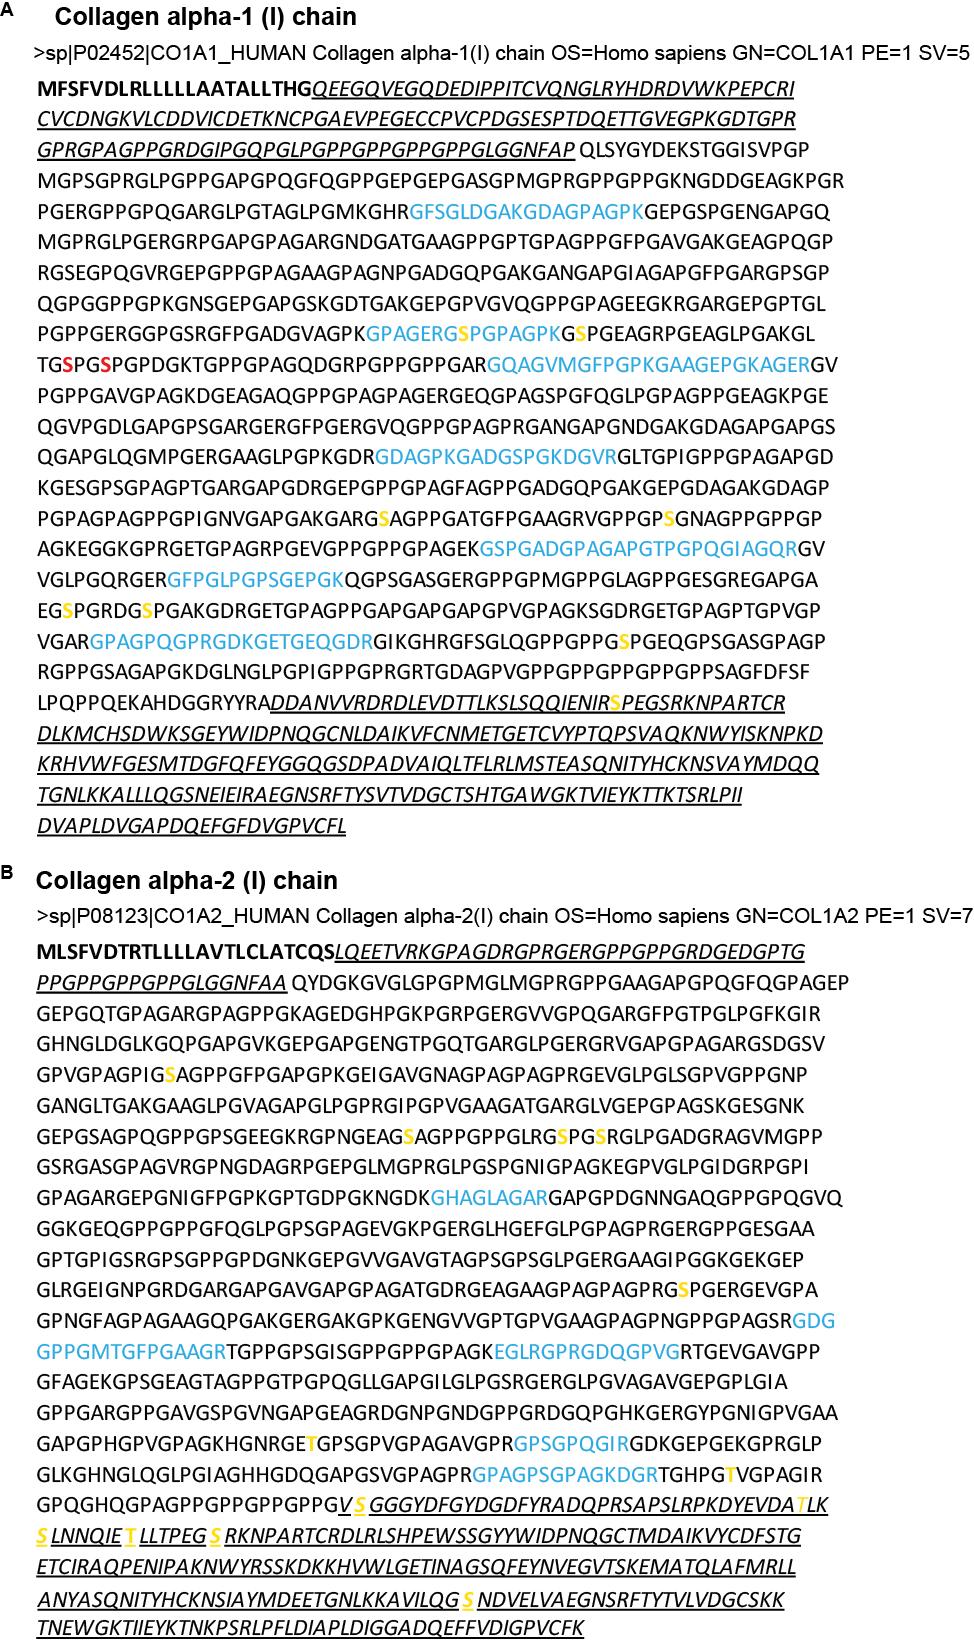
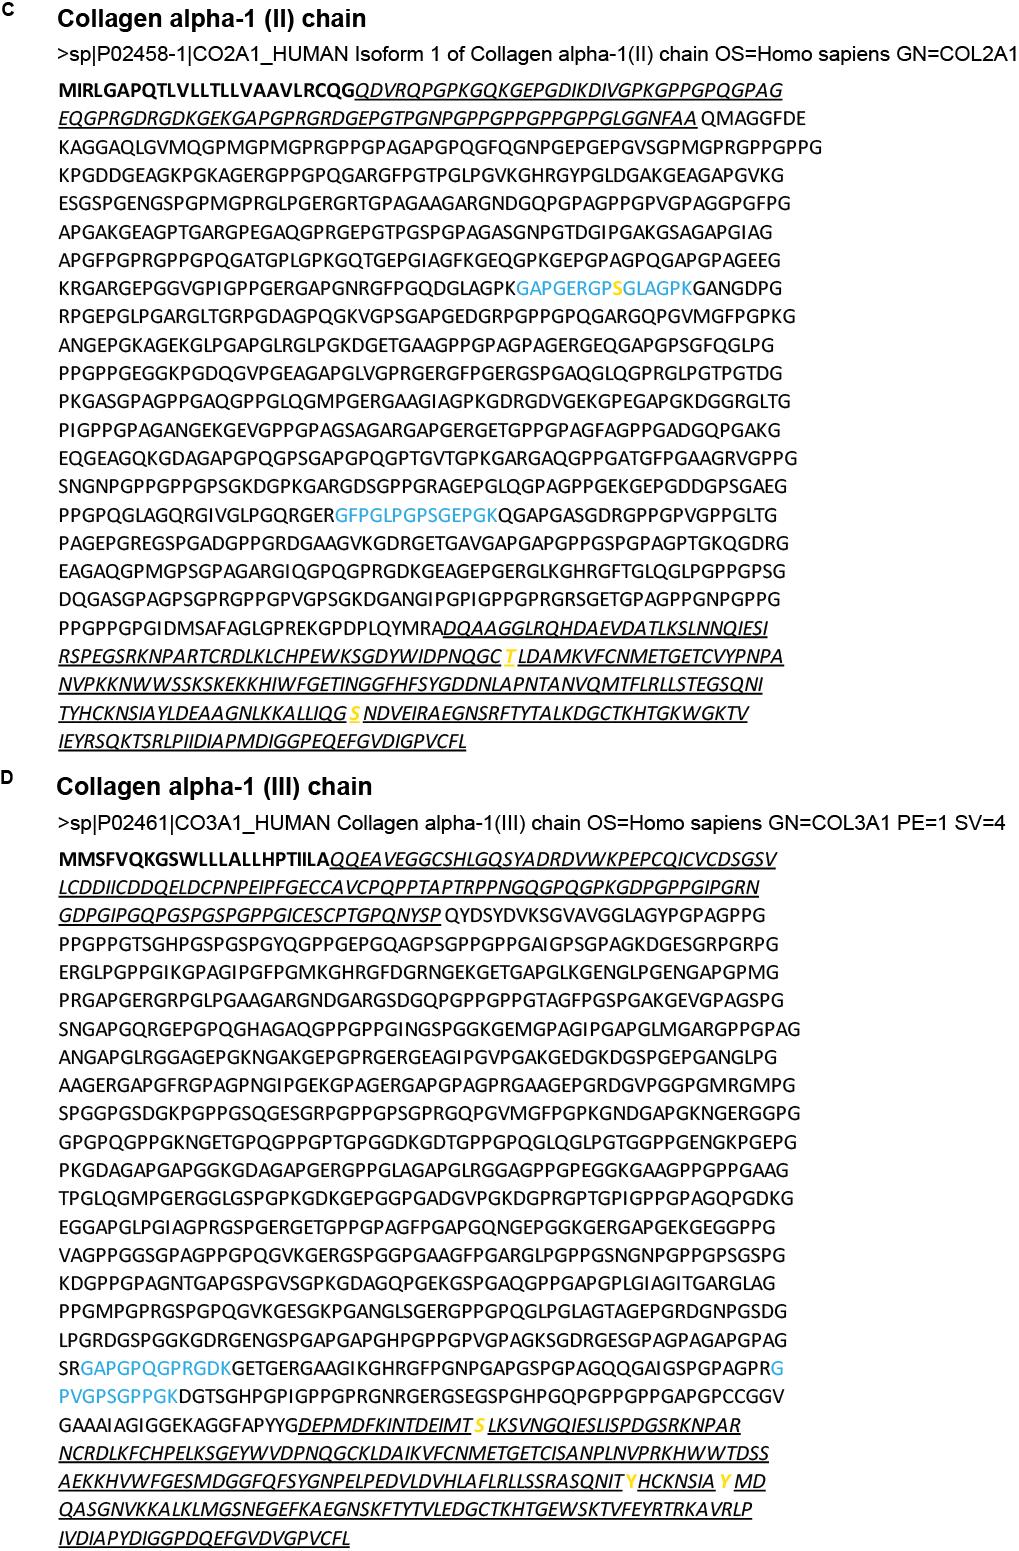
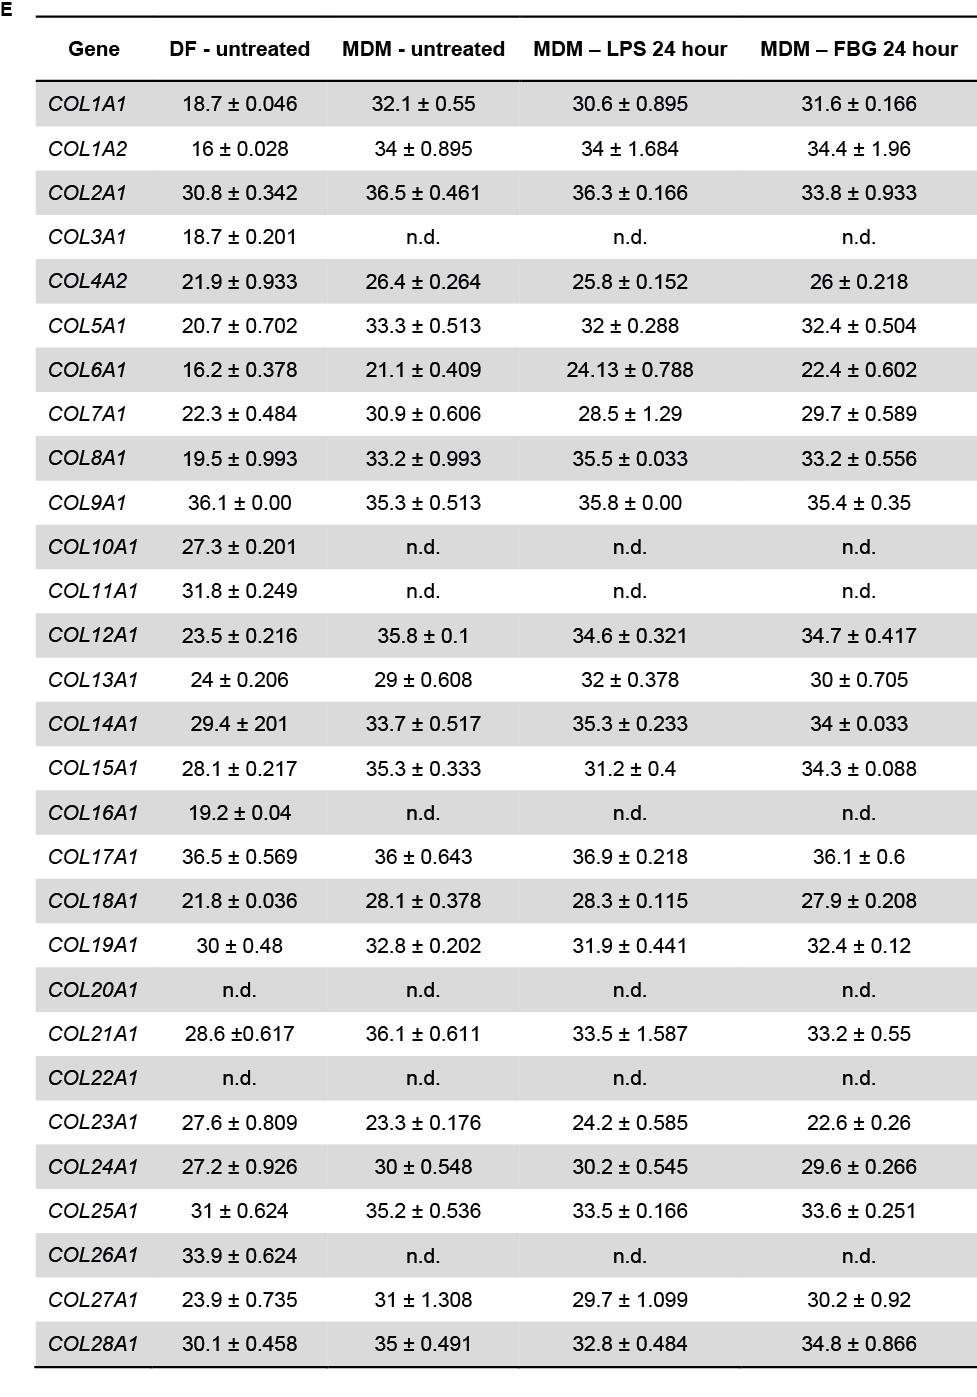
12 Supplementary figure 5. (A-D) Sequences of human COL1A1, COL1A2, COL2A1 and COL3A1. Signal peptide sequences are highlighted in bold and N- and C-terminal propeptide sequences in underlined, italic. Peptide sequences, which were found by MS analysis in this study, are highlighted in blue and experimentally observed phosphorylation sites, which were retrieved using PhosphoSitePlus, are highlighted in yellow. (E) CT (threshold cycle) values obtained from quantitative RT-PCR analysis of collagen 1-28 mrna in human dermal fibroblasts (DF) and M-CSF-MDMs non-stimulated or stimulated with 1ng/ml LPS or 1 M of the FBG domain of tenascin-c (pre-incubated with polymyxin B) for 24 hours. n.d., not detected (n=3; mean ± SEM). Data are from three independent experiments each with cells derived from a different donor. (F) Quantitative RT-PCR analysis of collagen 1-28 in M- CSF-MDMs stimulated with 1 M FBG (pre-incubated with polymyxin B) or 1ng/ml LPS for 1.5, 4, 8 and 24 hours. Results are presented relative to those of non-stimulated cells (n=3; mean ± SEM). p*<0.05, p**<0.01, p***<0.001 and p****<0.0001, one-way ANOVA. 12
 or 1ng/ml")
13 Supplementary figure 6. Immunoblot analysis of MMP1 in M-CSF-MDMs supernatants 8 and 24 hours after stimulation with 1 M of the FBG domain of tenascin-c (pre-incubated with polymyxin B) or 1ng/ml LPS. Recombinant human pro-mmp1 as positive control (C). Results are representative of three independent experiments each with a different donor. 13