For gel-shift assays, 2 ul ivtt synthesized protein (Promega) was incubated at room temperature
|
|
|
- Barbra Sharp
- 5 years ago
- Views:
Transcription
1 Supplementary Material and Methods EMSA For gel-shift assays, 2 ul ivtt synthesized protein (Promega) was incubated at room temperature for 30 min in a 15 ul volume containing 15 mm Tris-HCl (ph 7.5), 6.5% glycerol, 90 mm KCl, 0.7 mm EDTA, 0.2 mm DTT, 1 mg/ml bovine serum albumin, 500 ng salmon sperm DNA and 1 fmol radiolabeled probe. Probes 1-4 were generated by PCR using 258/-2.5CAT as template. Primer sequences are shown in Supplementary Table 1. Primer combinations were: probe 1 (A and F), probe 2 (A and C), probe 3 (B and E) and probe 4 (D and F). PCR products were gelpurified and heated to 70 C before labeling. Probes 5 and 6 were double-stranded oligonucleotides. Probes 1-6 and double-stranded PRS9 were labeled using T4 polynucleotide kinase. For supershifts, 0.5 µg antibody (6-His or HA.11, Covance) was added after 10 min of incubation. DNA-protein complexes were resolved on 5% polyacrylamide gels in 0.5X Tris/borate/EDTA-buffer. Gels were dried and exposed to X-ray film. MyoD immunoprecipitation and CIP treatment Cells were washed twice with cold PBS and lysed for 30 min on ice with modified RIPA (150 mm NaCl, 50 mm Tris-HCl (ph 7.4), 1% NP40, 0.25% sodium deoxycholate, 1 mm EGTA, 1 mm PMSF, 1 µg/ml aprotinin, 1 µg/ml leupeptin, 1 µg/ml pepstatin, 1 mm NaF, 1 mm sodium orthovanadate). Lysates were collected, sonicated for 20 s and centrifuged at 15000g for 10 min. For IP, 500 µg (IP only) or 2 mg (IP plus CIP treatment) of total protein in equal volume (500/1000 ul) was pre-cleared by incubating with 2/4 µg of rabbit IgG (Santa Cruz) for 20 min at 4 C, followed by incubating for an additional 60 min with 20/40 µl of Protein A-Agarose (Santa 1
2 Cruz). The slurry was centrifuged for 5 min at 1000g, and the supernatant was incubated with 10/20 µl of rabbit polyclonal M-318 MyoD antibody (Santa Cruz) for 1 h. 20/40 µl of Protein A- Agarose was then added and the slurry incubated overnight. The beads were washed twice with modified RIPA, resuspended in SDS-PAGE sample buffer, and processed for Western blot analysis using the MoAb 5.8A MyoD antibody (BD PharMingen). To CIP treat the immunoprecipitates, the beads were washed twice with modified RIPA without phosphatase inhibitors and divided into two equal aliquots. The beads were then resuspended in phosphatase buffer (10 mm Tris-HCl (ph 8), 1 mm MgCl 2, 1 mm PMSF, 1 µg/ml aprotinin) either with or without 50 U/ml CIP (New England Biolabs), incubated at 50 C for 1 h and analyzed as described. 2
3 Supplementary Table 1. Description of parental cell lines and transduced populations created in this study. Cell Line Description ARMS Cell Lines: RH30 a RH28 a JR b RMZ-RC2 c ARMS cell line that expresses the PAX3-FKHR fusion protein. ARMS cell line that expresses the PAX3-FKHR fusion protein. ARMS cell line that expresses the PAX3-FKHR fusion protein. ARMS cell line that expresses the PAX7-FKHR fusion protein. Parental Cell Lines: C2F3 d NIH3T3 293A e Mouse myoblast cell line, a derivative of the well-characterized C2C12 cell line. Mouse embryonic fibroblast cell line. Human embryonal kidney cell line, a derivative of the well-characterized HEK293 cell line. Single-Transduced Populations: (independent populations are further designated 1, 2, etc.). 3T3-V 3T3-P3F 3T3-P 3T3-MyoD 293A-V 293A-P3F 293A-P NIH3T3 transduced with the MSCV-IRES-GFP retroviral vector. NIH3T3 transduced with human PAX3-FKHR (from MSCV-IRES-GFP). NIH3T3 transduced with human PAX3 (from MSCV-IRES-GFP). NIH3T3 transduced with mouse MyoD (from MSCV-IRES-GFP). 293A transduced with the MSCV-IRES-GFP retroviral vector. 293A transduced with human PAX3-FKHR (from MSCV-IRES-GFP). 293A transduced with human PAX3 (from MSCV-IRES-GFP). Double-Transduced Populations: V1-BP V1-MyoD P3F1-BP P3F1-MyoD 3T3-V1 (see above) transduced with the pbabe-puro retroviral vector. 3T3-V1 (see above) transduced with mouse MyoD (from pbabe-puro). 3T3-P3F1 (see above) transduced with the pbabe-puro retroviral vector. 3T3-P3F1 (see above) transduced with mouse MyoD (from pbabe-puro). a Douglass et al. (1987). Cytogenet Cell Genet 45: b Garvin et al. (1986). Am J Pathol 125: c Nanni et al. (1986). Br J Cancer 54: d Rastinejad and Blau (1993). Cell 72: e Graham et al. (1977). J Gen Virol 36:59-74.
4 Supplementary Table 2. Primers used for mutagenesis, EMSA, ChIP and quantitative RT-PCR. Name Sequence Reference * Mutagenesis: BU35/ΔTAD (selection) BU35 (mutagenic) ΔTAD (mutagenic) HD-C (mutagenic) 5 -CGAGCATGCATCGAGAGGGCCCTATTC-3 5 -GCCCAACCACATCCTCCACAAGATCGTGG-3 5 -ATGGGCCTTCTCCACCGTTAACAGCTCCCAAGTGACTTGGATGGC-3 5 -GGCTTTCAACCATCTCATTCCCG-3 5 -GCCAGTTCCTCCCTAGTATAAATGTC-3 EMSA: CE258A CE258B CE258C CE258D CE258E CE258F Probe 5 Probe 6 5 -CCACAGCAGTTGGGGGCATTTATGG-3 5 -TCTTTCAGCCAAGTATCCTCCTCC-3 5 -GAGCACTCTGGGAGATTAACCAGC-3 5 -AGCTTAAAACCCGTGACTCACAG-3 5 -ACGTATTGGAGGCAGCCACC-3 5 -CCCCAAACCTCAGGACTCAGTTG-3 5 -AGCTTAAAACCCGTGACTCACAGCACAGCCAG-3 5 -TGTGGGGGAGGGGGTGGCTGCCTCCAATACGT-3 ChIP: Human MyoD (core enhancer) 5 -GCCAAGTATCCTCCTCCAG-3 5 -CCCAAACCTCAGGACTCAGT-3 Human MyoD (upstream) 5 -GCCCACTCTCTGCTTGTA-3 5 -TGATGCCAACTTCTGCTCTG-3 RT-PCR: Human PAX3 5 -TTCCAACCCAGACAGCAG-3 Arden et al., GGAGAGCGCGTAATCAGT-3 Human PAX3-FKHR 5 -TCCAACCCCATGAACCCC-3 Peter et al., GCCATTTGGAAAACTGTGATCC-3 Mouse MyoD 5 -CCTAAGCGACACAGAACAGG-3 Graf Finckenstein et al., CTTTTGGGCGTGAAGAACC-3 Mouse myogenin 5 -AGACATGAGTGCCCTGACCT-3 5 -CGGCAGCTTTACAAACAACA-3 Mouse MHC 5 -GCAAAGACCCGTGACTTCACCTCTAG-3 Kruger et al., GCATGTGGAAAAGTGATACGTGG-3
5 Supplementary Table 2. Primers used for mutagenesis, EMSA, ChIP and quantitative RT-PCR (continued). Name Sequence Reference * RT-PCR: Mouse FGFR1 Mouse FGFR2 Mouse FGFR3 Mouse FGFR4 5 -ATGTGGGGCTGGAAGTGCCTCCT-3 5 -GTACGGTTGCTCTCCACCAGCTG-3 5 -GCGCTTCATCTGCCTGGTCT-3 5 -AGTCTCTAGGTGTGGCACCT-3 5 -GATGCTGAAAGATGATGCGACTG-3 5 -GTGGGTGTAGACTCGGTCAAAAAG-3 5 -ACCTGCTCCTCCAGTGACTC-3 5 -GAGAGAGGATCTGCGACAGC-3 Mouse GAPDH 5 -TGCGACTTCAACAGCAACTC-3 Graf Finckenstein et al., GCCTCTCTTGCTCAGTGTCC-3 Unless indicated, the primers were designed for these studies and not derived from previously published papers. Arden et al. (1996). Genes Chrom Cancer 16: ; Graf Finckenstein et al. (2006). Transgenic Res 15: ; Kruger et al. (2001). Development 128: ; Peter et al. (2001). Lab Invest 81:
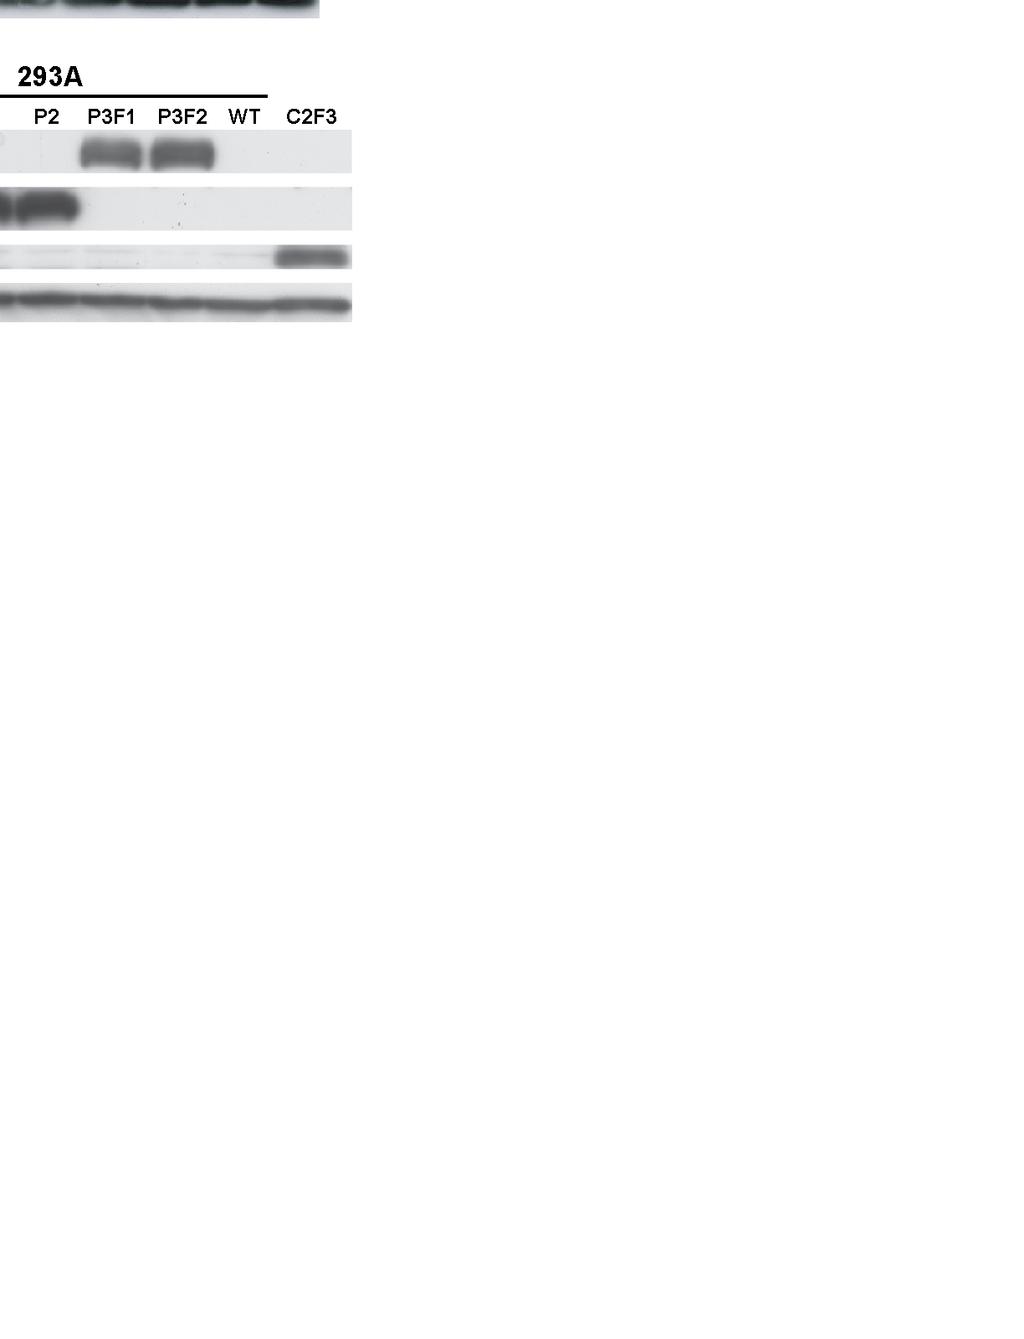
6 Supplementary Figure Legends Figure S1. The MyoD core enhancer contains PAX/PAX-FKHR consensus binding sites. Nucleotide sequences of the core enhancer from human, chimpanzee, mouse, rat and dog are shown in an alignment. Asterisks indicate conserved nucleotides across all species; nucleotides differing from the human sequence are shown in lowercase-bold. Spaces (-) were inserted to aid in the alignment. Putative paired domain (green) and homeodomain (yellow) binding sites on either the sense or antisense strand are highlighted. The PAX and PAX-FKHR binding sequences within probe 5 are in blue. Figure S2. Lack of endogenous MRF activation in PAX3 expressing NIH3T3, and PAX3-FKHR or PAX3 expressing 293A. (a) Western blot analysis of 3T3-P (P1-P4) populations. 3T3-V1 and 3T3-P3F1 were included for reference. Note that none of the 3T3-P populations express MyoD or myogenin, despite expressing PAX3 levels that were actually higher than PAX3-FKHR in P3F1. (b) Western blot analysis of vector (V1, V2), PAX3 (P1, P2) or PAX3-FKHR (P3F1, P3F2) transduced 293A populations. PAX3 and PAX3-FKHR were detected using an HA antibody and are shown on separate panels due to size differences, but images were obtained from the same exposure and processed equally. C2F3 was included for reference. Figure S3. MyoD is hyperphosphorylated in all 3T3-P3F populations grown in DM. MyoD Western blot analysis of the four 3T3-MyoD (MyoD1-MyoD4) and four 3T3-P3F (P3F1-P3F4) populations. β-actin serves as a loading control. Note that all of the 3T3-P3F populations express 1
7 equivalent amounts of both MyoD forms in GM, and predominantly the slower migrating form in DM. Figure S4. Correct nuclear expression of MyoD and myogenin. 3T3-V1, 3T3-P3F1 and 3T3- MyoD1 were grown in DM for 3 days, after which MyoD and myogenin expression was determined by immunofluorescence (red). Nuclei were visualized with DAPI (blue). Figure S5. PAX-FKHR de-regulate developmental pathways regulated by PAX3 and PAX7. (a) The hierarchy of Pax3, MyoD, myogenin and Met during myogenesis is shown. Pax3 lies upstream of MyoD and myogenin in the activation of skeletal muscle differentiation, and regulates the migration of muscle precursors into the limb bud through Met. (b) PAX-FKHR determine the muscle phenotype of ARMS by inducing MyoD and myogenin expression in an undefined precursor cell. PAX-FKHR expressing cells do not undergo terminal differentiation due to attenuation of MyoD transcriptional activity via phosphorylation, absence of cell cycle arrest, and increased proliferation. Altered cell cycle control and enhanced growth also result from oncogene activation and loss of tumor suppressor function. Aberrant regulation of Met by PAX-FKHR contributes to the metastatic phenotype of ARMS. 2


8


9
10

11
12