Chapter 2 Mendelian Genetics
|
|
|
- Cecily Burke
- 5 years ago
- Views:
Transcription
1 Chapter 2 Mendelian Genetics Synopsis: The first part of Chapter 2 covers the basic principles of inheritance that can be summarized as Mendel s Laws of Segregation (for one gene) and Independent Assortment (for more than one gene). You will see in chapter 3 how these laws relate to chromosome segregation during meiosis. In the second part of Chapter 2, we see that the relationship between genotype and phenotype can be more complicated than envisaged by Mendel. Alleles do not have to be completely dominant or recessive with respect to each other. Not all genotypes are equally viable. Genes can have more than two alleles in a population. One gene can govern more than one phenotype. A single phenotype can be influenced by more than one gene, and these genes can interact in a variety of ways. Despite these complications, the alleles of individual genes still segregate according to Mendel s Law of Segregation, and different pairs of genes still usually behave as dictated by Mendel s Law of Independent Assortment. Key Terms: genes and alleles of genes a gene determines a trait; and there are different alleles or forms of a gene. The colour gene in pea has two alleles: the yellow allele and the green allele. genotype and phenotype genotype is the genetic makeup of an organism (written as alleles of specific genes), while phenotype is what the organism looks like. homozygous and heterozygous when both alleles of a gene are the same, the individual is homozygous for that gene (or pure-breeding). If the two alleles are different, the organism is heterozygous (also called a hybrid). dominant and recessive the dominant allele is the one that controls the phenotype in the heterozygous genotype; the recessive allele controls the phenotype only in a homozygote since its effect is hidden or masked when the dominant allele is present. monohybrid or dihybrid cross a cross between individuals who are both heterozygous for one gene (monohybrid) or for two genes (dihybrid). testcross performed to determine whether or not an individual with the dominant trait is homozygous or heterozygous; an individual with the dominant phenotype but unknown genotype is crossed with an individual with the recessive phenotype. wild-type alleles alleles with a frequency equal to or greater than 1 percent in the population. Colloquially, wild-type alleles are the normal alleles found most commonly in the population McGraw-Hill Education Ltd.
2 mutant alleles rare alleles with a frequency of less than 1 percent in the population. monomorphic gene a gene with only one common, wild-type allele. polymorphic gene a gene with many wild-type alleles. The wild-type alleles of a polymorphic gene are often called common variants. incomplete dominance and codominance cases in which the phenotype of heterozygotes is different than that of either type of homozygote. Incomplete dominance describes alleles where the heterozygote has a phenotype that is in between that of either homozygote, but typically is more similar to one parent than to the other, while heterozygotes for codominant alleles have both of the phenotypes associated with each homozygote. Usually in incomplete dominance one allele is nonfunctional or only partially functional, while in codominance both alleles are fully functional. recessive lethal allele an allele (usually a loss-of-function allele) of an essential gene necessary to the survival of the individual. A zygote homozygous for a recessive lethal allele cannot survive and thus is not detected among the progeny of a cross. dominance series of multiple alleles Although each individual has only two alleles of a gene, many alleles of the gene may exist in the population. These alleles may be completely dominant, incompletely dominant, or codominant with respect to each other as determined by the phenotype of heterozygotes for the particular pair. pleiotropy A gene may affect more than one phenotype. complementary gene action Function of two different genes is required to produce a phenotype. Nonfunctional recessive alleles of either gene can produce the same abnormal phenotype in homozygotes. Such a phenotype that can be caused by nonfunctional alleles of more than one gene is called a heterogeneous trait. epistasis An allele of one gene hides the effects of different alleles at a second gene. redundant genes Two or more genes provide the same function. penetrance the fraction of individuals with a particular genotype who display the genotype s characteristic phenotype. expressivity the degree to which an affected individual displays the phenotype associated with that individual s genotype. Expressivity of a genotype can vary due to environment, chance, and alleles of other genes (modifier genes). conditional mutation a change in the base sequence of a gene that affects gene function only under specific environmental conditions. continuous (quantitative) trait a trait whose phenotype varies over a wide range of values that can be measured. Continuous traits are polygenic they are controlled by the combined activities of many genes McGraw-Hill Education Ltd.
3 Key Ratios: 3:1 Ratio of progeny phenotypes in a cross between monohybrids [Aa Aa 3 A (dominant phenotype) : 1 aa (recessive phenotype)] 1:2:1 Ratio of progeny genotypes in a cross between monohybrids (Aa Aa 1 AA : 2 Aa : 1aa) 1:1 Ratio of progeny genotypes in a cross between a heterozygote and a recessive homozygote (Aa aa 1 Aa : 1aa) 1:0 All progeny have the same phenotype. Can result from several cases: [AA A (all dominant phenotype)] [aa aa aa (all recessive phenotype)] 9:3:3:1 Ratio of progeny phenotypes in a dihybrid cross (Aa Bb Aa Bb 9 A B : 3 A bb : 3 aa B : 1 aa) 1:2:1 Ratio of progeny genotypes and phenotypes in a cross between hybrids when there is incomplete dominance or codominance: (Aa Aa 1 AA : 2 Aa : 1aa) Note that in incomplete dominance and codominance, a new (third) phenotype will appear in the hybrids (Aa) of the F 1 generation. In the F 2 generation, this same phenotype must be the largest component of the 1:2:1 monohybrid ratio. 2:1 Ratio of progeny phenotypes observed in a cross between hybrids when one allele (A 1 ) is a recessive lethal allele that has a dominant effect on a visible phenotype: (Aa Aa 1 A 1 A 1 : 2 A 1 A 2 : 1 A 2 A 2 ) Note that in this case, homozygotes for the recessive lethal allele A 1 die (red colour), but A 1 A 2 heterozygotes have a phenotype different from A 2 A 2 homozygotes. Interactions of Two Genes: You should be able to recognize traits influenced by two genes as variations on the 9:3:3:1 ratio of genotypic classes resulting from a dihybrid cross. For your convenience, an abbreviated version of Table 2.4 summarizing these gene interactions is presented below. It is particularly useful to understand the concepts of complementary gene action, epistasis, and redundancy. If you are given the details of a biochemical pathway, you should be able to work out the ratios of phenotypes expected among the progeny of a cross. Note that you cannot go in the opposite 2017 McGraw-Hill Education Ltd.
4 direction: A particular ratio does not tell much about the underlying biochemistry. Thus, you should NOT try to memorize specific examples relating particular ratios to specific biochemical pathways. F 2 Genotypic Ratios from an F 1 Dihybrid Cross Gene interaction A- B- A- bb aa B- aa bb None: Four distinct F 2 Phenotypes Complementary: One dominant allele of each of two genes is necessary to produce the phenotype Recessive epistasis: Homozygous recessive allele of one gene masks both alleles of another gene Dominant epistasis I: Dominant allele of one gene hides effects of both alleles of another gene Dominant epistasis II: Dominant allele of one gene hides effects of dominant allele of another gene Redundancy: Only one dominant allele of either of two genes is necessary to produce phenotype F 2 Phenotypic Ratio :3:3: : :3: :3: : :1 Problem Solving: The essential component of solving most genetics problems is to DIAGRAM THE CROSS in a consistent manner. In most cases you will be given information about phenotypes, so the diagram would be: phenotype of one parent x phenotype of the other parent phenotype(s) of progeny The goal is to assign genotypes to the parents and then use these predicted genotypes to generate the genotypes, phenotypes, and ratios of progeny. If the predicted progeny match the observed data you were provided, then your genetic explanation is correct. The points listed below will be particularly helpful in guiding your problem solving: Remember that there are two alleles of each gene when describing the genotypes of individuals. But if you are describing gametes, remember that there is only one allele of each gene per gamete. You will need to determine whether a trait is dominant or recessive. Two main clues will help you answer this question McGraw-Hill Education Ltd.
5 o First, if the parents of a cross are true-breeding for the alternative forms of the trait, look at the phenotype of the F 1 progeny. Their genotype must be heterozygous, and their phenotype is thus controlled by the dominant allele of the gene. o Second, look at the F 2 progeny (i.e., the progeny of the F 1 hybrids). The 3/4 portion of the 3:1 phenotypic ratio indicates the dominant phenotype. You should recognize the need to set up a testcross (to establish the genotype of an individual showing the dominant phenotype by crossing this individual to a recessive homozygote). You must keep in mind the basic rules of probability: o Product rule: If two outcomes must occur together as the result of independent events, the probability of one outcome AND the other outcome occurring is the product of the two individual probabilities. So, the probability of getting a 4 on one die AND a 4 on the second die is the product of the two individual probabilities. o Sum rule: If there is more than one way in which an outcome can be produced, the probability of either one OR the other occurring is the sum of the two mutually exclusive individual probabilities. Remember that Punnett squares are not the only means of analyzing a cross; branchedline diagrams and calculations of probabilities according to the product and sum rules are more efficient ways of looking at complicated crosses involving more than one or two genes. You should be able to draw and interpret pedigrees. When the trait is rare, look in particular for vertical patterns of inheritance characteristic of dominant traits, and horizontal patterns that typify recessive traits. Check your work by assigning genotypes to all individuals in the pedigree and verifying that these make sense. The vocabulary problem (the first problem in the set) is a useful gauge of how well you know the terms most critical for your understanding of the chapter. In the first part of Chapter 2, the major goal was to determine which allele of a gene is dominant and which is recessive, and then to ascribe genotypes to various individuals or classes of individuals based on the ratio of progeny types seen in a cross. The challenges become more difficult in the second part of the chapter, but the first step in problem solving remains the same: You need to DIAGRAM THE CROSS in a consistent manner. The next steps are to answer the following questions: How many genes are involved in determining the phenotype? How many alleles of each gene are present? 2017 McGraw-Hill Education Ltd.
6 What phenotypes are associated with which genotypic classes? (The answer to this last question will help you understand the dominance relationships between the alleles of each gene and the interactions between alleles of traits determined by more than one gene.) The points listed below will be particularly helpful in guiding your problem solving: To distinguish between one gene and two gene traits, look for the number of phenotypic classes in the F 2 generation and the ratios in the F 2s among those classes. If a single gene is involved, there will be either two classes (3:1 or 2:1 if an allele is a recessive lethal) or three classes (1:2:1 in the cases of codominance or incomplete dominance). If two genes are involved, you could see two classes (9:7, 13:3, or 15:1) or three classes (9:3:4 or 12:3:1) or four classes (9:3:3:1). [Note: These ratios require that the P generation is true-breeding and that the F 1 crosses examined are between hybrids.] Understand that when there is codominance or incomplete dominance, a novel phenotype will appear in the F 1 generation. In the F 2 generation, this same phenotype must be the largest component of the 1:2:1 monohybrid ratio. If you see a series of crosses involving different phenotypes for a certain trait, for example coat colour, and each individual cross gives a monohybrid ratio (3:1 or 1:2:1), then all the phenotypes are controlled by one gene with many alleles that form an allelic series. You should write out the dominance hierarchy for this series (e.g., a = b > c ) to keep track of the relationships among the alleles. Thus, a is codominant or incompletely dominant to b and both a and b are completely dominant to c. Lethal alleles are almost always recessive because a zygote with a dominant lethal allele could not grow into an adult. (The only exceptions to this rule involve conditional lethal alleles that survive in some environments but not others.) On the basis of what you have learned in this chapter, you can recognize recessive lethal alleles if they are pleiotropic and show a dominant visible phenotype such that the monohybrid phenotypic ratio is 2 (dominant phenotype) : 1 (recessive phenotype). Remember that the 9:3:3:1 dihybrid F 2 phenotypic ratio and its variants represent various combinations of the genotypic classes 9 A B : 3 A bb : 3 aa B : 1 aa bb, where the dashed line ( ) indicates either a dominant or recessive allele. Based on the observed ratios, you should be able to tell which genotypic classes correspond to which phenotypes. Although you should not memorize the table on the previous page displaying these variants of 9:3:3:1, you should be able to consider whether particular biochemical explanations fit the ratios seen. Don t forget to use the product rule of probability to determine the proportions of genotypes or phenotypes for independently assorting genes 2017 McGraw-Hill Education Ltd.
7 Solutions to Problems: Vocabulary 2-1a. i. 4; ii. 3; iii. 6; iv. 7; v. 11; vi. 13; vii. 10; viii. 2; ix. 14; x. 9; xi. 12; xii. 8; xiii. 5; xiv b. i. 2; ii. 5; iii. 10; iv. 7; v. 6; vi. 8; vii. 11; viii. 3; ix. 4; x. 1; xi. 9. Section Background 2-2. Prior to Mendel, people held two basic misconceptions about inheritance. First was the common idea of blended inheritance: that the parental traits become mixed and forever changed in the offspring. Second, many thought that one parent contributes the most to an offspring s inherited features (e.g., some people thought they saw a fully formed child in a human sperm). In addition, people who studied inheritance did not approach the problem in an organized way. They did not always control their crosses. They did not look at traits with clear-cut alternative phenotypes. They did not start with pure-breeding lines. They did not count the progeny types in their crosses. For these reasons, they could not develop the same insights as did Mendel There are several advantages to using peas for the study of inheritance. (1) Peas have a fairly rapid generation time (at least two generations per year if grown in the field, three or four generations per year if grown in greenhouses). (2) Peas can either self-fertilize or be artificially crossed by an experimenter. (3) Peas produce large numbers of offspring (hundreds per parent). (4) Peas can be maintained as pure-breeding lines, simplifying the ability to perform subsequent crosses. (5) Because peas have been maintained as inbred stocks, two easily distinguished and discrete forms of many traits are known. (6) Peas are easy and inexpensive to grow. In contrast, studying genetics in humans has several disadvantages. (1) The generation time of humans is very long (roughly 20 years). (2) There is no self-fertilization in humans, and it is not ethical to manipulate crosses. (3) Humans produce only a small number of offspring per mating (usually one) or per parent (almost always fewer than 20). (4) Although people who are homozygous for a trait do exist (analogous to pure-breeding stocks), homozygosity cannot be maintained because mating with another individual is needed to produce the next generation. (5) Because human populations are not inbred, most human traits show a continuum of phenotypes; only a few traits have two very distinct forms. (6) People require a lot of expensive care to "grow". There is nonetheless one major advantage to the study of genetics in humans: Because many inherited traits result in disease syndromes, and because the world's population now exceeds 7 billion 2017 McGraw-Hill Education Ltd.
8 people, a very large number of people with diverse, variant phenotypes can be recognized. These variations are the raw material of genetic analysis. Section 2.2 Genetic Analysis According to Mendel 2-4. a. Two phenotypes are seen in the second generation of this cross: normal and albino. Thus, only one gene is required to control the phenotypes observed. b. Note that the phenotype of the first generation progeny is normal colour, and that in the second generation, there is a ratio of 3 normal : 1 albino. Both of these observations show that the allele controlling the normal phenotype (A) is dominant to the allele controlling the albino phenotype (a). c. In a testcross, an individual showing the dominant phenotype but that has an unknown genotype is mated with an individual that shows the recessive phenotype and is therefore homozygous for the recessive allele. The male parent is albino, so the male parent s genotype is aa. The normalcoloured offspring must receive an A allele from the mother, so the genotype of the normal offspring is Aa. The albino offspring must receive an a allele from the mother, so the genotype of the albino offspring is aa. Thus, the female parent must be heterozygous Aa Because two different phenotypes result from the mating of two cats of the same phenotype, the short-haired parent cats must have been heterozygous. The phenotype expressed in the heterozygotes (the parent cats) is the dominant phenotype. Therefore, short hair is dominant to long hair a. Two affected individuals have an affected child and a normal child. This outcome is not possible if the affected individuals were homozygous for a recessive allele conferring piebald spotting, and if the trait is controlled by a single gene. Therefore, the piebald spotting trait must be the dominant phenotype. b. If the trait is dominant, the piebald parents could be either homozygous (PP) or heterozygous (Pp). However, because the two affected individuals have an unaffected child (pp), they both must be heterozygous (Pp). A diagram of the cross follows: piebald x piebald 1 piebald : 1 normal Pp x Pp 1 Pp : 1 pp 2017 McGraw-Hill Education Ltd.
9 Note that although the apparent ratio is 1:1, this is not a testcross but is instead a cross between two monohybrids. The reason for this discrepancy is that only two progeny were obtained, so this number is insufficient to establish what the true ratio would be (it should be 3:1) if many progeny resulted from the mating You would conduct a testcross between your normal-winged fly (W-) and a short-winged fly that must be homozygous recessive (ww). The possible results are diagrammed here; the first genotype in each cross is that of the normal-winged fly whose genotype was originally unknown. WW x ww all Ww (normal wings) Ww x ww 1/2 Ww (normal wings) : 1/2 ww (short wings). (1:1 ratio) 2-8. First diagram the crosses: closed x open F 1 open F open : 59 closed F 1 open x closed 81 open : 77 closed The results of the crosses fit the pattern of inheritance of a single gene, with the open trait being dominant and the closed trait recessive. The first cross is similar to those Mendel did with purebreeding plants, although you were not provided with the information that the starting plants were truebreeding. The phenotype of the F 1 plants is open, indicating that open is dominant. The closed parent must be homozygous for the recessive allele. Because only one phenotype is seen among the F 1 plants, the open parent must be homozygous for the dominant allele. Thus, the parental cucumber plants were indeed true-breeding homozygotes. The result of the self-fertilization of the F1 plants shows a 3:1 ratio of the open : closed phenotypes among the F 2 progeny. The 3:1 ratio in the F 2 shows that a single gene controls the phenotypes and that the F 1 plants are all hybrids (i.e., they are heterozygotes). The final cross confirms that the F 1 plants from the first cross are heterozygous because this testcross yields a 1:1 ratio of open: closed progeny. In summary, all the data are consistent with the trait being determined by one gene with two alleles, and open being the dominant trait The dominant trait (short tail) is easier to eliminate from the population by selective breeding. The reason is you can recognize every animal that has inherited the short tail allele, because only one such dominant allele is needed to see the phenotype. If you prevent all the shorttailed animals from mating, then the allele would become extinct McGraw-Hill Education Ltd.
10 On the other hand, the recessive dilute coat colour allele can be passed unrecognized from generation to generation in heterozygous mice (who are carriers). The heterozygous mice do not express the phenotype, so they cannot be distinguished from homozygous dominant mice with normal coat colour. You could prevent the homozygous recessive mice with the dilute phenotype from mating, but the allele for the dilute phenotype would remain among the carriers, which you could not recognize a. The problem already states that only one gene is involved in this trait, and that the dominant allele is dimpled (D) while the recessive allele is nondimpled (d). Diagram the cross described in this part of the problem: nondimpled x dimpled proportion of F 1 with dimple? Note that the dimpled woman in this cross had a dd (nondimpled) mother, so the dimpled woman MUST be a heterozygote. We can thus rediagram this cross with genotypes: dd (nondimpled) x Dd (dimpled) 1/2 Dd dimpled : 1/2 dd nondimpled One half of the children produced by this couple would be dimpled. b. Diagram the cross: dimpled (D?) x nondimpled (dd) nondimpled (dd) F 1 Because they have a nondimpled child (dd), the husband must have a d allele to contribute to the offspring. The husband is thus of genotype Dd. c. Diagram the cross: dimpled (D?) x nondimpled (dd) eight F 1, all dimpled (D ) The D allele in the children must come from their father. The father could be either DD or Dd, but it is most probable that the father s genotype is DD. We cannot rule out completely that the father is a Dd heterozygote. However, if this was the case, the probability that all 8 children would inherit the D allele from a Dd parent is only (1/2) 8 = 1/ a. The only unambiguous cross is: homozygous recessive x homozygous recessive all homozygous recessive The only cross that fits this criteria is: dry x dry all dry. Therefore, dry is the recessive phenotype (ss) and sticky is the dominant phenotype (S ). b. A 1:1 ratio comes from a testcross of heterozygous sticky (Ss) x dry (ss). However, the sticky x dry matings here include both the Ss x ss AND the homozygous sticky (SS) x dry (ss) McGraw-Hill Education Ltd.
11 A 3:1 ratio comes from crosses between two heterozygotes, Ss x Ss. However, the sticky individuals are not only Ss heterozygotes but also SS homozygotes. Thus the sticky x sticky matings in this human population are a mix of matings between two heterozygotes (Ss x Ss), between two homozygotes (SS x SS), and between a homozygote and heterozygote (SS x Ss). The 3:1 ratio of the heterozygote cross is therefore obscured by being combined with results of the two other crosses Diagram the cross: black x red 1 black : 1 red No, you cannot tell how coat colour is inherited from the results of this one mating. In effect, this was a testcross a cross between animals of different phenotypes resulting in offspring of two phenotypes. This does not indicate whether red or black is the dominant phenotype. To determine which phenotype is dominant, remember that an animal with a recessive phenotype must be homozygous. Thus, if you mate several red horses to each other and also mate several black horses to each other, the crosses that always yield only offspring with the parental phenotype must have been between homozygous recessives. For example, if all the black x black matings result in only black offspring, black is recessive. Some of the red x red crosses (that is, crosses between heterozygotes) would then result in both red and black offspring in a ratio of 3:1. To establish this point, you might have to do several red x red crosses, because some of these crosses could be between red horses homozygous for the dominant allele. You could of course ensure that you were sampling heterozygotes by using the progeny of black x red crosses (such as that described in the problem) for subsequent black x black or red x red crosses a. 1/6 because a die has 6 different sides. b. There are three possible even numbers (2, 4, and 6). The probability of obtaining any one of these is 1/6. Because the 3 events are mutually exclusive, use the sum rule: 1/6 + 1/6 + 1/6 = 3/6 = 1/2. c. You must roll either a 3 or a 6, so 1/6 + 1/6 = 2/6 = 1/3. d. Each die is independent of the other, thus the product rule is used: 1/6 x 1/6 = 1/36. e. The probability of getting an even number on one die is 3/6 = 1/2 (see part b). This is also the probability of getting an odd number on the second die. This result could happen either of 2 ways you could get the odd number first and the even number second, or vice versa. Thus the probability of both occurring is 1/2 x 1/2 x 2 = 1/ McGraw-Hill Education Ltd.
12 f. The probability of any specific number on a die = 1/6. The probability of the same number on the other die =1/6. The probability of both occurring at the same time is 1/6 x 1/6 = 1/36. The same probability is true for the other 5 possible numbers on the dice. Thus the probability of any of these mutually exclusive situations occurring is 1/36 + 1/36 + 1/36 + 1/36 + 1/36 + 1/36 = 6/36 = 1/6. g. The probability of getting two numbers both over four is the probability of getting a 5 or 6 on one die (1/6 + 1/6 = 1/3) and 5 or 6 on the other die (1/3). The results for the two dice are independent events, so 1/3 x 1/3 = 1/ The probability of drawing a face card = 12 face cards / 52 cards = The probability of drawing a red card = 26 / 52 = 0.5. The probability of drawing a red face card = probability of a red card x probability of a face card = x 0.5 [or 6 red face cards / 52 cards] = a. The Aa bb CC DD woman can produce 2 genetically different eggs that vary in their allele of the first gene (A or a). She is homozygous for the other 3 genes and can only make eggs with the b C D alleles for these genes. Thus, using the product rule (because the inheritance of each gene is independent), she can make 2 x 1 x 1 x 1 = 2 different types of gametes: (A b C D and a b C D). b. Using the same logic, an AA Bb Cc dd woman can produce 1 x 2 x 2 x 1 = 4 different types of gametes: A (B or b) (C or c) d. c. A woman of genotype Aa Bb cc Dd can make 2 x 2 x 1 x 2 = 8 different types of gametes: (A or a) (B or b) c (D or d). d. A woman who is a quadruple heterozygote can make 2 x 2 x 2 x 2 = 16 different types of gametes: (A or a) (B or b) (C or c) (D or d). This problem (like those in parts a-c above) can also be visualized with a branched-line diagram. A B b C D A B C D d A B C d c D A B c D d A B c d C D A b C D d A b C d D A b c D c d A b c d a B b C D a B C D d a B C d c D a B c D d a B c d C D a b C D d a b C d D a b c D c d a b c d McGraw-Hill Education Ltd.
13 a. The probability of any phenotype in this cross depends only on the gamete from the heterozygous parent. The probability that a child will resemble the quadruply heterozygous parent is thus 1/2 A x 1/2 B x 1/2 C x 1/2 D = 1/16. The probability that a child will resemble the quadruply homozygous recessive parent is 1/2 a x 1/2 b x 1/2 c x 1/2 d = 1/16. The probability that a child will resemble either parent is then 1/16 + 1/16 = 1/8. This cross will produce 2 different phenotypes for each gene or 2 x 2 x 2 x 2 = 16 potential phenotypes. b. The probability of a child resembling the recessive parent is 0; the probability of a child resembling the dominant parent is 1 x 1 x 1 x 1 = 1. The probability that a child will resemble one of the two parents is = 1. Only 1 phenotype is possible in the progeny (dominant for all 4 genes), as (1) 4 = 1. c. The probability that a child would show the dominant phenotype for any one gene is 3/4 in this sort of cross (remember the 3/4 : 1/4 monohybrid ratio of phenotypes), so the probability of resembling the parent for all four genes is (3/4) 4 = 81/256. There are 2 phenotypes possible for each gene, so (2) 4 = 16 different kinds of progeny. d. All progeny will resemble their parents because all of the alleles from both parents are identical, so the probability = 1. There is only 1 phenotype possible for each gene in this cross; because (1) 4 =1, the child can have only one possible phenotype when considering all four genes a. The combination of alleles in the egg and sperm allows only one genotype for the zygote: aa Bb Cc DD Ee. b. Because the inheritance of each gene is independent, you can use the product rule to determine the number of different types of gametes that are possible: 1 x 2 x 2 x 1 x 2 = 8 types of gametes (as in problem 2-15). To figure out the types of gametes, consider the possibilities for each gene separately and then the possible combinations of genes in a consistent order. For each gene the possibilities are: a, (B : b), (C : c), D, and (E : e). The possibilities can be determined using the product rule. Thus for the first 2 genes [a] x [B : b] gives [a B : a b] x [C : c] gives [a B C : a B c : a b C : a b c] x [D] gives [a B C D : a B c D : a b C D : a b c D] x [E : e] gives [a B C D E : a B C D e : a B c D E : a B c D e : a b C D E : a b C D e : a b c D E : a b c D e]. This problem can also be visualized with a branched-line diagram: 2017 McGraw-Hill Education Ltd.
14 a B b C c C c D D D D D D D D E e E e E e E e a B C D E a B C D e a B c D E a B c D e a b C D E a b C D e a b c D E a b c D e The first two parts of this problem involve the probability of occurrence of two independent traits: the sex of a child and galactosaemia. The parents are heterozygous for galactosaemia, so there is a 1/4 chance that a child will be affected (that is, homozygous recessive). The probability that a child is a girl is 1/2. The probability of an affected girl is therefore 1/4 x 1/2 = 1/8. a. Fraternal (non-identical) twins result from two independent fertilization events and therefore the probability that both will be girls with galactosaemia is the product of their individual probabilities (see above); 1/8 x 1/8 = 1/64. b. For identical twins, one fertilization event gave rise to two individuals. The probability that both are girls with galactosaemia is 1/8. For parts c-g, remember that each child is an independent genetic event. The sex of the children is not at issue in these parts of the problem. c. Both parents are carriers (heterozygous), so the probability of having an unaffected child is 3/4. The probability of 4 unaffected children is 3/4 x 3/4 x 3/4 x 3/4 = 81/256. d. The probability that at least one child is affected is all outcomes except the one mentioned in part c. Thus, the probability is 1-81/256 = 175/256. Note that this general strategy for solving problems, where you first calculate the probability of all events except the one of interest, and then subtract that number from 1, is often useful for problems where direct calculations of the probability of interest appear to be very difficult. e. The probability of an affected child is 1/4 while the probability of an unaffected child is 3/4. Therefore 1/4 x 1/4 x 3/4 x 3/4 = 9/256. f. The probability of 2 affected and 1 unaffected in any one particular birth order is 1/4 x 1/4 x 3/4 = 3/64. There are 3 mutually exclusive birth orders that could produce 2 affected and 1 unaffected unaffected child first born, unaffected child second born, and unaffected child third born. Thus, there is a 3/64 + 3/64 + 3/64 = 9/64 chance that 2 out of 3 children will be affected. g. The phenotype of any particular child is independent of all others, so the probability of an affected child is 1/ McGraw-Hill Education Ltd.
15 2-19. Diagram the cross, where P is the normal pigmentation allele and p is the albino allele: normal (P?) x normal (P?) albino (pp) An albino must be homozygous recessive pp. The parents are normal in pigmentation and therefore could be PP or Pp. Because they have an albino child, both parents must be carriers (Pp). The probability that their next child will have the pp genotype is 1/ Diagram the cross: yellow round x yellow round 156 yellow round : 54 yellow wrinkled The monohybrid ratio for seed shape is 156 round : 54 wrinkled = 3 round : 1 wrinkled. The parents must therefore have been heterozygous (Rr) for the pea shape gene. All the offspring are yellow and therefore have the Yy or YY genotype. The parent plants were Y Rr x YY Rr (that is, you know at least one of the parents must have been YY) Diagram the cross: smooth black x rough white F 1 rough black F 2 8 smooth white : 25 smooth black : 23 rough white : 69 rough black a. Since only one phenotype was seen in the first generation of the cross, we can assume that the parents were true-breeding, and that the F1 generation consists of heterozygous animals. The phenotype of the F 1 progeny indicates that rough and black are the dominant phenotypes. Four phenotypes are seen in the F 2 generation so there are two genes controlling the phenotypes in this cross. Therefore, R = rough, r = smooth; B = black, b = white. In the F2 generation, consider each gene separately. For the coat texture, there were = 33 smooth : = 92 rough, or a ratio of ~1 smooth : ~3 rough. For the coat colour, there were = 31 white : = 94 black, or about ~1 white : ~3 black, so the F 2 progeny support the conclusion that the F1 animals were heterozygous for both genes. b. An F1 male is heterozygous for both genes, or Rr Bb. The smooth white female must be homozygous recessive; that is, rr bb. Thus, Rr Bb x rr bb 1/2 Rr (rough) : 1/2 rr (smooth) and 1/2 Bb (black) : 1/2 bb (white). The inheritance of these genes is independent, so apply the product rule to find the expected phenotypic ratios among the progeny, or 1/4 rough black : 1/4 rough white : 1/4 smooth black : 1/4 smooth white Diagram the cross: 2017 McGraw-Hill Education Ltd.
16 YY rr X yy RR all Yy Rr 9/16 Y R (yellow round) : 3/16 Y rr (yellow wrinkled) : 3/16 yy R (green round) : 1/16 yy rr (green wrinkled). Each F 2 pea results from a separate fertilization event. The probability of 7 yellow round F 2 peas is (9/16) 7 = 4,782,969/268,435,456 = a. First diagram the cross, and then figure out the monohybrid ratios for each gene: Aa Tt x Aa Tt 3/4 A (achoo) : 1/4 aa (non-achoo) and 3/4 T (trembling) : 1/4 tt (nontrembling). The probability that a child will be A (and have achoo syndrome) is independent of the probability that it will lack a trembling chin, so the probability of a child with achoo syndrome but without trembling chin is 3/4 A x 1/4 tt = 3/16. b. The probability that a child would have neither dominant trait is 1/4 aa x 1/4 tt = 1/ The F1 must be heterozygous for all the genes because the parents were pure-breeding (homozygous). The appearance of the F1 establishes that the dominant phenotypes for the four traits are tall, purple flowers, axial flowers and green pods. a. From a heterozygous F 1 x F 1, both dominant and recessive phenotypes can be seen for each gene. Thus, you expect 2 x 2 x 2 x 2 = 16 different phenotypes when considering the four traits together. The possibilities can be determined using the product rule with the pairs of phenotypes for each gene, because the traits are inherited independently. Thus: [tall : dwarf] x [green : yellow] gives [tall green : tall yellow : dwarf green : dwarf yellow] x [purple : white] gives [tall green purple : tall yellow purple : dwarf green purple : dwarf yellow purple : tall green white : tall yellow white : dwarf green white : dwarf yellow white] x [terminal : axial] which gives tall green purple terminal : tall yellow purple terminal : dwarf green purple terminal : dwarf yellow purple terminal : tall green white terminal : tall yellow white terminal : dwarf green white terminal : dwarf yellow white terminal : tall green purple axial : tall yellow purple axial : dwarf green purple axial : dwarf yellow purple axial : tall green white axial : tall yellow white axial : dwarf green white axial : dwarf yellow white axial. The possibilities can also be determined using the branched-line method shown below, which might in this complicated problem be easier to track McGraw-Hill Education Ltd.
17 b. Designate the alleles: T = tall, t = dwarf; G = green; g = yellow; P = purple, p = white; A = axial, a = terminal. The cross Tt Gg Pp Aa (an F1 plant) x tt gg pp AA (the dwarf parent) will produce 2 phenotypes for the tall, green and purple genes, but only 1 phenotype (axial) for the fourth gene or 2 x 2 x 2 x 1 = 8 different phenotypes. The first 3 genes will give a 1/2 dominant : 1/2 recessive ratio of the phenotypes (for example 1/2 T : 1/2 t) as this is in effect a testcross for each gene. Thus, the proportion of each phenotype in the progeny will be 1/2 x 1/2 x 1/2 x 1 = 1/8. Using either of the methods described in part a, the progeny will be 1/8 tall green purple axial : 1/8 tall yellow purple axial : 1/8 dwarf green purple axial : 1/8 dwarf yellow purple axial : 1/8 tall green white axial : 1/8 tall yellow white axial : 1/8 dwarf green white axial : 1/8 dwarf yellow white axial For each separate cross, determine the number of genes involved. Remember that 4 phenotypic classes in the progeny means that 2 genes control the phenotypes. Next, determine the phenotypic ratio for each gene separately. A 3:1 monohybrid ratio tells you which phenotype is dominant and that both parents were heterozygous for the trait; in contrast, a 1:1 ratio results from a testcross where the dominant parent was heterozygous McGraw-Hill Education Ltd.
18 a. There are 2 genes in this cross (4 phenotypes). One gene controls purple : white with a monohybrid ratio of = 122 purple : = 43 white or ~3 purple : ~1 white. The second gene controls spiny : smooth with a monohybrid ratio of =126 spiny : = 39 smooth or ~3 spiny : ~1 smooth. Thus, designate the alleles for the flower colour trait as P = purple, p = white, with the P allele dominant to the p allele; and for the pod shape trait as S = spiny, s = smooth, with the S allele dominant to the s allele. This is a straightforward dihybrid cross: Pp Ss x Pp Ss 9 P S : 3 P ss : 3 pp S : 1 pp ss. b. The 1 spiny : 1 smooth ratio indicates a testcross for the pod shape gene. Because all progeny were purple, at least one parent plant must have been homozygous for the P allele of the flower colour gene. The cross was either PP Ss x P ss or P Ss x PP ss. c. This is similar to part b, except that here all the progeny were spiny so at least one parent must have been homozygous for the S allele. The 1 purple : 1 white testcross ratio indicates that the parents were either Pp S x pp SS or Pp SS x pp S. d. Looking at each trait individually, there are = 120 purple : = 119 white. A 1 purple : 1 white monohybrid ratio denotes a testcross. For the other gene, there are = 181 spiny : = 58 smooth, or a 3 spiny : 1 smooth ratio indicating that the parents were both heterozygous for the S gene. The genotypes of the parents were pp Ss x Pp Ss. e. There is a 3 purple : 1 white ratio among the progeny, so the parents were both heterozygous for the P gene. All progeny have smooth pods so the parents were both homozygous recessive ss. The genotypes of the parents were Pp ss x Pp ss. f. There is a 3 spiny : 1 smooth ratio, indicative of a cross between heterozygotes (Ss x Ss). All progeny were white so the parents must have been homozygous recessive pp. The genotypes of the parents were pp Ss x pp Ss Three characters (genes) are being analyzed in this cross. While we can usually tell which alleles are dominant from the phenotype of the heterozygote, we are not told the phenotype of the heterozygote (that is, the original pea plant that was selfed). Instead, use the monohybrid phenotypic ratios to determine which allele is dominant and which is recessive for each gene. Consider height first. There are = 487 tall plants and = 164 dwarf plants. This is a ratio of ~3 tall : ~1 dwarf, indicating that tall is dominant. Next consider pod shape, where there are = 488 inflated pods and = 163 flat pods, or approximately 3 inflated : 1 flat, so inflated is dominant. Finally, consider flower colour. There were = 482 purple flowers and = 169 white flowers, or ~3 purple : ~1 white. Thus, purple is dominant McGraw-Hill Education Ltd.
19 2-27. Diagram each of these crosses, remember that you were told that tiny wings = t, normal wings = T, narrow eye = n and oval (normal) eye = N. You thus know that one gene determines the wing trait and one gene determines the eye trait, and you further know the dominance relationship between the alleles of each gene. In cross 1, all of the parents and offspring show the tiny wing phenotype so there is no variability in the gene controlling this trait, and all flies in this cross are tt. Note that the eye phenotypes in the offspring are seen in a ratio of 3 oval : 1 narrow. This phenotypic monohybrid ratio means that both parents are heterozygous for the gene (Nn). Thus the genotypes for the parents in cross 1 are: tt Nn x tt Nn. In cross 2 consider the wing trait first. The female parent is tiny (tt) so this is a testcross for the wings. The offspring show both tiny and normal in a ratio of 82 : 85 or a ratio of 1 tiny : 1 normal. Therefore the normal male parent must be heterozygous for this gene (Tt). For eyes the narrow parent is homozygous recessive (nn) so again this is a testcross for this gene. Again both eye phenotypes are seen in the offspring in a ratio of 1 oval : 1 narrow, so the oval female parent is a Nn heterozygote. Thus the genotypes for the parents in cross 2 are: Tt nn x tt Nn. Consider the wing phenotype in the offspring of cross 3. Both wing phenotypes are seen in a ratio of 64 normal flies : 21 tiny or a 3 normal : 1 tiny. Thus both parents are Tt heterozygotes. The male parent is narrow (nn), so cross 3 is a testcross for eyes. Both phenotypes are seen in the offspring in a 1 normal : 1 narrow ratio, so the female parent is heterozygous for this gene. The genotypes of the parents in cross 3 are: Tt nn x Tt Nn. When examining cross 4 you notice a monohybrid phenotypic ratio of 3 normal : 1 tiny for the wings in the offspring. Thus both parents are heterozygous for this gene (Tt). Because the male parent has narrow eyes (nn), this cross is a testcross for eyes. All of the progeny have oval eyes, so the female parent must be homozygous dominant for this trait. Thus the genotypes of the parents in cross 4 are: Tt nn x Tt NN a. Analyze each gene separately: Tt x Tt will give 3/4 T (normal wing) offspring. The cross nn x Nn will give 1/2 N (normal eye) offspring. To calculate the probability of the normal offspring apply the product rule to the normal portions of the monohybrid ratios by multiplying these two fractions: 3/4 T x 1/2 N = 3/8 T N. Thus 3/8 of the offspring of this cross will have normal wings and oval eyes. b. Diagram the cross: 2017 McGraw-Hill Education Ltd.
20 Tt nn x Tt Nn? Find the phenotypic monohybrid ratio separately for each gene in the offspring. Then multiply these monohybrid ratios to find the phenotypic dihybrid ratio. A cross of Tt x Tt 3/4 T (normal wings) : 1/4 tt (tiny wings). For the eyes the cross is nn x Nn 1/2 N (oval) : 1/2 nn (narrow). Applying the product rule gives 3/8 T N (normal oval) : 3/8 T nn (normal narrow) : 1/8 tt N (tiny oval) : 1/8 tt nn (tiny narrow). When you multiply each fraction by 200 progeny you will see 75 normal oval : 75 normal narrow : 25 tiny oval : 25 tiny narrow a. The protein specified by the pea colour gene is an enzyme called Sgr, which is required for the breakdown of the green pigment chlorophyll. (See Figure A in the Fast Forward box Genes Encode Proteins ). b. The y allele could be a null allele because it does not specify the production of any of the Sgr enzyme. c. The Y allele is dominant because in the heterozygote, the single Y allele will lead to the production of some Sgr enzyme, even if the y allele cannot specify any Sgr. The amount of the Sgr enzyme made in heterozygotes is sufficient for yellow colour. d. In yy peas, the green chlorophyll cannot be broken down, so this pigment stays in the peas, which remain green in colour. e. If the amount of Sgr protein is proportional to the number of functional copies of the gene, then YY homozygotes should have twice the amount of Sgr protein as do Yy heterozygotes. Yet both YY and Yy peas are yellow. These observations suggest that half the normal amount of Sgr enzyme is sufficient for the pea to break down enough chlorophyll so that the pea will still be yellow. f. Just as was seen in part e, for many genes (including that for pea colour), half the amount of the protein specified by the gene is sufficient for a normal phenotype. Thus, in most cases, even if the gene is essential, heterozygotes for null alleles will survive. The advantage of having two copies of essential genes is then that even if one normal allele becomes mutated (changed) so that it becomes a null allele, the organism can survive because half the normal amount of gene product is usually sufficient for survival. g. Yes, a single pea pod could contain peas with different phenotypes because a pod is an ovary that contains several ovules (eggs), and each pea represents a single fertilization event involving one egg and one sperm (from one pollen grain). If the female plant was Yy, or yy, then it is possible that some peas in the same pod would be yellow and others green. For example, fertilization of a y egg with Y pollen would yield a yellow pea, but if the pollen grain was y, the pea 2017 McGraw-Hill Education Ltd.
21 would be green. However, a pea pod could not contain peas with different phenotypes if the female plant was YY, because all the peas produced by this plant would be yellow. h. Yes, it is possible that a pea pod could be different in colour from a pea growing within it. One reason is that, as just seen in part g, a single pod can contain green and yellow peas. But a more fundamental reason is that one gene controls the phenotype of pea colour, while a different gene controls the separate phenotype of pod colour If the alleles of the pea colour and pea shape genes inherited from a parent in the P generation always stayed together and never separated, then the gametes produced by the doubly heterozygous F1 individuals in Figure 2.14 would be either Y R or y r. (Note that only two possibilities would exist, and these would be in equal frequencies.) On a Punnett square (male gametes shaded in blue, female gametes in pink): Y R ½ y r ½ Y R ½ YY RR ¼ Yy Rr ¼ y r ½ Yy Rr ¼ yy rr ¼ Thus the genotypic ratios of the F2 progeny would be 1/4 YY RR, 1/2 Yy Rr, and 1/4 yy rr. The phenotypic ratios among the F2 progeny would be 3/4 yellow round and 1/4 green wrinkled. These results make sense because if the alleles of the two genes were always inherited as a unit, you would expect the same ratios as in a monohybrid cross Similar to what you saw in Figure A in the Fast Forward box Genes Encode Proteins, the most likely biochemical explanation is that the dominant allele L specifies functional G3βH enzyme, while the recessive allele l is incapable of specifying any functional enzyme (in nomenclature you will see in later chapters, l is a null allele). The functional enzyme can synthesize the growth hormone gibberellin, so plants with the L allele are tall. Even half the normal amount of this enzyme is sufficient for the tall phenotype, explaining why Ll heterozygotes are tall a. As in Problem 31 above, the dominant allele P most likely specifies a functional product (in this case, the protein bhlh), while the recessive p allele cannot specify any functional protein. The fact that the hybrid is purple (as shown on Figure 2.7) indicates that half the normal amount of active bhlh protein is sufficient for purple colour McGraw-Hill Education Ltd.
22 b. Yes, flower colour could potentially be controlled by genes specifying the enzymes DFR, ANS, or 3GT in addition to the gene specifying the bhlh protein. Alleles specifying functional enzymes would yield purple colour, while those that could not produce functional enzymes would cause white colour. It is likely that the alleles for purple colour would be dominant. Section 2.3 Mendelian Inheritance in Humans a. Recessive - two unaffected individuals have an affected child II-1, V-2 (aa). Therefore, the parents in generation I and those involved in the consanguineous marriage must all be carriers I- 1, I-2, IV-1, IV-2 (Aa). b. Dominant - the trait is seen in each generation and every affected person (A ) has an affected parent. Note that III-3 is unaffected (aa) even though both his parents are affected; this would not be possible for a recessive trait. The term carrier is not applicable, because everyone with a single A allele shows the trait. c. Recessive - two unaffected, carrier parents II-4, II-5 (Aa) have an affected child III-4 (aa), as in part a. Individual I-2 is also affected (aa) and thus has transmitted a recessive disease allele to all of his children, making individuals II-1, II-2, and II-3 carriers (Aa) also a. Cutis laxa must be a recessive trait because affected child II-4 has normal parents. Because II-4 is affected she must have received a disease allele (CL) from both parents. The mother (I-3) and the father (I-4) are both heterozygous (CL + CL). The trait is thus recessive. b. You are told that this trait is rare, so unrelated people in the pedigree, like I-2, are almost certainly homozygous normal (CL + CL + ). Diagram the cross that gives rise to II-2: CL CL (I-1) x CL + CL + (I-2) CL + CL. Thus the probability that II-2 is a carrier is very close to 100 percent. (In Chapter 12 you will find the definition of a term called the allele frequency; if the value of the allele frequency in the population under study is known, you can calculate the very low likelihood that II-2 is a carrier.) c. As described in part a both parents in this cross are carriers: CL + CL x CL + CL. II-3 is not affected so he cannot have the CL CL genotype. Therefore there is a 1/3 probability that he has the CL + CL + genotype and a 2/3 probability that he is a carrier (CL + CL). d. As shown in part b, II-2 must be a carrier (CL + CL). In order to have an affected child II-3 must also be a carrier. The probability of this is 2/3 as shown in part c. The probability of two 2017 McGraw-Hill Education Ltd.
23 heterozygous parents having an affected child is 1/4. Apply the product rule to these probabilities: (1 probability that II-2 is CL + CL) x (2/3 probability that II-3 is CL + CL) x (1/4 probability of an affected child from a mating of two carriers) = 2/12 = 1/ Diagram the cross! In humans, this is usually done as a pedigree. Remember that the affected siblings must be CF CF. CF + CF CF + CF CF + CF CF + CF I II sibling CF CF sibling CF CF III? a. The probability that II-2 is a carrier is 2/3. Both families have an affected sibling, so both sets of parents (that is, all the people in generation I) must have been carriers. Thus, the expected genotypic ratio in the children is 1/4 affected : 1/2 carrier : 1/4 homozygous normal. II-2 is NOT affected, so she cannot be CF CF. Of the remaining possible genotypes, 2 are heterozygous. There is therefore a 2/3 chance that she is a carrier. b. The probability that II-2 x II-3 will have an affected child is 2/3 (the probability that the mother is a carrier as seen in part a) x 2/3 (the probability the father is a carrier using the same reasoning) x 1/4 (the probability that two carriers can produce an affected child) = 4/36 = 1/9. c. The probability that both parents are carriers and that their child will be a carrier is 2/3 x 2/3 x 1/2 = 2/9 (using the same reasoning as in part b, except asking that the child be a carrier instead of affected). However, it is also possible for CF + CF + x CF + CF parents to have children that are carriers. Remember that there are 2 possible ways for this particular mating to occur homozygous father x heterozygous mother or vice versa. Thus the probability of this sort of mating is 2 x 1/3 (the probability that a particular parent is CF + CF + ) x 2/3 (the probability that the other parent is CF + CF) x 1/2 (the probability that such a mating could produce a carrier child) = 2/9. The probability that a child could be a carrier from either of these two scenarios (where both parents 2017 McGraw-Hill Education Ltd.
24 are carriers or where only one parent is a carrier) is the sum of these mutually exclusive events, or 2/9 + 2/9 = 4/ a. Because the disease is rare the affected father is most likely to be heterozygous (HD + HD). There is a 1/2 chance that the son inherited the HD allele from his father and will develop the disease. b. The probability of an affected child is: 1/2 (the probability that Joe is HD + HD) x 1/2 (the probability that the child inherits the HD allele if Joe is HD + HD) = 1/ The trait is recessive because pairs of unaffected individuals (I-1 x I-2 as well as II-3 x II-4) had affected children (II-1, III-1, and III-2). There are also two cases in which an unrelated individual must have been a carrier (II-4 and either I-1 or I-2), so the disease allele appears to be common in the population a. The inheritance pattern seen in Figure 2.20 could be caused by a rare dominant mutation. In this case, the affected individuals would be heterozygous (HD + HD) and the normal individuals would be HD + HD +. Any mating between an affected individual and an unaffected individual would give 1/2 normal (HD + HD + ) : 1/2 affected (HD + HD) children. However, the same pattern of inheritance could be seen if the disease were caused by a common recessive mutation. In the case of a common recessive mutation, all the affected individuals would be HD HD. Because the mutant allele is common in the population, most or even all of the unrelated individuals could be assumed to be carriers (HD + HD). Matings between affected and unaffected individuals would then also yield phenotypic ratios of progeny of 1/2 normal (HD + HD) : 1/2 affected (HD HD). b. Determine the phenotype of the 14 children of III-6 and IV-6. If the disease is due to a recessive allele, then III-6 and IV-6 must be homozygous for this recessive allele, and all their children must have the disease. If the disease is due to a dominant mutation, then III-6 and IV- 6 must be heterozygotes (because they are affected but they each had one unaffected parent), and 1/4 of their 14 children would be expected to be unaffected. Alternatively, you could look at the progeny of matings between unaffected individuals in the pedigree such as III-1 and an unaffected spouse. If the disease were due to a dominant mutation, these matings would all be homozygous recessive x homozygous recessive and would never give affected children. If the disease is due to a recessive mutation, then many of these 2017 McGraw-Hill Education Ltd.
25 individuals would be carriers, and if the trait is common then at least some of the spouses would also be carriers, so such matings could give affected children Diagram the cross by drawing a pedigree: I HH hh II HH Hh Hh HH III IV affected? a. Assuming the disease is very rare, the first generation is HH unaffected (I-1) x hh affected (I-2). Thus, both of the children (II-2 and II-3) must be carriers (Hh). Again assuming this trait is rare in the population, those people marrying into the family (II-1 and II-4) are homozygous normal (HH). Therefore, the probability that III-1 is a carrier is 1/2; III-2 has the same chance of being a carrier. Thus the probability that a child produced by these two first cousins would be affected is 1/2 (the probability that III-1 is a carrier) x 1/2 (the probability that III-2 is a carrier) x 1/4 (the probability the child of two carriers would have an hh genotype) = 1/16 = b. If 1/10 people in the population are carriers, then the probability that II-1 and II-4 are Hh is 0.1 for each. In this case an affected child in generation IV can only occur if III-1 and III-2 are both carriers. III-1 can be a carrier as the result of 2 different matings: (i) II-1 homozygous normal x II-2 carrier or (ii) II-1 carrier x II-2 carrier. (Note that whether I-1 is HH or Hh, II-2 must be a carrier because of the normal phenotype (II-2 cannot be hh) and the fact that one parent was affected.) The probability of III-1 being a carrier is thus the probability of mating (i) x the probability of generating an Hh child from mating (i) + the probability of mating (ii) x the probability of generating an Hh child from mating (ii) = 0.9 (the probability II-1 is HH, which is the probability for mating [i]) x 1/2 (the probability that III-1 will inherit h in mating [i]) (the probability II-1 is Hh, which is the probability for mating [ii]) x 2/3 (the probability that III-1 will inherit h in mating [ii]; remember that III-1 is known not to be hh) = = The chance that III- 2 will inherit h is exactly the same. Thus, the probability that IV-1 is hh = (the probability 2017 McGraw-Hill Education Ltd.
26 III-1 is Hh) x (the probability that III-2 is Hh) x 1/4 (the probability the child of two carriers will be hh) = This number is slightly higher than the answer to part a, which was , so the increased likelihood that II-1 or II-4 is a carrier makes it only slightly more likely that IV-1 will be affected a. Both diseases are known to be rare, so normal people marrying into the pedigree are assumed to be homozygous normal. Nail-patella (N) syndrome is dominant because all affected children have an affected parent. Alkaptonuria (a) is recessive because the affected children are the result of a consanguineous mating between 2 unaffected individuals (III-3 x III-4). Because alkaptonuria is a rare disease, it makes sense to assume that III-3 and III-4 inherited the same a allele from a common ancestor. Genotypes: I-1 nn Aa; I-2 Nn AA (or I-1 nn AA and I-2 Nn Aa); II-1 nn AA; II-2 nn Aa; II-3 Nn A ; II-4 nn A ; II-5 Nn Aa; II-6 nn AA; III-1 nn AA; III-2 nn A ; III-3 nn Aa; III-4 Nn Aa; III-5 nn A ; III-6 nn A ; IV-1 nn A ; IV-2 nn A ; IV-3 Nn A ; IV-4 nn A ; IV-5 Nn aa; IV-6 nn aa; IV-7 nn A. b. The cross is nn A (IV-2) x Nn aa (IV-5). The ambiguity in the genotype of IV-2 is due to the uncertainty of his father's genotype (III-2). His parents' genotypes are nn AA (II-1) x nn Aa (II-2) so there is a 1/2 chance III-2 is nn AA and a 1/2 chance he is nn Aa. Thus, for each of the phenotypes below you must consider both possible genotypes for IV-2. For each part below, calculate the probability of the child inheriting the correct gametes from IV-2 x the probability of obtaining the correct gametes from IV-5 to give the desired phenotype. If both the possible IV-2 genotypes can produce the needed gametes, you will need to sum the two probabilities. - For the child to have both syndromes (N aa), IV-2 would have to contribute an n a gamete. This could only occur if IV-2 were nn Aa. The probability IV-2 is nn Aa is 1/4: For IV-2 to be nn Aa, III-2 would have had to be nn Aa and would also have had to give an n a gamete to IV-2. The probability of each of those events is 1/2, so the chance of both of them occurring is 1/2 x 1/2 = 1/4. (Note that we can assume that II-2 is nn Aa because III-3 must have given two of her children an a allele. Therefore, both II-2 and III-3 must be nn Aa). If IV-2 is nn Aa, the chance that he would give a child an n a gamete is 1/2. The probability that IV-5 would supply an N a gamete is also 1/2. Thus, the probability that the child would have both syndromes is 1/4 x 1/2 x 1/2 = 1/16. There is no need to sum probabilities in this case because IV-2 cannot produce an n a gamete if his genotype is nn AA. - For the child to have only nail-patella syndrome (N A ), IV-2 would have to provide an n A gamete and IV-5 an N a gamete. This could occur if IV-2 were nn Aa; the probability is 1/4 (the probability IV-2 is Aa) x 1/2 (the probability of an A gamete if IV-2 is Aa) x 1/2 (the 2017 McGraw-Hill Education Ltd.
27 probability of an N a gamete from IV-5] = 1/16. This could also occur if IV-2 were nn AA. Here, the probability is 3/4 (the probability IV-2 is nn AA) x 1 (the probability of an n A gamete if IV-2 is nn AA) x 1/2 (the probability of an N a gamete from IV-5) = 3/8. Summing the probabilities for the two mutually exclusive IV-2 genotypes, the probability that the child of IV-2 and IV-5 would have only nail-patella syndrome is 1/16 + 3/8 = 7/16. - For the child to have just alkaptonuria (nn aa), IV-2 would have to contribute an n a gamete. This could only occur if IV-2 were nn Aa. The probability IV-2 is nn Aa is 1/4, and the probability of receiving an n a gamete from IV-2 if he is nn Aa is 1/2. The probability that IV-5 would supply an n a gamete is also 1/2. Thus, the probability that the child of IV-2 and IV-5 would have only alkaptonuria is 1/4 x 1/2 x 1/2 = 1/16. There is no need to sum probabilities in this case because IV-2 cannot produce an n a gamete if his genotype is nn AA. - The probability of neither defect is 1 (sum of the first 3) = 1 - (1/16 + 7/16 + 1/16) = 1-9/16 = 7/16. You can make this calculation because there are only the four possible outcomes and you have already calculated the probabilities of three of them Diagram the cross(es): midphalangeal x midphalangeal 1853 midphalangeal : 209 normal M? x M? M? : mm The following crosses are possible: MM x MM all MM Mm x MM all M MM x Mm all M Mm x Mm 3/4 M : 1/4 mm The 209 normal children must have arisen from the last cross, so approximately 3 x 209 = ~630 children should be their M siblings. Thus, about 840 of the children or ~40% came from the last mating and the other 60% of the children were the result of one or more of the other matings. This problem illustrates that much care in interpretation is required when the results of many matings in mixed populations are reported (as opposed to the results of matings where individuals have defined genotypes) Draw a Punnett square (male gametes shaded in blue, female gametes in pink): 2017 McGraw-Hill Education Ltd.
28 HD + ½ HD + ½ HD ½ HD HD + ¼ affected HD HD + ¼ affected HD + ½ HD + HD + ¼ Unaffected HD + HD + ¼ Unaffected a. An equally likely possibility exists that any child produced by this couple will be affected (A) or unaffected (U). For two children, the possibilities are: AA, AU, UA, UU. The case in which only the second child is affected is UA; this is one of the four possibilities so the probability that only the second child is affected is 1/4. b. From the list just presented in part a, you can see that there are two possibilities in which only one child is affected: AU and UA. The probability that either of these two mutually exclusive possibilities will occur is the sum of their independent probabilities: 1/4 + 1/4 = 1/2. c. From the list just presented in part a, you can see that there is only one possibility in which no child is affected: UU. The probability of this event is 1/4. d. If this family consisted of 10 children, the case in which only the second child out of 10 is affected (that is, UAUUUUUUUU) has a probability of 1/2 10 = 1/1024 = ~ This probability is based on the facts that each birth is an independent event, and that the chance of U and A are each 1/2. We thus use the product rule to determine the chance that each of those 10 independent events will occur in a particular way a particular birth order. In a family of ten children, 10 different outcomes (birth orders) exist that satisfy the criterion that only 1 child has the disease. Only the first child could have the disease, only the second child, only the third child, etc. : 1. AUUUUUUUUU 2. UAUUUUUUUU 3. UUAUUUUUUU 4. UUUAUUUUUU 5. UUUUAUUUUU 6. UUUUUAUUUU 7. UUUUUUAUUU 8. UUUUUUUAUU 9. UUUUUUUUAU 10. UUUUUUUUUA 2017 McGraw-Hill Education Ltd.
29 We have already calculated that the chance of one of these outcomes in particular (#2) is 1/1024. As each of the 10 possibilities has the same probability, the probability that only one child is affected would be 10 x (1/1024) = 10/1024 = ~ Only one possibility exists in which no child would be affected (UUUUUUUUUU), and just like any other specific outcome, this one has a probability of 1/1024 = ~ e. One way to determine the probability that four children in a family of ten will have the disease is to write down all possible outcomes for the criterion, as we did above for the second answer in part d. Then, also as we did above, sum their individual probabilities, each of which is (1/2) 10 just as before. If you start to do this 1. AAAAUUUUUU 2. AAAUAUUUUU 3. AAAUUAUUUU 4. AAAUUUAUUU 5. AAAUUUUAUU 6. AAAUUUUUAU 7. AAAUUUUUUA 8. AAUAAUUUUU 9. AAUAUAUUUU 10. AAUAUUAUUU etc...you will realize fairly quickly that writing down every possible birth order in this case is quite a difficult task and you are likely to miss some outcomes. In short this is not a good way to find the answer! For questions like this, it is far preferable to use a mathematical tool called the binomial theorem in order to determine the number of possible outcomes that satisfy the criterion. The binomial theorem looks like this: P (X will occur s times, and Y will occur t times, in n trials) = n! s! t! (p s q t ) P = the probability of what is in parentheses p = P(X) q = P(Y) X and Y are the only two possibilities, so p + q = 1. Also, s + t = n. Remember that! means factorial: for example, 5! = McGraw-Hill Education Ltd.
30 To apply the binomial theorem to the question at hand (assuming you can still remember what the question was!), we ll let X = a child has the disease (A), and Y = a child does not have the disease (U). Then, s = 4, t = 6, n = 10, p = 1/2, and q = 1/2. The answer to the question is then: P (4 A and 6 U children out of 10) = (10! / 4! 6!) (1/2 4 1/2 6 ). Notice that (p s q t ) = (1/2 4 1/2 6 ) = 1/2 10. This factor of the binomial theorem equation is the probability of each single birth order, as we saw previously in part d above. To get the answer to our question, we need to multiply this factor (the probability of each single birth order) by the number of different birth orders that satisfy our criterion. From the equation in the box above, this second factor is [n!/(s! t!)] = (10! / 4! 6!) = 210. Thus, the probability (P) of only 4 children having the disease in a family of 10 children is 1/ % In the case of cystic fibrosis, the alleles causing the disease do not specify active protein [in this case, the cystic fibrosis transmembrane receptor (CFTR)]. Some CF disease alleles specify defective CFTR proteins that do not allow the passage of chloride ions, while other CF disease alleles do not specify any CFTR protein at all. As you will learn in a later chapter, such alleles are called loss-offunction alleles. In a heterozygote, the normal CF + allele still specifies active CFTR protein, which allows for the passage of chloride ions. Because the phenotype of the heterozygote is unaffected, the amount of active CFTR protein allows passage of enough chloride ions for the cells to function normally. Again as you will see, most loss-of-function alleles are recessive to normal alleles for similar reasons. (But it is important to realize that important exceptions are known in which loss-of-function mutations are actually dominant to normal alleles.) In the case of Huntington disease, the disease-causing allele is dominant. The reason is that the huntingtin protein specified by this HD allele has, in addition to its normal function (which is not entirely understood), a second function that is toxic to nerve cells. This makes the HD disease allele a gain-of-function allele. The reason HD is dominant to HD + is that the protein specified by the disease allele will be toxic to cells even if the cells have normal huntingtin protein specified by the normal allele. Most (but again not all) gain-of-function mutations are dominant for similar reasons. Section 2.4 Extensions to Mendel for Single-Gene Inheritance The problem states that the intermediate pink phenotype is caused by incomplete dominance between the alleles of a single gene. We suggest that you employ genotype symbols that can show the lack of complete dominance; the obvious R for red and r for white does not reflect the complexity of this situation. In such cases we recommend using a base letter as the gene symbol and then employing superscripts to show the different alleles. To avoid any possible misinterpretations, it is always 2017 McGraw-Hill Education Ltd.
31 advantageous to include a separate statement making the complexities of the dominant/recessive complications clear. Designate the two alleles f r = red and f w = white, so the possible genotypes are f r f r = red; f r f w = pink; and f w f w = white. Note that the phenotypic ratio is the same as the genotypic ratio in incomplete dominance. a. Diagram the cross: f r f w x f r f w 1/4 f r f r (red) : 1/2 f r f w (pink) : 1/4 f w f w (white). b. f w f w x f r f w 1/2 f r f w (pink) : 1/2 f w f w (white). c. f r f r x f r f r 1 f r f r (red). d. f r f r x f r f w 1/2 f r f r (red) : 1/2 f r f w (pink). e. f w f w x f w f w 1 f w f w (white). f. f r f r x f w f w 1 f r f w (pink). The cross shown in part f is the most efficient way to produce pink flowers, because all the progeny will be pink Diagram the cross: yellow x yellow 38 yellow : 22 red : 20 white Three phenotypes in the progeny show that the yellow parents are not true breeding. The ratio of the progeny is close to 1/2 : 1/4 : 1/4. This is the result expected for crosses between individuals heterozygous for incompletely dominant genes. Thus: c r c w x c r c w 1/2 c r c w (yellow) : 1/4 c r c r (red) : 1/4 c w c w (white) a. Diagram the cross: e + e + x e + e 1/2 e + e + : 1/2 e + e. The trident marking is only found in the heterozygotes, so the probability is 1/2. b. The offspring with the trident marking are e + e, so the cross is e + e x e + e 1/4 ee : 1/2 e + e : 1/4 e + e +. Therefore, of 300 offspring, 75 should have ebony bodies, 150 should have the trident marking, and 75 should have honey-coloured bodies The cross is: white long x purple short 301 long purple : 99 short purple : 612 long pink : 195 short pink : 295 long white : 98 short white Deconstruct this dihybrid phenotypic ratio for two genes into separate constituent monohybrid ratios for each of the 2 traits, flower colour and pod length. For flower colour note that there are 3 phenotypes: purple : pink : white = 400 purple : 807 pink : 393 white = 1/4 purple : 1/2 pink : 1/4 white. This is a typical monohybrid ratio for incompletely dominant alleles, so flower colour is caused by incompletely dominant alleles of a gene, with c p giving purple when homozygous, c w giving white when homozygous, and the c p c w heterozygotes giving pink. For pod length, the phenotypic ratio is ( ) long : ( ) short = 1208 long : McGraw-Hill Education Ltd.
32 short = 3/4 long : 1/4 short. This 3:1 ratio is that expected for a cross between individuals heterozygous for a gene in which one allele is completely dominant to the other, so pod shape is controlled by a single gene with the long allele (L) completely dominant to the short allele (l) A cross between individuals heterozygous for incompletely dominant alleles of a gene give a ratio of 1/4 (one homozygote) : 1/2 (heterozygote with the same phenotype as the parents) : 1/4 (other homozygote). Because the problem already states which genotypes correspond to which phenotypes, you know that the colour gene will give a monohybrid phenotypic ratio of 1/4 red : 1/2 purple : 1/4 white, while the shape gene will give a monohybrid phenotypic ratio of 1/4 long : 1/2 oval : 1/4 round. Because the inheritance of these two genes is independent, use the product rule to generate all the possible phenotype combinations (note that there will be 3 x 3 = 9 classes) and their probabilities, thus generating the dihybrid phenotypic ratio for two incompletely dominant genes: 1/16 red long : 1/8 red oval : 1/16 red round : 1/8 purple long : 1/4 purple oval : 1/8 purple round : 1/16 white long : 1/8 white oval : 1/16 white round. As an example, to determine the probability of red long progeny, multiply 1/4 (probability of red) x 1/4 (probability of long) = 1/16. If you have trouble keeping track of the 9 possible classes, it may be helpful to list the classes in the form of a branched-line diagram or table as follows: Phenotype Probability of phenotype red, long 1/4 1/4=1/16 red, oval 1/4 1/2=1/8 red, round 1/4 1/4=1/16 purple, long 1/2 1/4=1/8 purple, oval 1/2 1/2=1/4 purple, round 1/2 1/4=1/8 white, long 1/4 1/4=1/16 white, oval 1/4 1/2=1/8 white, round 1/4 1/4=1/ In Mendel s Pp heterozygotes, the amount of enzyme leading to purple pigment is sufficient to produce purple colour as intense as the purple colour in PP homozygotes. Presumably the heterozygote has enough enzyme P so that the maximal level of purple pigment is produced; more enzyme cannot make more purple pigment. In the snapdragons in Figure 2.24, the amount of red pigment in the Aa heterozygote is less than that in the AA homozygote. Presumably here, the amount of enzyme A catalyzing the production of the red pigment in the heterozygotes is insufficient to produce the maximum level of the red pigment seen 2017 McGraw-Hill Education Ltd.
33 in the AA homozygote. That is, in this case the intensity of the phenotype is proportional to the dosage of functional alleles (1 in the Aa heterozygote, 2 in the AA homozygote) a. A person with sickle-cell anaemia is a homozygote for the sickle-cell allele: Hbβ S Hbβ S. b. The child must be homozygous Hbβ S Hbβ S and therefore must have inherited a mutant allele from each parent. Because the parent is phenotypically normal, he/she must be a carrier with genotype Hbβ S Hbβ A. c. Each individual has two alleles of every gene, including the β-globin gene. If an individual is heterozygous, he/she has two different alleles. Thus, if each parent is heterozygous for different alleles, there are four possible alleles that could be found in the five children. This is the maximum number of different alleles possible (barring the very rare occurrence of a new, novel mutation in a gamete that gave rise to one of the children). If one or both of the parents were homozygous for any one allele, the number of alleles distributed to the children would of course be less than four Remember that the gene determining ABO blood groups has 3 alleles and that I A = I B > i. a. The O phenotype means the girl's genotype is ii. Each parent contributed an i allele, so her parents could be ii (O) or I A i (A) or I B i (B). b. A person with the B phenotype could have either genotype I B I B or genotype I B i. The mother is A and thus could not have contributed an I B allele to this daughter. Instead, because the daughter clearly does not have an I A allele, the mother must have contributed the i allele to this daughter. The mother must have been an I A i heterozygote. The father must have contributed the I B allele to his daughter, so he could be either I B I B, I B i, or I A I B. c. The genotypes of the girl and her mother must both be I A I B. The father must contribute either the I A or the I B allele, so there is only one phenotype and genotype which would exclude a man as her father - the O phenotype (genotype ii) To approach this problem, look at the mother/child combinations to determine what alleles the father must have contributed to each child's genotype. a. The father had to contribute I B, N, and Rh - alleles to the child. The only male fitting these requirements is male d whose phenotype is B, MN, and Rh + (note that the father must be Rh + Rh - because the daughter is Rh - ). b. The father had to contribute i, N, and Rh - alleles. The father could be either male c (O MN Rh + ) or male d (B MN Rh + ). As we saw previously, male c is the only male fitting the requirements for the father in part a. Assuming one child per male as instructed by the problem, the father in part b must be male c McGraw-Hill Education Ltd.
34 c. The father had to contribute I A, M, and Rh - alleles. Only male b (A M Rh + ) fits these criteria. d. The father had to contribute either I B or i, M, and Rh -. Three males have the alleles required: these are male a, male c, and male d. However, of these three possibilities, only male a remains unassigned to a mother/child pair Designate the alleles: p m (marbled) > p s (spotted) = p d (dotted) > p c (clear). a. The expected phenotypes of the F 1 plants from the two original parental crosses are marbled (p m p s ) from the first cross and dotted (p d p c ) from the second cross. b. Diagram the crosses: 1. p m p m (homozygous marbled) x p s p s (spotted) p m p s (marbled F 1 ) 2. p d p d x p c p c p d p c (dotted F 1 ) 3. p m p s x p d p c 1/4 p m p d (marbled) : 1/4 p m p c (marbled) : 1/4 p s p d (spotted dotted) : 1/4 p s p c (spotted) = 1/4 spotted dotted : 1/2 marbled : 1/4 spotted Suppose, as maintained by your fellow student, that spotting is due to the action of one gene with alleles S (spotting) and s (no spots), and that dotting is due to the action of a second gene with alleles D (dotting) and d (no spots). The cross series shown in Figure 2.25a, starting with true-breeding spotted and true-breeding dotted strains, could be diagrammed as: SS dd x ss DD Ss Dd (spotted and dotted F 1 ) F 2 consisting of 9 S D (spotted and dotted) : 3 S dd (spotted, not dotted) : 3 ss D (not spotted, dotted) : 1 ss dd (not spotted, not dotted) Thus, the alternative hypothesis suggested by your fellow student would predict that some lentils would be found in the F 2 generation that would be neither spotted nor dotted. The results shown in Figure 2.25 do not include any such lentils. If you counted a large number of F 2 individuals and you failed to see lentils that were neither spotted nor dotted, you would be able to exclude the hypothesis that two genes were involved a. All of the crosses have results that can be explained by one gene - either a 3:1 phenotypic monohybrid ratio showing that one allele is completely dominant to the other, or a 1:1 ratio showing that a testcross was done for a single gene, or all progeny with the same phenotype as the parents. You can thus conclude that all of the coat colours are controlled by the alleles of one gene, with chinchilla (C) > himalaya (c h ) > albino (c a ). b. 1. c h c a x c h c a 2. c h c a x c a c a 2017 McGraw-Hill Education Ltd.
35 3. Cc h x C(c h or c a ) 4. CC x c h (c h or c a ) 5. Cc a x Cc a 6. c h c h x c a c a 7. Cc a x c a c a 8. c a c a x c a c a 9. Cc h x c h (c h or c a ) or Cc a x c h c h 10. Cc a x c h c a. c. Cc h (from cross 9) x Cc a (from cross 10) 1/4 CC (chinchilla) : 1/4 Cc a (chinchilla) : 1/4 Cc h (chinchilla) : 1/4 c h c a (himalaya) = 3/4 chinchilla : 1/4 himalaya, or Cc a (cross 9) x Cc a (cross 10) 3/4 C chinchilla : 1/4 c a c a albino There are two keys to this problem: (1) Pollen grains and ovules are gametes that have only one copy of the S incompatibility gene, while the stigma (the part of the female plant on which the pollen grains land) has two copies of this gene. (2) Pollen with a particular S gene allele cannot fertilize any ovules in a plant whose stigma has the same S allele, because the pollen will not grow a tube allowing it to fertilize an ovule. a. In the cross S1 S2 x S1 S2 all of the pollen grains (whether they are S1 or S2) will land on the stigmas of plants that have the same alleles, and therefore no progeny would be produced at all. b. The way this cross was written is ambiguous because the male and female parents were not specified. The cross could be S1 S2 x S2 S3, or S1 S2 x S2 S3, or both (because the flowers of these plants have both male and female parts). For the cross S1 S2 x S2 S3, the pollen grains would be S1 or S2. The S2 pollen could not fertilize the female plant, but the S1 pollen could. The progeny of the S1 S2 x S2 S3 cross would thus be S1 S2 and S1 S3 (in a 1:1 ratio). For the cross written the opposite way ( S1 S2 x S2 S3), the pollen would be S2 or S3. The S2 pollen would not produce any progeny, but the S3 pollen could produce both S1 S3 progeny and S2 S3 progeny. The progeny of the S1 S2 x S2 S3 cross would thus be a 1:1 ratio of S1 S3 and S2 S3. c. Because of the ambiguity in the way the cross was written, there are again two possibilities: The cross could be S1 S2 x S3 S4, or S1 S2 x S3 S4, or both. Regardless of these possibilities, all pollen grains would be able to fertilize all ovules, because the pollen grains do not share any alleles with the female parent. As a result, any of these crosses could produce four types of progeny in equal numbers: S1 S3, S1 S4, S2 S3, and S2 S4. d. This mechanism would prevent plant self-fertilization because any pollen grain produced by any plant would land on a stigma sharing the same allele. For example, if an S1 pollen grain produced by an S1 S2 plant lands on a stigma from the same plant, the stigma would have the same 2017 McGraw-Hill Education Ltd.
36 allele and no pollen tube would be able to grow to allow fertilization. The same would be true for an S2 pollen grain from the same plant. (Of interest, tomato plants in the wild cannot self- fertilize because of this incompatibility mechanism; they proliferate only through cross- fertilization. However, many domesticated cultivars of tomatoes can self-fertilize because they were selected for varieties that have mutations causing the failure of the incompatibility mechanism.) e. Plants with functioning incompatibility systems must be heterozygotes because a pollen grain cannot fertilize a female plant sharing the same allele of the S incompatibility gene. For example, an S1 pollen grain cannot fertilize successfully any female plant that also has an S1 allele. No way thus exists to create S1 S1 homozygous progeny. f. Peas cannot be governed by this mechanism because you already saw in this chapter that Gregor Mendel routinely self-fertilized his peas in the F 1 generation to produce the F 2 generation. g. The larger the number of different alleles of the S gene that are present in the population, the more likely it is that any given pollen grain of any genotype would land on the stigma of a flower that did not share the same allele, and the less likely that the pollen will interact unproductively with flowers that share the same allele. Within the population, the proportion of matings that could produce progeny would increase with a greater variety in S gene alleles; this would clearly increase the fertility (and thus the average evolutionary fitness) of the population as a whole a. This ratio is approximately 2/3 curly : 1/3 normal. b. The expected result for this cross is: Cy + Cy x Cy + Cy 1/4 Cy Cy (?): 1/2 Cy + Cy (curly) : 1/4 Cy + Cy + (normal). If the Cy/ Cy genotype is lethal then the expected ratio will match the observed data. c. The cross is Cy + Cy x Cy + Cy + 1/2 Cy + Cy : 1/2 Cy + Cy +, so there would be approximately 90 curly-winged and 90 normal-winged flies Designate the gene p (for pattern). There are 7 alleles, p 1 -p 7, with p 7 being the allele that codes for absence of pattern and p 1 > p 2 > p 3 > p 4 > p 5 > p 6 > p 7. a. There are 7 different patterns possible. These are associated with the following genotypes: p 1, p 2 p a (where p a = p 2, p 3, p 4 p 7 ), p 3 p b (where p b = p 3, p 4, p 5 p 7 ), p 4 p c (where p c = p 4, p 5, p 6, and p 7 ), p 5 p d (where p d = p 5, p 6, and p 7 ), p 6 p e (where p e = p 6 and p 7 ), and p 7 p 7. b. The phenotype dictated by the allele p 1 has the greatest number of genotypes associated with it = 7 (p 1 p 1, p 1 p 2, p 1 p 3, etc.). The absence of pattern is caused by just one genotype, p 7 p McGraw-Hill Education Ltd.
37 c. This finding suggests that the allele determining absence of pattern (p 7 ) is very common in these clover plants with the p 7 p 7 genotype being the most frequent in the population. The other alleles are present, but are much less common in this population a. The 2/3 montezuma : 1/3 wild-type phenotypic ratio, and the statement that montezumas are never true-breeding, together suggest that there is a recessive lethal allele of this gene. When there is a recessive lethal, crossing two heterozygotes results in a 1:2:1 genotypic ratio, but one of the 1/4 classes of homozygotes do not survive. The result is the 2:1 phenotypic ratio as seen in this cross. Both the montezuma parents were therefore heterozygous, Mm. The M allele must confer the montezuma colouring in a dominant fashion, but homozygosity for M is lethal. b. Designate the alleles: M = montezuma, m = green; F = normal fin, f = ruffled fin. Diagram the cross: Mm FF x mm ff expected monohybrid ratio for the M gene alone: 1/2 Mm (montezuma) : 1/2 mm (wild-type); expected monohybrid ratio for the F gene alone: all Ff. The expected dihybrid ratio = 1/2 Mm Ff (montezuma, normal fin) : 1/2 mm Ff (green, normal fin). c. Mm Ff x Mm Ff expected monohybrid ratio for the M gene alone: 2/3 montezuma (Mm) : 1/3 green (mm); expected monohybrid ratio for the F gene alone: 3/4 normal fin (F ) : 1/4 ruffled fin (ff). The expectations when considering both genes together is: 6/12 montezuma normal fin : 2/12 montezuma ruffled fin : 3/12 green normal fin : 1/12 green ruffled fin. Section 2.5 Extensions to Mendel for Gene Interactions a. The mutant plant lacks the function of all three genes, so its genotype must be aa bb cc. b. Considering each gene separately, 3/4 of the F 2 progeny will have at least one dominant allele, whereas 1/4 will be homozygous for the recessive allele. As just seen in part a, mutant plants must be triply homozygous recessive. The chance that a plant will have the aa bb cc genotype is 1/4 x 1/4 x 1/4 = 1/64. All other F 2 plants will be normal for this phenotype, so the fraction of normal plants = 1 1/64 = 63/64. c. The most likely explanation for redundant gene function is that in the relatively recent past, a single gene became duplicated (or in this case, triplicated). The three copies of the SEP gene are nearly identical to each other and thus fulfill the same function. Only if the functions of all three genes are lost does a mutant phenotype result. In fact, these kinds of gene duplication events occur often enough in nature that redundant gene function is a common phenomenon The cross is: black x chestnut F 1 bay F 2 black : bay : chestnut : liver 2017 McGraw-Hill Education Ltd.
38 Four phenotypes in the F2 generation means there are two genes determining coat colour. The F1 bay animals produce four phenotypic classes, so they must be doubly heterozygous, Aa Bb. Crossing a liver-coloured horse to either of the original parents resulted in the parent's phenotype. The liver horse's alleles do not affect the phenotype, suggesting the recessive genotype aa bb. Though it is probable that the original black mare was AA bb and the chestnut stallion was aa BB, each of these animals only produced 3 progeny, so it cannot be definitively concluded that these animals were homozygous for the dominant allele they carry. Thus, the black mare was A bb, the chestnut stallion was aa B, and the F1 bay animals are Aa Bb. The F2 horses were: bay (A B ), liver (aa bb), chestnut (aa B ), and black (A bb) The cross is: walnut x single F 1 walnut x F 1 walnut 93 walnut : 29 rose : 32 pea : 11 single a. How many genes are involved? The four F 2 phenotypes means there are 2 genes, A and B. Both genes affect the same structure, the comb. The F2 phenotypic dihybrid ratio among the progeny is close to 9:3:3:1, so there is no epistasis. Because walnut is the most abundant F2 phenotype, it must be the phenotype due to the A B genotype. Single combs are the least frequent class, and are thus aa bb. Now assign genotypes to the cross. If the walnut F2 are A B, then the original walnut parent must have been AA BB: AA BB x aa bb Aa Bb (walnut) 9/16 A B (walnut) : 3/16 A bb (rose) : 3/16 aa B (pea) : 1/6 aa bb (single). b. Diagram the cross, recalling that the problem states the parents are homozygous: AA bb (rose) x aa BB (pea) Aa Bb (walnut) 9/16 A B (walnut) : 3/16 A bb (rose) : 3/16 aa B (pea) : 1/6 aa bb (single). Notice that this F 2 is in identical proportions as the F 2 generation in part a. c. Diagram the cross: A B (walnut) x aa B (pea) 12 A B (walnut) : 11 aa B (pea) : 3 A bb (rose) : 4 aa bb (single). Because there are pea and single progeny, you know that the walnut parent must be Aa. The 1 A : 1 aa monohybrid ratio in the progeny also tells you the walnut parent must have been Aa. Because some of the progeny are single, you know that both parents must be Bb. In this case, the monohybrid ratio for the B gene is 3 B : 1 bb, so both parents were Bb. The original cross must have been Aa Bb x aa Bb. You can verify that this cross would yield the observed ratio of progeny by multiplying the probabilities expected for each gene alone. For example, you anticipate that 1/2 the progeny would be Aa and 3/4 of the progeny would be Bb, so 1/2 x 3/4 = 3/8 of the progeny should be walnut; this is close to the 12 walnut chickens seen among 30 total progeny McGraw-Hill Education Ltd.
39 d. Diagram the cross: A B (walnut) x A bb (rose) all A B (walnut). The progeny are all walnut, so the walnut parent must be BB. No pea progeny are seen, so both parents cannot be Aa, so one of the two parents must be AA. This could be either the walnut or the rose parent or both green x yellow F 1 green F 2 9 green : 7 yellow a. The 9:7 ratio is a variant of the 9:3:3:1 phenotypic dihybrid ratio arising from complementary gene action, suggesting that two genes are controlling colour. The genotypes are: AA BB (green) x aa bb (yellow) F 1 Aa Bb (green) F 2 9/16 A B (green) : 3/16 A bb (yellow) : 3/16 aa B (yellow) : 1/16 aa bb (yellow). b. F1 Aa Bb x aa bb 1/4 Aa Bb (green) : 1/4 aa Bb (yellow) : 1/4 Aa bb (yellow) : 1/4 aa bb (yellow) = 1/4 green : 3/4 yellow a. Because unaffected individuals had affected children, the trait is recessive. From affected individual II-1, you know the mutant allele is present in this generation. The trait was passed on through II-2 who was a carrier. All children of affected individuals III-2 x III-3 are affected, as predicted for a recessive trait. However, generation V seems inconsistent with recessive inheritance of a single gene. This result is consistent with two different genes involved in hearing with a defect in either gene leading to deafness: The trait is polymorphic. The two family lines shown contain mutations in two separate genes, and the mutant alleles of both genes determining deafness are recessive. b. Individuals in generation V are doubly heterozygous (Aa Bb), having inherited a dominant and recessive allele of each gene from their parents (aa BB x AA bb). The people in generation V are not affected because the product of the dominant allele of each gene is sufficient for normal function. This is an example of complementation: For each gene, the gamete from one parent provided the dominant allele that the gamete from the other parent lacked Dominance relationships are between alleles of the same gene. Only one gene is involved when considering dominance relationships. Epistasis involves two genes. The alleles of one gene affect the phenotypic expression of the second gene a. white x white F 1 white F white : 33 purple At first glance this cross seems to involve only one gene, as true-breeding white parents give white F 1 s. However, if this were true, then the F 2 MUST be totally white as well. The purple F 2 plants 2017 McGraw-Hill Education Ltd.
40 show that this cross is NOT controlled by 1 gene. These results may be due to 2 genes. To determine if this is the case, it makes sense to ask: Does a ratio of 126 : 33 represent a variant of the 9:3:3:1 dihybrid ratio? Usually when you are given raw numbers of individuals for the classes, you divide through by the smallest number, yielding in this case 3.8 white : 1 purple. This is neither a recognizable monohybrid nor dihybrid ratio. Dividing through by the smallest class is NOT the correct way to convert raw numbers to a ratio. Assuming that the F 1 in this case are dihybrids, there must have been 16 different equally likely fertilization events that produced the F 2 progeny (16 boxes in the 4 x 4 Punnett square), even though the phenotypes may not be distributed in the usual 9/16 : 3/16 : 3/16 : 1/16 ratio. If the 159 F 2 progeny are divided equally into 16 fertilization types, then there are 159/16 = ~10 F 2 plants/fertilization type. The 126 white F 2 s therefore represent 126/10 = ~13 of these fertilizations. Likewise the 33 purple plants represent 33/10 = ~3 fertilization types. The F 2 phenotypic ratio is thus 13 white : 3 purple. The data fit the hypothesis that two genes control colour, and that the F 1 are dihybrids. You can now assign genotypes to the parents in the cross. Because the parents are homozygous (true-breeding) and there are 2 genes controlling the phenotypes, there are two possible ways to set up the genotypes of the parents so that the F 1 dihybrids are heterozygous for dominant and recessive alleles of each gene. One option is: AA BB (white) x aa bb (white) Aa Bb (white, same as AA BB parent) 9 A B (white) : 3 A bb (unknown phenotype) : 3 aa B (unknown phenotype) : 1 aa bb (white, same as aa bb parent). If you assume that A bb is white and aa B is purple (or vice versa), then this is a match for the observed data presented in the cross above [( ) = 13 white : 3 purple]. Alternatively, you could try to diagram the cross as AA bb (white) x aa BB (white) Aa Bb (whose phenotype is unknown as this is NOT a genotype seen in the parents) 9 A B (same unknown phenotype as in the F 1 ) : 3 A bb (white like the AA bb parent) : 3 aa B (white like the aa BB parent) : 1 aa bb (unknown phenotype). Such a cross cannot give an F 2 phenotypic ratio of 13 white : 3 purple. The only F 2 classes that could be purple are A B, but this is impossible because this class is larger than the number of purple plants observed and because the F 1 plants must then have been purple; or the aa bb class which is smaller than the number of purple plants observed. Therefore, the first set of possible genotypes (written in bold above) is the best fit for the observed data. Assume that A bb plants are white, and aa B plants are purple. Our model above states that in order to be purple, a plant must have a B allele and no A allele. Thus, we can say that A is epistatic to B. b. white F 2 x white F 2 (self-cross) 3/4 white : 1/4 purple. Assume again that the aa B class is purple in part a above. A 3:1 monohybrid ratio means the parents are both heterozygous for one 2017 McGraw-Hill Education Ltd.
41 gene with purple due to the recessive allele. The second gene is not affecting the ratio, so both parents must be homozygous for the same allele of that gene. Thus the cross must be: Aa BB (white) x Aa BB (white self-cross) 3/4 A BB (white) : 1/4 aa BB (purple). c. purple F 2 x self 3 purple : 1 white. Again, the selfed parent must be heterozygous for one gene and homozygous for the other gene. Because purple is aa B, the genotype of the purple F 2 plant must be aa Bb. d. white F 2 x white F 2 (not a self-cross) 1/2 purple : 1/2 white. The 1:1 monohybrid ratio means a testcross was done for one of the genes. The second gene is not altering the ratio in the progeny, so the parents must be homozygous for that gene. If purple is aa B, then the genotypes of the parents must be aa bb (white) x Aa BB (white) 1/2 Aa Bb (white) : 1/2 aa Bb (purple) I A I B Ss x I A I A Ss expected monohybrid ratio for the I gene of 1/2 I A I A : 1/2 I A I B ; expected ratio for the S gene considered alone of 3/4 S : 1/4 ss. Use the product rule to generate the phenotypic ratio for both genes considered together and then assign phenotypes, remembering that all individuals with the ss genotype look like type O. The apparent phenotypic ratio for both genes is: 3/8 I A I A S : 3/8 I A I B S : 1/8 I A I A ss : 1/8 I A I B ss = 3/8 A : 3/8 AB : 1/8 O : 1/8 O = 3/8 Type A : 3/8 Type AB : 2/8 Type O a. The cross is between two normal flies that carry H and S. These individuals cannot be homozygous for H or for S, because we are told that both are lethal in homozygotes. Thus, the mating described is a dihybrid cross: Hh Ss x Hh Ss. The genotypic classes among the progeny zygotes should be 9 H S, 3 H ss, 3 hh S, and 1 hh ss. However, all zygotes that are HH or SS or both will die before they hatch into adult flies. You could do this problem as a branched-line diagram as shown in the following figure, in which the progeny should be 2/3 Hh and 1/3 hh (considering the H gene alone) and 2/3 Ss and 1/3 ss (considering the S gene alone). As can be seen from the diagram, 7/9 of the adult progeny will be normal, and 2/9 will be hairless. 2/3 Hh 2/3 Ss 4/9 Hh Ss (Normal) 1/3 ss 2/9 Hh ss (Hairless) 1/3 hh 2/3 Ss 1/3 ss 2/9 hh Ss 1/9 hh ss (Normal) (Normal) 2017 McGraw-Hill Education Ltd.
42 b. As just seen in the diagram, the hairless progeny of the cross in part a are Hh ss, and these are mated with parental flies that are Hh Ss. You could again portray the results of this cross as a branched-line diagram. For the H gene, again 2/3 of the viable adult progeny will be Hh and 1/3 will be hh. The cross involving the S gene is a testcross, and all the progeny will be viable, so 1/2 the progeny will be Ss and 1/2 will be ss. As seen in the diagram that follows, 2/6 = 1/3 of the progeny will be hairless and the remaining 2/3 will be normal. 2/3 Hh 1/2 Ss 2/6 Hh Ss (Normal) 1/2 ss 2/6 Hh ss (Hairless) 1/3 hh 1/2 Ss 1/2 ss 1/6 hh Ss 1/6 hh ss (Normal) (Normal) a. blood types: I-1 AB; I-2 A; I-3 B; I-4 AB; II-1 O; II-2 O; II-3 AB; III-1 A; III-2 O. b. genotypes: I-1 Hh I A I B ; I-2 Hh I A i (or I A I A ); I-3 H I B i (or I B I B ); I-4 H I A I B ; II-1 H ii; II-2 hh I A I A (or I A i or I A I B ); II-3 Hh I A I B ; III-1 Hh I A i; III-2 hh I A I A (or I A I B or I A i or I b i or I B I B ) At first glance, you find inconsistencies between expectations and what could be inherited from a parent. For example, I-1 (AB) I-2 (A) could not have an O child (II-2). The epistatic h allele (which causes the Bombay phenotype) could explain these inconsistencies. If II-2 has an O phenotype because she is hh, her parents must both have been Hh. The Bombay phenotype would also explain the second seeming inconsistency of two O individuals (II-1 and II-2) having an A child. II-2 could have received an I A allele from one of her parents and passed this on to III-1 together with one h allele. Parent II-1 would have to contribute the H allele so that the I A allele would be expressed; the presence of H means that II-1 must also be ii in order to be type O. A third inconsistency is that individuals II-2 and II-3 could not have an ii child since II-3 has the I A I B genotype, but III-2 has the O phenotype. This could also be explained if II-3 is Hh and III-2 is hh The difference between traits determined by a single pleiotropic gene and traits determined by several genes would be seen if crosses were done using pure-breeding plants (wild-type x mutant), then selfing the F1 progeny. If several genes were involved there would be several different 2017 McGraw-Hill Education Ltd.
43 Chapter 2 combinations of the petal colour, markings, and stem position phenotypes in the F2 generation. If all 3 traits were due to an allele present at one gene, the three phenotypes would always be inherited together and the F 2 plants would be either yellow, dark brown, and erect OR white, no markings, and prostrate Diagram the cross. Figure out an expected monohybrid ratio for each gene separately, then apply the product rule to generate the expected dihybrid ratio. A y A Cc x A y A cc monohybrid ratio for the A gene alone: 1/4 A y A y (dead) : 1/2 A y A (yellow) : 1/4 AA (agouti) = 2/3 A y A (yellow) : 1/3 AA (agouti); monohybrid ratio for the C gene: 1/2 Cc (non-albino) : 1/2 cc (albino). Overall there will be 2/6 A y A Cc (yellow) : 2/6 A y A cc (albino) : 1/6 AA Cc (agouti) : 1/6 AA cc (albino) = 2/6 A y A Cc (yellow) : 3/6 cc (albino) : 1/6 AA Cc (agouti). Note that the A y A cc animals must be albino because the albino parent had exactly the same genotype; this indicates that cc is epistatic to all alleles of gene A. Although you were not explicitly told that the AA cc animals are also albino, this makes sense because in Figure 2.44, cc is epistatic to all alleles of another gene B in animals that must have been AA. (Another way to think of this is that the cc albino colour must be epistatic to alleles of all genes that confer colour because no pigments are produced.) a. Diagram one of the crosses: white-1 x white-2 red F 1 F 2 9 red : 7 white Even though there are only 2 phenotypes in the F 2, colour is not controlled by one gene - the 9:7 ratio is a variation of 9:3:3:1, so there are 2 genes controlling these phenotypes. Individuals must have at least one dominant allele of each gene in order to get the red colour; this is an example of complementary gene action. Thus the genotypes of the two pure-breeding white parents in this cross are aa BB x AA bb. The same conclusions hold for the other 2 crosses. If white-1 is aa BB and white-2 is AA bb, then white-3 must be AA BB cc. The reason is that if white-3 had the same genotype as white-1 or white-2, then one of the three crosses would have produced an all white F 1 (no complementation). Because none of the crosses had an all white F 1, we can conclude that three genes are involved. b. white-1 is aa BB CC; white-2 is AA bb CC; and white-3 is AA BB cc McGraw-Hill Education Ltd.
44 Chapter 2 c. aa BB CC (white-1) x AA bb CC (white-2) Aa Bb CC (red) 9/16 A B CC (red) : 3/16 A bb CC (white) : 3/16 aa B CC (white) : 1/6 aa bb CC (white). Red colour requires a dominant, functional allele of each of the three genes (A B C ) You know about the alleles of the A gene (A for agouti, a t for black/yellow, a for black, and A y for recessive lethal yellow) from Figure 2.28 and Figure You know about the interaction of the B and C genes governing the variation in black, brown, and albino colours from Figure a. The yellow parent must have an A y allele, but we don't know the second allele of the A gene (A y ). We don't know at the outset what alleles this yellow mouse has at the B gene, so we'll leave these alleles for the time being as??. Since this mouse does show colour we know it is not cc (albino), so it must have at least one C allele (C ). The brown agouti parent has at least one A allele (A ); it must be bb at the B gene; and since there is colour it must also be C. The mating between these two can thus be represented as A y?? C x A bb C. Now consider the progeny. Because one pup was albino (cc), the parents must both be Cc. A brown pup (bb) indicates that both parents had to be able to contribute a b allele, so we now know the first mouse (the yellow parent) must have had at least one b allele. The fact that this brown pup was non-agouti means both parents carried an a allele. The black agouti progeny tells us that the first mouse must have also had a B allele. This latter fact also clarifies that A y is epistatic to B because this parent was yellow rather than black. The complete genotypes of the mice are therefore: A y a Bb Cc x Aa bb Cc. b. Think about each gene individually, then the effect of the other genes in combination with that phenotype. C leads to a phenotype with colour; cc gives albino (which is epistatic to all colours determined by the other genes because no pigments are produced). The possible genotypes of the progeny of this cross for the A gene are A y A, A y a, Aa, and aa, giving yellow, yellow, agouti, and non-agouti phenotypes, respectively. Since yellow (A y ) is epistatic to B, non-albino mice with A y will be yellow regardless of the genotype of the B gene. Aa is agouti; with the aa genotype there is no yellow on the hair (non-agouti). The type of colouration depends on the B gene. For B the offspring could be Bb (black) or bb (brown). In total, six different coat colour phenotypes are possible: albino ( cc), yellow (A y (A or a) C ), brown agouti (A bb C ), black agouti (A B C ), brown (aa bb C ), and black (aa B C ). [Note: Although A y (yellow colour) is in fact epistatic to B (black) or bb (brown) colours governed by the B gene, you were not explicitly 2014 McGraw-Hill Ryerson Ltd. 2-3
45 Chapter 2 told this. Thus, based on the information provided, you might have included an additional colour phenotype if you considered that A y (A or a) bb C had a lighter colour than the yellow of A y (A or a) Bb C animals.] a. No, a single gene cannot account for this result. While the 1:1 ratio seems like a testcross, the fact that the phenotype of one class of offspring (linear) is not the same as either of the parents argues against this being a testcross. b. The appearance of four phenotypes means two genes are controlling the phenotypes. c. The 3:1 ratio suggests that two alleles of one gene determine the difference between the wildtype and scattered patterns. d. The true-breeding wild-type fish are homozygous by definition, and the scattered fish have to be homozygous recessive according to the ratio seen in part c, so the cross is: bb (scattered) x BB (wild-type) F 1 Bb (wild-type) 3/4 B (wild-type) : 1/4 bb (scattered). e. The inability to obtain a true-breeding nude stock suggests that the nude fish are heterozygous (Aa) and that the AA genotype dies. Thus Aa (nude) x Aa (nude) 2/3 Aa (nude) : 1/3 aa (scattered). f. Going back to the linear cross from part b, the fact that there are four phenotypes led us to propose two genes were involved. The 6:3:2:1 ratio looks like an altered 9:3:3:1 ratio in which some genotypes may be missing, as predicted from the result in part e that AA animals do not survive. The 9:3:3:1 ratio results from crossing double heterozygotes, so the linear parents are doubly heterozygous Aa Bb. The lethal phenotype associated with the AA genotype produces the 6:3:2:1 ratio. The phenotypes and corresponding genotypes of the progeny of the linear x linear cross are: 6 linear, Aa B : 3 wild-type, aa B : 2 nude, Aa bb : 1 scattered, aa bb. Note that the AA BB, AA Bb, AA Bb, and AA bb genotypes are missing due to lethality a. Aa Bb Cc x Aa Bb Cc 9/16 A B x 3/4 C : 9/16 A B x 1/4 cc : 3/16 A bb x 3/4 C : 3/16 A bb x 1/4 cc: 3/16 aa B x 3/4 C : 3/16 aa B x 1/4 cc : 1/16 aa bb x 3/4 C : 1/16 aa bb x 1/4 cc = 27/64 A B C (wild-type) : 9/64 A B cc : 9/64 A bb C : 3/64 A bb cc : 9/64 aa B C : 3/64 aa B cc : 3/64 aa bb C : 1/64 aa bb cc = 27/64 wild-type : 37/64 mutant McGraw-Hill Education Ltd.
46 Chapter 2 b. Diagram the crosses: 1. unknown male x AA bb cc 1/4 wild-type (A B C ) : 3/4 mutant 2. unknown male x aa BB cc 1/2 wild-type (A B C ) : 1/2 mutant 3. unknown male x aa bb CC 1/2 wild-type (A B C ) : 1/2 mutant The 1:1 ratio in testcrosses 2 and 3 is expected if the unknown male is heterozygous for one of the genes that are recessive in the testcross parent. The 1 wild-type : 3 mutant ratio arises when the male is heterozygous for two of the genes that are homozygous recessive in the testcross parent. (If you apply the product rule to 1/2 B : 1/2 bb and 1/2 C : 1/2 cc in the first cross, then you find 1/4 B C, 1/4 B cc, 1/4 bb C, and 1/4 bb cc. Only B C will be wild-type, the other 3 classes will be mutant.) Thus the unknown male must be Bb Cc. In testcross 1 the male could be either AA or aa. Crosses 2 and 3 show that the male is only heterozygous for one of the genes in each case: gene C in testcross 2 and gene B in testcross 3. In order to get wild-type progeny in both crosses, the male must be AA. Therefore the genotype of the unknown male is AA Bb Cc In Figure 2.48b the A 1 and B 1 alleles each have the same effect on the phenotype (plant height in this example), while the A 0 and B 0 alleles are non-functional. Thus, the shortest plants are A 0 A 0 B 0 B 0, and the tallest plants are A 1 A 1 B 1 B 1. The phenotypes are determined by the total number of A 1 and B 1 alleles in the genotype. Thus, A 1 A 0 B 0 B 0 plants are the same phenotype as A 0 A 0 B 0 B 1. In total there will be 5 different phenotypes: 4 '0' alleles (total = 0); 1 '1' allele + 3 '0' alleles (total = 1); 2 '1' alleles + 2 '0' alleles (total = 2); 3 '1' alleles + 1 '0' allele (total = 3); and 4 '1' alleles (total = 4). In Figure 2.43 the a allele = b allele = no function (in this case no colour = white). If the A allele has the same level of function as a B allele then you would see 5 phenotypes as was the case for Figure 2.48b. But since there are a total of 9 phenotypes, this cannot be true so A B. Notice that aa Bb is lighter than Aa bb even though both genotypes have the same number of dominant alleles. Thus, in Figure 2.43 an A allele has more effect on colouration than a B allele. If you assume, for example, that B = 1 unit of colour and A = 1.5 units of colour, then 16 genotypes lead to 9 phenotypes McGraw-Hill Ryerson Ltd. 2-5
47 Chapter 2 a. Analyze each cross by determining how many genes are involved in the phenotypes and the relationships between the alleles of these genes. In cross 1, there are 2 genes because there are 3 classes in the F 2 showing a modified 9:3:3:1 ratio (12:1:3), and LR is the doubly homozygous recessive class. In cross 2, only 1 gene is involved because there are 2 phenotypes in a 3:1 ratio; WR>DR. In cross 3, there is again only 1 gene involved (2 phenotypes in a 1:3 ratio); DR>LR. In cross 4, there is 1 gene (2 phenotypes, with a 3:1 ratio); WR>LR. In cross 5, there are again 2 genes (and as in cross 1, there is a 12:1:3 ratio of three classes); LR is the double homozygous recessive. In total, there are 2 genes controlling these phenotypes in foxgloves. b. Remember that all four starting strains are true-breeding. In cross 1 the parents can be assigned the following genotypes: AA BB (WR-1) x aa bb (LR) Aa Bb (WR) 9 A B (WR) : 3 A bb (WR; this class displays the epistatic interaction) : 3 aa B (DR) : 1 aa bb (LR). The results of cross 2 suggested that DR differs from WR-1 by one gene, so DR is aa BB; cross 3 confirms these genotypes for DR and LR. Cross 4 introduces WR-2, which differs from LR by one gene and differs from DR by 2 genes, so WR-2 is AA bb. Cross 5 would then be AA bb (WR-2) x aa BB (DR) Aa Bb (WR) 9 A B (WR) : 3 A bb (WR) : 3 aa B (DR) : 1 aa bb (LR) = 12 WR : 3 DR : 1 LR. c. WR from the F 2 of cross 1 x LR 253 WR : 124 DR : 123 LR. Remember from part b that LR is aa bb and DR is aa B while WR can be either A B or A bb = A??. The experiment is essentially a testcross for the WR parent. The observed monohybrid ratio for the A gene is 1/2 Aa : 1/2 aa (253 Aa : aa), so the WR parent must be Aa. The DR and LR classes of progeny show that the WR parent is also heterozygous for the B gene (DR is Bb and LR is bb in these progeny). Thus, the cross is Aa Bb (WR) x aa bb (LR) a. For all 5 crosses, determine the number of genes involved in the trait and the dominance relationships between the alleles. Cross 1: 1 gene, red > blue. Cross 2: 1 gene, lavender > blue. Cross 3: 1 gene, codominance/incomplete dominance (1:2:1), bronze is the phenotype of the heterozygote. Cross 4: 2 genes with epistasis (9 red : 4 yellow : 3 blue). Cross 5: 2 genes with epistasis (9 lavender : 4 yellow : 3 blue). In total there are 2 genes. One gene controls blue (c b ), red (c r ), and lavender (c l ), where c r = c l > c b. The second gene controls the yellow phenotype: Y seems to be colourless (or has no effect on colour), so the phenotype is McGraw-Hill Education Ltd.
48 Chapter 2 determined by the alleles of the c gene. The y allele makes the flower yellow, and is epistatic to all alleles of the c gene. b. cross 1: c r c r YY (red) x c b c b YY (blue) c r c b YY (red) 3/4 c r YY (red) : 1/4 c b c b YY (blue) cross 2: c l c l YY (lavender) x c b c b YY (blue) c l c b YY (lavender) 3/4 c l YY (lavender) : 1/4 c b c b YY (blue) cross 3: c l c l YY (lavender) x c r c r YY (red) c l c r YY (bronze) 1/4 c l c l YY (lavender) : 1/2 c l c r YY (bronze) : 1/4 c r c r YY (red) cross 4: c r c r YY (red) x c b c b yy (yellow) c r c b Yy (red) 9/16 c r Y (red) : 3/16 c r yy (yellow) : 3/16 c b c b Y (blue): 1/16 c b c b yy (yellow) cross 5: c l c l yy (yellow) x c b c b YY (blue) c l c b Yy (lavender) 9/16 c l Y (lavender) : 3/16 c l yy (yellow) : 3/16 c b c b Y (blue) : 1/16 c b c b yy (yellow) c. c r c r yy (yellow) x c l c l YY (lavender) c r c l Yy (bronze) monohybrid ratio for the c gene is 1/4 c r c r : 1/2 c r c l : 1/4 c l c l and monohybrid ratio for the Y gene is 3/4 Y : 1/4 yy. Using the product rule, these generate a dihybrid ratio of 3/16 c r c r Y (red) : 3/8 c r c l Y (bronze) : 3/16 c l c l Y (lavender) : 1/16 c r c r yy (yellow) : 1/8 c r c l yy (novel genotype) : 1/16 c l c l yy (yellow). You expect the c r c l yy genotype to be yellow as y is normally epistatic to the c gene. However, you have no direct evidence from the data in any of these crosses that this will be the case, so it is possible that this genotype could cause a different and perhaps completely new phenotype This problem shows that gene interactions producing variations of the 9:3:3:1 ratio in addition to those shown in Table 2.5 are possible though rare. a. Using the information provided, it is clear that one of the pure-breeding white strains must be homozygous for recessive alleles of gene A and the other pure-breeding white strain must be homozygous for recessive alleles of gene B. That is, the cross was AA bb (white) x aa BB (white) F 1 Aa Bb (all blue). b. In the F 2 generation produced by self-mating of the F 1 plants, you would find a genotypic ratio of 9 A B : 3 A bb : 3 aa B : 1 aa bb. The A B plants would have blue flowers because colourless precursor 1 would be converted into blue pigment. (Colourless precursor 2 would not produce blue pigment in these flowers because the pathway is suppressed by the proteins specified by the dominant alleles of the two genes.) The A bb plants would be white because the 2014 McGraw-Hill Ryerson Ltd. 2-7
49 Chapter 2 first pathway could not produce blue pigment in the absence of the protein specified by B, while the second pathway would be shut off by the protein specified by A. The aa B plants would be white because the first pathway could not produce blue pigment in the absence of the protein specified by A, while the second pathway would be shut off by the protein specified by B. Interestingly, the aa bb plants would be blue because even though the first pathway would not function, the second would as it is not suppressed. You would thus expect in the F 2 generation a ratio of 10 blue (9 A B + 1 aa bb) : 6 white (3 A bb + 3 aa B ) The answers are presented in the table below. Different colours in the table represent different phenotypes; these colours are chosen arbitrarily and do not signify anything. The numbers in parentheses indicate the compounds that are present to produce the colours. Part 9 A B 3 A bb 3 aa B 1 aa bb Ratio A (2 + 4) (2 + 3) (1 + 4) (1 + 3) 9:3:3:1 B (2) (2) (2) (1) 15:1 C (3) (2) (1) (1) 9:3:4 D (2) (1) (1) (1) 9:7 E (2 + 3) (2) (3) (1) 9:3:3:1 F (2 + 4) = (2) (2 + 3) = (2) (1 + 4) (1 + 3) 12:3:1 G (3) (2) = (1) (1) = (2) (1) = (2) 9:7 H (2) (1) (2) (2) 13:3 [Note: In part e, you could have interpreted a limitless supply of compound 1 to mean that compound 1 would be present in all the phenotypes (for example, the A B genotype would have compounds , etc.). The ratio would still be the same under this assumption as the ratio listed in the table.] A particular phenotypic ratio does not allow you to infer the operation of a specific biochemical mechanism because as can be seen from the answers to Problem 80, different biochemical mechanisms can produce the same ratio of phenotypes (for example, the pathways in parts d and g are different yet both yield 9:7 ratios). The particular ratio seen in a cross may nonetheless provide information about types of biochemical pathways you could exclude from consideration because those pathways could not produce the observed ratio McGraw-Hill Education Ltd.
50 Chapter 2 In contrast, if you know the biochemical mechanism behind a gene interaction and you also know the dominance relationships of the alleles, you can then trace out the consequences of each genotypic class and thus you can predict the ratios of phenotypes you would see among the F 2 progeny a. There are actually two different phenotypes mentioned in this problem. One phenotype is the shape of the erythrocytes. All people with the genotype SPH SPH + have spherical erythrocytes. Therefore this phenotype is fully penetrant and shows no variation in expression. The second phenotype is anaemia. Here the expressivity among anaemic patients varies from severe to mild. There are even some people with the SPH SPH + genotype (150/2400) with no symptoms of anaemia at all. Thus the penetrance of the anaemic phenotype is 2250/2400 or b. The disease-causing phenotype is the anaemia and the severity of the anaemia is greatly reduced when the spleen functions poorly and does not "read" the spherical erythrocytes. Therefore treatment might involve removing the spleen (an organ which is not essential to survival). The more efficiently the spleen functions, the earlier in a patient's life it should be removed. SPH SPH + individuals with no symptoms of anaemia should not be subjected to this drastic treatment a. The most likely mode of inheritance is a single gene with incomplete dominance such that f n f n = normal (<250 mg/dl), f n f a = intermediate levels of serum cholesterol ( mg/dl), and f a f a homozygotes = elevated levels (>500 mg/dl). Some of the individuals in the pedigrees do not fit this hypothesis. In 2 of the families (Families 2 and 4), two normal parents have a child with intermediate levels of serum cholesterol. One possibility is that in each family, at least one of these normal parents (I-3 and/or I-4 in Family 2; I-1 and/or I-2 in Family 4) was actually a f n f a heterozygote who did not have elevated cholesterol in excess of 250 mg/dl. In this scenario, familial hypercholesterolaemia is a trait with incomplete penetrance, so that some unaffected people have a genotype that causes the disease in other people. It is also possible that the affected children of these parents do not have an f a allele associated with elevated serum 2014 McGraw-Hill Ryerson Ltd. 2-9
51 Chapter 2 cholesterol, but they show the trait for other reasons such as diet, level of exercise, or other genes. This explanation is reasonable, but perhaps less likely because multiple children would have to have the trait but not the f a allele. b. Familial hypercholesterolaemia also shows variable expressivity, meaning that people with the same genotype have the condition, but to different extents. This suggests that factors other than just the genotype are involved in the expression of the phenotype. Such factors could again include diet, level of exercise, and other genes If polycystic kidney disease is dominant, then the child is Pp and inherited the P disease allele from one parent or the other, yet phenotypically the parents appear to be pp. Perhaps one of the parents is indeed Pp, but this parent does not show the disease phenotype for some reason. Such situations are not uncommon: the unexpressed dominant allele is said to have incomplete penetrance in these cases. Alternatively, it could be that both parents are indeed pp and the P allele inherited by the child was due to a spontaneous mutation during the formation of the gamete in one of the parents; we will discuss this topic in Chapter 8. It is also possible that the father of the child is not the male parent of the couple. In this case the biological father must have the disease a. The pattern in both families looks like a recessive trait since unaffected individuals have affected progeny and the trait skips generations. For example, in the Smiths II-3 must be a carrier, but in order for III-5 to be affected II-4 must also be a carrier. If the trait is rare (as is this one) you wouldn't expect two heterozygotes to marry by chance as many times as required by these pedigrees. The alternative explanation is that the trait is dominant but not 100% penetrant. b. Assuming this is a dominant but not completely penetrant trait, individuals II-3 and III-6 in the Smiths' pedigree and individual II-6 in the Jeffersons' pedigree must carry the dominant allele but not express it in their phenotypes. c. If the trait were common, recessive inheritance is the more likely mode of inheritance McGraw-Hill Education Ltd.
52 Chapter 2 d. None; in cases where two unaffected parents have an affected child, both parents would be carriers of the recessive trait The hairy x hairy 2/3 hairy : 1/3 normal cross described in the first paragraph of the problem tells us that the hairy flies are heterozygous, that the hairy phenotype is dominant to normal, and that the homozygous hairy progeny are lethal (that is, hairy is a recessive lethal). Thus, hairy wings is Hh, normal wings is hh, and the lethal genotype is HH. Normal flies therefore should be hh (normal-1) and a cross with hairy (Hh) would be expected to always give 1/2 Hh (hairy) : 1/2 hh (normal) as seen in cross 1. In cross 2, the progeny MUST for the same reasons be 1/2 Hh : 1/2 hh, yet they ALL appear normal. This suggests the normal-2 stock has another mutation that suppresses the hairy wing phenotype in the Hh progeny. The hairy parent must have the recessive alleles of this suppressor gene (ss), while the normal-2 stock must be homozygous for the dominant allele (SS) that suppresses the hairy phenotype. Thus cross 2 is hh SS (normal-2) x Hh ss (hairy) 1/2 Hh Ss (normal because hairy is suppressed) : 1/2 hh Ss (normal). In cross 3, the normal-3 parent is heterozygous for the suppressor gene: hh Ss (normal-3) x Hh ss (hairy) the expected ratios for each gene alone are 1/2 Hh : 1/2 hh, and 1/2 Ss : 1/2 ss, so the expected ratio for the two genes together is 1/4 Hh Ss (normal) : 1/4 Hh ss (hairy) : 1/4 hh Ss (normal) : 1/4 hh ss (normal) = 3/4 normal : 1/4 hairy. In cross 4 you see a 2/3 : 1/3 ratio again, as if you were crossing hairy x hairy. After a bit of trialand-error examining the remaining possibilities for these two genes, you will be able to demonstrate that this cross was Hh Ss (normal-4) x Hh ss (hairy) expected ratio for the individual genes are 2/3 Hh : 1/3 hh, and 1/2 Ss : 1/2 ss, so the expected ratio for the two genes together from the product rule is 2/6 Hh Ss (normal) : 2/6 Hh ss (hairy) : 1/6 hh Ss (normal) : 1/6 hh ss (normal) = 2/3 normal : 1/3 hairy The Black Lab: A solid black dog must: deposit eumelanin (E ); not be brown (B ); have no pheomelanin striping in the hairs [(K B and any A gene alleles) or (aa and any K gene alleles)]; must not be diluted to gray (D ); no spotting (S ); and no merle (M 2 M 2 ). Because Labs always breed true for solid colours (black, brown, or some light yellow colour), the black Lab cannot be heterozygous at 2014 McGraw-Hill Ryerson Ltd. 2-11
53 Chapter 2 any gene for recessive alleles that specify non-solid colours. So the Black Lab is most likely: EE or Ee, BB or Bb, (K B K B and any gene A alleles) or (K B k y aa), DD, SS, M 2 M 2. The Chocolate Lab: A solid chocolate brown dog would be the same genotype as solid black, except bb. The Yellow Lab: A solid yellow dog must not deposit eumelanin (ee). Any alleles of gene B are possible, and as above, the dog must be DD, SS, and M 2 M 2. The same considerations for genes A and K apply as for the other Labs above. The yellow dog pictured cannot be aa, however, or it would be white. Therefore, yellow labs are ee, B or bb, K B K B, any gene A alleles except aa, DD, SS, M 2 M McGraw-Hill Education Ltd.
54 Reference B 1 Reference B Arabidopsis thaliana: Genetic Portrait of a Model Plant Synopsis: Arabidopsis thaliana serves as a useful plant model for genetic and molecular analyses. While many of the basic cellular mechanisms are the same in plants and animal cells, the events during development in plants are quite different from animals. Even so, the unique developmental events in plants often have underlying mechanisms that are analogous to those found in animals, fungi, etc. The following list of characteristics of Arabidopsis indicates why it is a useful model for plant development, and points out some genetic characteristics and manipulations that are unique to this plant. Arabidopsis has a fast generation time compared to other plants. Each plant can produce a large number of seeds, which is advantageous for mutant screening. Researchers can manipulate whether a plant undergoes self-fertilization or an outcross. Mutant screens can be done using T-DNA or other transposable elements to create mutations. This facilitates the identification of the altered gene at the DNA level. Very little repetitive DNA is present in Arabidopsis, so the genome is very small for a plant. Most other plants have very large genome, mostly because they contain massive amounts of repetitive DNA. Significant Elements: After reading the chapter and thinking about the concepts, you should be able to: think about how genetic analysis is done in this organism including: mutagenesis, isolation of mutants, characterization of mutations (complementation and epistasis analyses), study of mutant phenotypes, and gene understand how to interpret data obtained with molecular methods such as gene cloning, PCR, nucleic acid hybridization, the use of DNA markers for mapping, the use of fusions to study gene expression, and making a mutant copy of a cloned gene for reintroduction into the genome describe the steps that would be involved in a search for the gene affected by a T-DNA induced mutation Problem Solving Tips: Remember that a seed contains a plant embryo. When seeds are mutagenized you are NOT mutagenizing gametes. Gametes are produced in the reproductive structures of an adult plant.
55 2 Reference B Some of the longer problems in this chapter are real research problems that were carried out essentially as described to you. They require that you integrate your knowledge of classical genetics, molecular genetics, and genome analysis. This is a good time to try out thinking like a geneticist. Consider how you would discover the genes involved, and how you would determine how the products of these genes might act - whether as regulators, messengers in a signal transduction system, structural components, etc. Solutions to Problems: B-1. a. 3; b. 1; c. 4; d. 5; e. 2. B-2. a. The shorter generation time of Arabidopsis allows the geneticist to study many more generations in less time. In corn or peas, a researcher would be able to generate at most a few generations in a year. b. The very large number of seeds produced is an advantage for a geneticist searching for rare mutations. c. The small genome size is advantageous for molecular analysis, in particular for cloning genes. There is very little repetitive DNA to have to deal with. Historically, the small genome size made it feasible to determine the complete DNA sequence of the genome; Arabidposis is the first plant for which this goal was achieved. B-3. Most of the extra DNA in tobacco and pea is repetitive DNA which presumably is not necessary for the physiology of the plant. Most repetitive DNA does not encode genes, so it does not contribute to the proteins made in the organism. In large part due to the paucity of repetitive DNA, genes in Arabidposis are packed more closely together (less intervening DNA) and the number and sizes of introns are smaller than in other plant species. B-4. a. Plants of different strains that show the extreme phenotypes (the largest compared to the smallest seed set) could be crossed to produce hybrid F 1 plants that are then self-fertilized to produce the F 2 generation. If the plants in the F 2 generation show three discrete phenotypes then there is a single gene that determines the trait. The three phenotypes would be associated
56 Reference B 3 with the AA, Aa, and aa genotypes. If these plants instead displayed a few more clear-cut phenotypic classes then two or three genes would be involved. If the F 2 plants have a range of phenotypes in a continuum, the trait is determined by several genes and might also have an environmental component. b. Different strains contain different alleles of molecular markers that can be used to identify regions containing genes involved in determination of the phenotype. One would look for genetic linkage to molecular markers and use this linkage information to aid in cloning the gene of interest. See Chapter 21 for a discussion of quantitative trait analysis. B-5. a. Endosperm is 3n and is formed by fertilization of one sperm nucleus and two 1n nuclei in the ovule. The genotype of the endosperm will be similar that of the embryo, in the sense that the endosperm produced from an outcross will yield a combination of genetic information from both parents. b. The zygote is 2n and is formed by fertilization of one sperm nucleus with the 1n egg; the genotype will again be a combination of genetic information from both parents. c. The embryo sac cells are 1n and they are derived from the female parent plant. The embryo sac cells will have the genotype derived from the female parent plant on which they are found, and thus have a very different genotype than the embryo. B-6. A geneticist usually wants to study mutations that are in the germ cells and can therefore be transmitted to progeny and maintained as stocks for further study. The cells that were mutagenized are the embryonic cells in the seed that will divide and develop into the plant. If the mutagen were applied very early, soon after fertilization, it might only affect one of the two DNA strands on a chromosome in the original zygotic cell, in which case one daughter cell would be mutant and the other would be normal. Alternatively, if the mutagen were applied later in embryonic development the mutation causing the phenotype might have occurred in only one of many embryonic cells present at that time. In either case, the plant growing from the mutagenized seed would be a mosaic, with some cells carrying the mutation, and others being wild type. The first generation mutations might only affect tissues that could not become germ cells, and the trait would therefore not be transmissible. B-7. a. 2; b. 3; c. 1.
57 4 Reference B B-8. The technique you would use is summarized in Figure B.11. The DNA transformed into Arabidopsis would have an inverted duplication of the entire gene of interest or even of a part of the gene. This inverted duplication would be under the control of a promoter that can be expressed in all or most Arabidopsis tissues. Cells bearing the transgene will express an RNA molecule that will fold on itself to form a double-stranded RNA (dsrna) with a hairpin loop between the inverted repeats. The Dicer complex within Arabidopsis cells will cleave this long dsrna into 21 bp fragments of dsrna. Target mrnas are recognized by the RISC carrying RNA fragments and cleaved into smaller, non-coding fragments. Thus, the expression of the gene of interest will be silenced, even though a true mutation in that gene is not available. B-9. You could do manipulated crosses where you collect pollen from the sterile plant and use it to fertilize a wild-type plant. The reciprocal cross would also be done: pollen from a wild-type plant crossed with the sterile mutant. From the results you would know if the defect was in the male or female reproductive structures (assuming that one of the crosses would produce progeny while the other cross could not). B-10. To look for an homolog for a gene in other plants, you would perform a whole genome Southern blot. You would first make genomic DNA from the petunias, snapdragons, and potatoes; cut these genomic DNAs with restriction enzymes, separate the resultant restriction fragments by gel electrophoresis according to their size, and then transfer the DNA fragments to nitrocellulose filter paper. You would then do a Southern blot hybridization using the APETALA gene from Arabidopsis as a probe. Two other approaches are also conceivable. First, if other investigators have determined the sequences of parts of the genomes of these other plants, or EST sequences from individual cdna clones from these organisms, you could perform computerized BLAST searches to see if any of these nucleic acid sequences could encode a protein related to that encoded by APETALA. Second, you could try to amplify APETELA-like sequences from the genomes or cdna libraries of the other species using PCR. However, this would only work if the protein were highly conserved in evolution; even if all the amino acids encoded by the sequences in the PCR primers were identical to those in the Arabidopsis protein, you would still have to account for the degeneracy of the genetic code and devise sets of primers that could account for all the possible codons for those amino acids.
58 Reference B 5 B-11. a. You could examine the gravitropic response in an auxin mutant (defective in auxin production). If the gravitropic response is lacking in an auxin mutant, the response must be either directly or indirectly mediated by auxin. b. There are a several different ways you could examine the distribution. You could perform a Northern blot analyzing the expression of each auxin-regulated mrna. You would cut the plant up into different parts (such as the hypocotyls, flowering stalk, and root), and then grind up each tissue sample in order to isolate its RNAs. You would then fractionate these RNAs according to their sizes on a gel, transfer the RNAs to nitrocellulose filter paper, and hybridize using an auxin-regulated gene as a probe. For a more accurate picture, you could use DNA for an auxin-regulated gene as a probe against preparations of tissue from the plant (that is, an in situ hybridization). Or, you could make a fusion between an auxin-regulated gene and a reporter gene such as GUS or luciferase (which emits light when given substrate luciferin), transform the fusion back into the plant, and look at the distribution of where the reporter gene is expressed in the intact plant. B-12. a. The ctr1 - constitutive mutation in a signaling pathway should not be affected by what is happening in the ethylene biosynthesis. This is because in mutant plants, the pathway is turned on independently of the production of ethylene. Thus, there would still be expression of the ethylene response in ctr1 - mutants even if ethylene biosynthesis were inhibited. b. Because inhibitors of biosynthesis affect these mutants, the mutations are in genes in the biosynthetic pathway. c. You could look for additional copies of the ETR1 gene by Southern hybridization using the ETR1 gene to probe in a blot containing genomic Arabidopsis genomic DNA. Because the complete genome sequence of Arabidopsis is available, one could also perform a BLAST search to search for similar sequences. d. The protein encoded by APETALA2 is known to be a transcription factor, and the information provided indicates that the EREBP proteins are also transcription factors that bind to bases in the promoter region of several ethylene-responsive genes. These proteins might thus share some similar features (types of motifs) that would allow DNA binding or transcriptional activation/repression. e. To control expression of the ethylene response genes, you would need to make a fusion of an inducible regulatory region with the ethylene response gene you want to induce. The
59 6 Reference B inducible regulatory region would have to be one that you could turn on in the plant cells where you wanted expression. Identifying a suitable inducible regulatory region might take some effort. For example, you might want to look at many plants transformed with a modified T- DNA that carries a promoterless GUS gene reporter. In each transformed plant line, GUS will be expressed in specific parts of the plant based upon regulatory regions in the vicinity of the T- DNA insertion. This enhancer-trapping methodology is shown in Figure B.10. Look for a plant that displays GUS expression in the tissues in which you wanted to induce the ethylene response gene. You would then take the regulatory region near the T-DNA insertion, fuse it with the ethylene response gene, and transform the construct back into Arabidopsis.


60 Hartwell, Genetics: From Genes to Genomes. Second Canadian Edition Prepared by Bassam Nyaeme, University of The Fraser Valley, British Columbia Institute of Technology 2017 McGraw-Hill Education Limited


61 PART I Heredity: How Biological Information Is Transmitted From Generation to Generation CHAPTER Mendelian Genetics 2017 McGraw-Hill Education Limited 2
62 1. Explain how monohybrid crosses led Mendel to infer the law of segregation. 2. Distinguish between the terms gene and allele and contrast dominant alleles with recessive alleles. 3. Explain Mendel s law of segregation. 4. Differentiate between the terms homozygous, heterozygous, genotype, and phenotype. 5. Analyze Mendel s law of independent assortment, and explain how Mendel proposed the law from dihybrid crosses McGraw-Hill Education Limited 3
63 6. Compare and contrast complete dominance, incomplete dominance, and codominance relationships, and demonstrate how a dominance series can be established. 7. Explain the terms wild-type allele, mutant allele, monomorphic, and polymorphic. 8. Describe pleiotropy and how it arises. 9. Compare and contrast complementary gene action, recessive epistasis, dominant epistasis, and redundancy. 10. Evaluate the significance of the complementation test as a tool for genetic analysis. 11. Distinguish between penetrance and expressivity. 12. Explain the inheritance of continuous traits McGraw-Hill Education Limited 4
64 2.1 Background: The Historical Puzzle of Inheritance 2.2 Genetic Analysis According to Mendel 2.3 Mendelian Inheritance in Humans 2.4 Extensions to Mendel for Single-Gene Inheritance 2.5 Extensions to Mendel for Gene Interactions 2017 McGraw-Hill Education Limited 5

65 A family portrait with members of four generations Why do some of the children look like only one of the parents, while some of the other children don t look like any of the assembled relatives and instead look more like the great, great grandparents? What causes the similarities and differences of appearance and the skipping of generations? Fig McGraw-Hill Education Limited 6

66 Gregor Mendel discovered the basic principles of genetics Mendel was the first scientist to combine data collection, analysis, and theory to understand heredity. He inferred genetic laws about the appearance and disappearance of traits during different generations. Fig McGraw-Hill Education Limited 7
67 Genetics explains the mechanisms that determine the inheritance of traits Genes are the basic units of heredity Heredity is the way that genes transmit traits from parents to offspring Genes are passed from one generation to the next Genes underlie the formation of every heritable trait, e.g., cleft chin, hair loss, colour of hair, skin, and eyes Some traits are causes by a single change in a single gene, e.g., sickle-cell anaemia Some traits are caused by complex interactions between many genes, e.g., facial features 2017 McGraw-Hill Education Limited 8
68 Four general themes of Mendel's work 1. Variation is widespread in nature and provides for continuously evolving diversity. 2. Observable variation is essential for following genes from one generation to another. 3. Variation is inherited by genetic laws, which can explain why like begets like and unlike. 4. Mendel's laws apply to all sexually reproducing organisms McGraw-Hill Education Limited 9

69 Genetic variation exists even within dog breeds Mendel's laws explain why two black Labradors could have a litter of black, brown, and golden puppies Fig McGraw-Hill Education Limited 10
70 Background: The Historical Puzzle of Inheritance Artificial selection was the first applied genetic technique. Purposeful control of mating by choice of parents for the next generation. Domestication of plants and animals was a key transition in human civilization. Domestication of dogs (Canis lupus familiaris) from wolves (Canis lupus). Domestication of rice, wheat, barley, lentils, and dates from weed like plants McGraw-Hill Education Limited 11
71 Critical questions about selective breeding before Mendel's studies Concluding remarks by Abbot Cyril Napp at the 1837 annual meeting of the Moravian Sheep Breeders Society: Three basic questions must be answered What is inherited? How is it inherited? What is the role of chance in heredity? Abbot Napp presided over the monastery where Mendel began his seminal genetic experiments in McGraw-Hill Education Limited 12
72 Two key misconceptions about inheritance existed at the time of Mendel's studies Before Mendel, several misconceptions clouded people s thinking about heredity: Inherited features of offspring are contributed mainly by only one parent (e.g., a "homunculus" inside the sperm) Parental traits become mixed and changed in the offspring (i.e., "blended inheritance") Neither idea could explain why some traits would appear, disappear, and then reappear McGraw-Hill Education Limited 13


73 Mendel studied the inheritance of alternative traits in pea plants Mendel inferred laws of genetics that allowed predictions about which traits would appear, disappear, and then reappear. This work was done in his garden at a monastery Mendel's paper "Experiments in plant hybrids" was published in 1866 and became the cornerstone of modern genetics. Fig. 2.4a 2017 McGraw-Hill Education Limited 14
74 Keys to the success of Mendel s experiments Pure-breeding lines of peas (Pisum sativum) Breeding could be done by cross-fertilization or selfing Large numbers of progeny produced within a short time Traits remained constant in crosses within a line Inheritance of alternative forms of traits Antagonistic pairs of "either-or" traits: e.g., purple or white, yellow or green Brilliant experimentalist Planned experiments carefully Controlled the plant breeding Analyzed results mathematically 2017 McGraw-Hill Education Limited 15
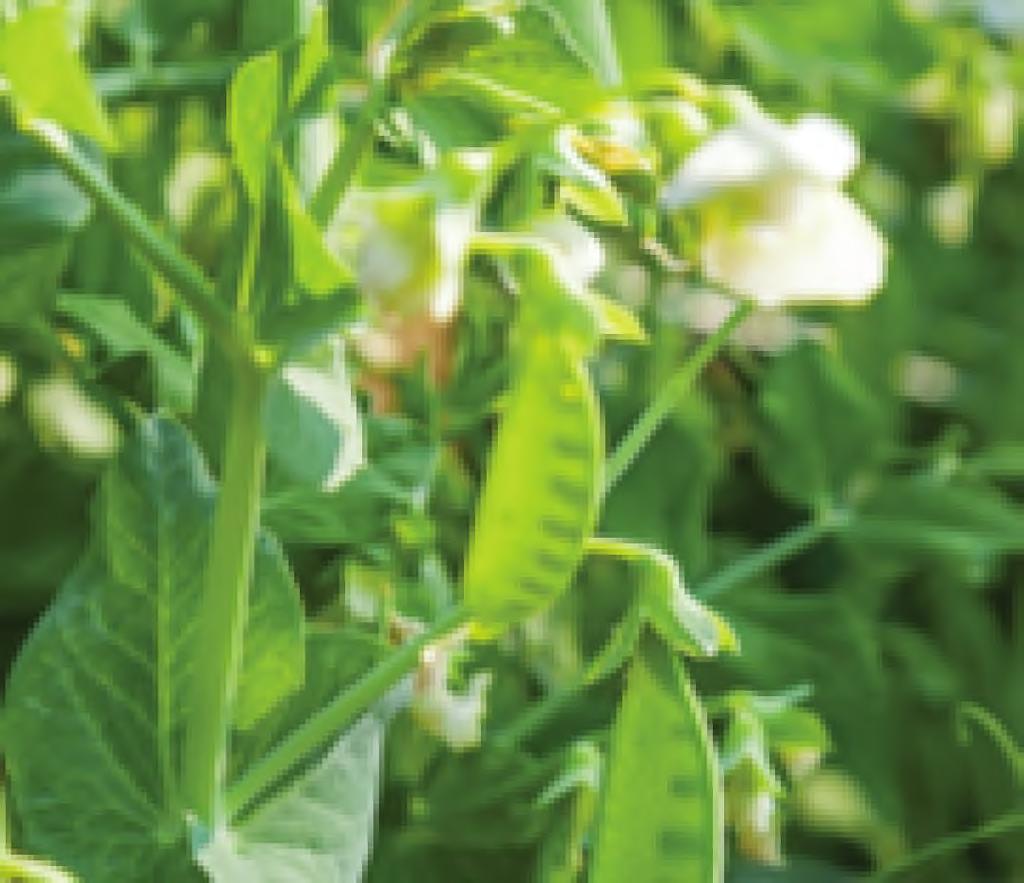


75 Mendel's experimental organism: The garden pea Fig McGraw-Hill Education Limited 16
76 Mendel studied seven antagonistic pairs of traits in peas Three antagonistic pairs of traits are shown at right. Note that each hybrid resembles only one of the parents: the dominant trait. Fig McGraw-Hill Education Limited 17

77 Monohybrid crosses revealed units of inheritance and the law of segregation Mendel crossed purebreeding lines that differed in only one trait, e.g., seed colour. Examined phenotypes of F 1 progeny and F 2 progeny F 1 progeny have only one of the parental traits Both parental traits reappear in F 2 progeny in a 3:1 ratio These results disproved the blending hypothesis Fig McGraw-Hill Education Limited 18
78 Mendel proposed that each plant carries two copies of a unit of inheritance Traits have two forms that can each breed true Trait that appears in F 1 progeny is the dominant form Trait that is hidden in the F 1 progeny is the recessive form Progeny inherit one unit from the maternal parent and the other unit from the paternal parent Units of inheritance are now known as "genes" Alternative forms of a single gene are "alleles" Individuals with two different alleles for a single trait are "monohybrids" 2017 McGraw-Hill Education Limited 19
79 Mendel's law of segregation The two alleles for each trait separate during gamete formation Two gametes, one from each parent, unite at random at fertilization Insert Figure 2.9b (needs updating because of Canadian spelling) Fig. 2.9a Fig. 2.9b 2017 McGraw-Hill Education Limited 20
80 Fast Forward Genes Encode Proteins Genes encode the proteins that cells produce and depend on for structure and function. CFTR In 1989, scientists from the Hospital for Sick Children in Toronto and the University of Michigan found that the normal allele of the cystic fibrosis gene encodes a chloride channel, called the cystic fibrosis transmembrane conductance regulator (CFTR). They discovered how a mutant allele causes unusually sticky mucus. Fig. B 2017 McGraw-Hill Education Limited 21

81 The Punnett square is a simple way to visualize the segregation and random union of alleles Each F 1 hybrid produces two kinds of gametes in a 1:1 ratio F 2 progeny 3:1 ratio of phenotypes 1/4 will breed true for the dominant trait 1/2 will be hybrids 1/4 will breed true for the recessive trait Fig McGraw-Hill Education Limited 22
82 Mendel's results and the Punnett square reflect the basic rules of probability Product rule: probability of two independent events occurring together is the product of their individual probabilities What is the probability that event 1 AND event 2 will occur? P(1 and 2) = probability of event 1 X probability of event 2 Sum rule: probability of either of two mutually exclusive events occurring is the sum of their individual probabilities What is the probability that event 1 OR event 2 will occur? P(1 or 2) = probability of event 1 + probability of event McGraw-Hill Education Limited 23
83 Applying probability to Mendel's crosses From a cross of Yy x Yy peas What is the chance of getting YY offspring? Chance of Y pollen is 1/2 Chance of Y ovule is 1/2 Chance of Y pollen and Y ovule uniting is 1/2 x 1/2 = 1/4 What is the chance of getting Yy offspring? Chance of Y pollen uniting with y ovule is 1/2 x 1/2 = 1/4 Chance of y pollen uniting with Y ovule is 1/2 x 1/2 = 1/4 Chance of either event happening is 1/4 + 1/4 = 1/ McGraw-Hill Education Limited 24
84 Mendel did further crosses to verify the law of segregation F 2 plants were selfed to produce F 3 progeny All of the green F 2 peas were pure breeding 1/3 of the yellow F 2 peas were pure breeding 2/3 of the yellow F 2 peas were hybrids Fig McGraw-Hill Education Limited 25
85 Definitions of commonly used terms Phenotype is an observable characteristic (e.g., yellow or green pea seeds) Genotype is a pair of alleles in an individual (e.g., YY or Yy) Homozygote has two identical alleles (e.g., YY or yy) Heterozygote has two different alleles (e.g., Yy) The heterozygous phenotype defines the dominant allele (e.g., Yy peas are yellow, so the yellow Y allele is dominant to the green y allele) A dominant allele with a dash represents an unknown genotype (e.g., Y stands for either YY or Yy) 2017 McGraw-Hill Education Limited 26
86 Genotype vs phenotype in homozygotes and heterozygotes From a cross of Yy x Yy peas Genotypes in F 2 progeny are in 1:2:1 ratio (1/4 YY, 1/2 Yy, 1/4 yy) Insert Figure 2.12 (needs updating because of Canadian spelling) Phenotypes in F 2 progeny are in 3:1 ratio (3/4 yellow, 1/4 green) Fig McGraw-Hill Education Limited 27
87 A testcross can reveal an unknown genotype Is the genotype of an individual with a dominant phenotype (e.g., Y ) heterozygous (Yy) or homozygous (YY)? Solution: Testcross to homozygous recessive (yy) and examine progeny Fig McGraw-Hill Education Limited 28
88 Mendel's dihybrid crosses revealed the law of independent assortment Mendel tested whether two genes in dihybrids would segregate independently First, he crossed true-breeding yellow round peas with truebreeding green wrinkled peas to obtain dihybrid F 1 plants: YY RR x yy rr F 1 Yy Rr Then, the dihybrid F 1 plants were selfed to obtain F 2 plants: F 1 Yy Rr x F 1 Yy Rr F 2 Mendel asked whether all the F 2 progeny would be parental types (yellow round and green wrinkled) or would some be recombinant types (yellow wrinkled and green round)? 2017 McGraw-Hill Education Limited 29

89 A dihybrid cross produces parental types and recombinant types Each F 1 dihybrid produces four possible gametes in a 1:1:1:1 ratio Yy Rr 1/4 Y R, 1/4 Y r, 1/4 y R, 1/4 y r Four phenotypic classes occurred in the F 2 progeny: Two are like parents Two are recombinant Fig McGraw-Hill Education Limited 30
90 Independent assortment in crosses of F 1 dihybrids produces a 9:3:3:1 phenotype ratio Note that in these F 2 progeny, there is a 3:1 phenotype ratio of dominant to recessive forms Fig McGraw-Hill Education Limited 31
91 Mendel's law of independent assortment During gamete formation, different pairs of alleles segregate independently of each other Y is just as likely to assort with R as it is with r y is just as likely to assort with R as it is with r Fig McGraw-Hill Education Limited 32

92 Following crosses with branched-line diagrams Progeny phenotypes for each gene are shown in different columns Fig McGraw-Hill Education Limited 33
93 Testcrosses on dihybrids Testcross dihybrids to individuals that are homozygous for both recessive traits Fig McGraw-Hill Education Limited 34
94 Mendel's laws can be used to predict offspring from complicated crosses To calculate the possible number of gamete genotypes from a hybrid, raise 2 to the power of the number of different traits Aa Bb Cc Dd 2 4 = 16 kinds of gametes Aa Bb Cc Dd x Aa Bb Cc Dd 16 x 16 = 256 genotypes To do a Punnett square with this cross involving four genes, you would need 16 columns and 16 rows An easier way is to break down a multihybrid cross into independently assorting monohybrid crosses 2017 McGraw-Hill Education Limited 35
95 Predicting proportions of progeny from multihybrid crosses example 1 Cross Aa Bb Cc Dd x Aa Bb Cc Dd What proportion of progeny will be AA bb Cc Dd? Aa x Aa 1/4 AA Bb x Bb 1/4 bb Cc x Cc 1/2 Cc Dd x Dd 1/2 Dd So, the expected proportion of AA bb Cc DD progeny is: 1/4 x 1/4 x 1/2 x 1/2 = 1/ McGraw-Hill Education Limited 36
96 Predicting proportions of progeny from multihybrid crosses example 2 Cross Aa Bb Cc Dd x Aa Bb Cc Dd How many progeny will show the dominant traits for A, C, and D and the recessive trait for B? Aa x Aa 3/4 A Bb x Bb 1/4 bb Cc x Cc 3/4 C Dd x Dd 3/4 D So, expected proportion of A bb C D progeny is: 3/4 x 1/4 x 3/4 x 3/4 = 27/ McGraw-Hill Education Limited 37


97 The science of genetics began with the rediscovery of Mendel's work Mendel published his monumental breakthrough in understanding heredity in 1866, but hardly anyone paid attention to his work! In 1900, three scientists independently rediscovered and acknowledged Mendel's work. Fig McGraw-Hill Education Limited 38
98 Mendelian inheritance in humans Many heritable traits in humans are caused by interaction of multiple genes and thus don't show simple Mendelian inheritance patterns. In 2013, there were ~ 10,000 single-gene traits known in humans. See Table 2.1 for some of the common single-gene traits Even with single-gene traits, determining inheritance pattern in humans can be tricky. Long generation time Small numbers of progeny No controlled matings No pure-breeding lines 2017 McGraw-Hill Education Limited 39
99 Some of the most common single-gene traits caused by recessive alleles in humans Disease Effect Incidence of Disease Thalassemia (chromosome 16 or 11) Sickle-cell anaemia (chromosome 11) Cystic fibrosis (chromosome 7) Tay-Sachs disease (chromosome 15) Phenylketonuria (PKU) (chromosome 12) Reduced amounts of haemoglobin; anaemia, bone, and spleen enlargement Abnormal haemoglobin; sickleshaped red cells, anaemia, blocked circulation; increased resistance to malaria Defective cell membrane protein; excessive mucus production; digestive and respiratory failure Missing enzyme; buildup of fatty deposit in brain; buildup disrupts mental development Missing enzyme; mental deficiency 1/10 in parts of Italy 1/625 African- Americans 1/2000 Caucasians 1/3000 Eastern European Jews 1/10,000 Caucasians Table McGraw-Hill Education Limited 40
100 Some of the most common single-gene traits caused by dominant alleles in humans Disease Effect Incidence of Disease Hypercholesterolemia (chromosome 19) Huntington disease (chromosome 4) Missing protein that removes cholesterol from the blood; heart attack by age 50 Progressive mental and neurological damage; neurologic disorders by ages /122 French Canadians 1/25,000 Caucasians Table McGraw-Hill Education Limited 41
101 In humans, pedigrees can be used to study inheritance Pedigrees are orderly diagrams of a family's relevant genetic features. Pedigrees include as many generations as possible (ideally, at least both sets of grandparents of an affected person). Pedigrees can be analyzed using Mendel's laws: Is a trait determined by alternate alleles of a single gene? Is a trait dominant or recessive? 2017 McGraw-Hill Education Limited 42
102 Symbols used in pedigree analysis Fig McGraw-Hill Education Limited 43
103 A vertical pattern of inheritance indicates a rare dominant trait; e.g., Huntington disease Every affected person has at least one affected parent Mating between affected person and unaffected person is effectively a testcross Fig McGraw-Hill Education Limited 44
104 A horizontal pattern of inheritance indicates a rare recessive trait; e.g., cystic fibrosis Parents of affected individuals are unaffected but are heterozygous (carriers) for the recessive allele Fig McGraw-Hill Education Limited 45
105 How to recognize dominant traits in pedigrees Three key aspects of pedigrees with dominant traits: 1.Affected children always have at least one affected parent. 2.As a result, dominant traits show a vertical pattern of inheritance. 3.Two affected parents can produce unaffected children, if both parents are heterozygotes. Table McGraw-Hill Education Limited 46
106 How to recognize recessive traits in pedigrees Four keys aspects of pedigrees with recessive traits: 1. Affected individuals can be the children of two unaffected carriers, particularly as a result of consanguineous matings. 2. All the children of two affected parents should be affected. 3. Rare recessive traits show a horizontal pattern of inheritance. 4. Recessive traits may show a vertical pattern of inheritance if the trait is extremely common in the population. Table McGraw-Hill Education Limited 47

107 Some phenotypic variation poses a challenge to Mendelian analysis Crosses of pure-breeding lines can result in progeny phenotypes that don't appear to follow Mendel's rules Example: Lentils show complex speckling patterns that are controlled by a gene that has more than two alleles. Explanations for some traits: No definitively dominant or recessive allele More than two alleles exist Multiple genes are involved Gene-environment interactions 2017 McGraw-Hill Education Limited Fig
108 Extensions to Mendel for single-gene inheritance Dominance is not always complete Incomplete dominance e.g., snapdragon flower colour Codominance e.g., lentil coat patterns, AB blood group in humans A gene may have >2 alleles e.g., lentil coat patterns, ABO blood groups in humans, histocompatibility in humans Pleiotropy - one gene may contribute to several characteristics Recessive lethal alleles e.g., A Y allele in mice Delayed lethality McGraw-Hill Education Limited

109 Summary of different dominance relationships The phenotype of the heterozygote defines the dominance relationship of two alleles. Complete dominance: Hybrid resembles one of the two parents Incomplete dominance: Hybrid resembles neither parent Codominance: Hybrid shows traits from both parents Figure McGraw-Hill Education Limited 50
110 Flower colour in snapdragons is an example of incomplete dominance Crosses of pure-breeding red with pure-breeding white results in all pink F 1 progeny Figure 2.24a 2017 McGraw-Hill Education Limited 51
111 Pink flowers in snapdragons are the result of incomplete dominance F 2 progeny ratios: 1 red (R 1 R 1 ) 2 pink (R 1 R 2 ) 1 white (R 2 R 2 ) Insert Figure 2.24b (Reason: labels are changing from A to R 1 and a to R 2 ) Phenotype ratios reflect the genotype ratios Figure 2.24b 2017 McGraw-Hill Education Limited 52
 x dotted (C D C D ) All F 1 progeny are spotted and dotted (C S C D ) F 2 progeny ratios: 1 spotted (C S C S ) 2 spotted and dotted (C S C D )")
112 In codominance, the F 1 hybrids display traits of both parents: e.g., lentil coat patterns Spotted (C S C S ) x dotted (C D C D ) All F 1 progeny are spotted and dotted (C S C D ) F 2 progeny ratios: 1 spotted (C S C S ) 2 spotted and dotted (C S C D ) 1 dotted (C D C D ) Phenotype ratios reflect the genotype ratios. Figure 2.25a 2017 McGraw-Hill Education Limited 53

113 In codominance, the F 1 hybrids display traits of both parents: e.g., AB blood group Gene I controls the type of sugar polymer on the surface of RBCs Two alleles, I A and I B, result in different sugars I A I A individuals have A sugar I B I B individuals have B sugar I A I B individuals have both A and B sugars 2017 McGraw-Hill Education Limited Figure 2.25b 54
114 Dominance relations between alleles do not affect transmission of alleles Type of dominance (complete, incomplete dominance, codominance) depends on the type of proteins encoded and by the biochemical functions of the proteins. Variation in dominance relations do not negate Mendel's laws of segregation. Alleles still segregate randomly. Interpretation of phenotype/genotype relations is more complex McGraw-Hill Education Limited 55
115 A gene may have more than two alleles Multiple alleles of a gene can segregate in populations. Each individual can carry only two alleles. Dominance relations are always relative to a second allele and are unique to a pair of alleles McGraw-Hill Education Limited 56
116 ABO blood types in humans are determined by three alleles of one gene I A allele A type sugar I B allele B type sugar i allele no sugar Six genotypes produce four blood types Dominance relations are relative to a second allele I A and I B are codominant I A and I B are dominant to i 2017 McGraw-Hill Education Limited Fig. 2.26a 57
117 Medical and legal implications of ABO blood group genetics Antibodies are made against type A and type B sugars Successful blood transfusions occur only with matching blood types. Type AB are universal recipients, type O are universal donors Figure 2.26b,c 2017 McGraw-Hill Education Limited 58
 Reciprocal crosses between pairs of pure-breeding lines is used to determine dominance relations. Fig. 2.")
118 Seed coat patterns in lentils are determined by a gene with five alleles Five alleles for C gene: spotted (C S ), dotted (C D ), clear (C C ), marbled-1 (C M1 ), and marbled-2 (C M2 ) Reciprocal crosses between pairs of pure-breeding lines is used to determine dominance relations. Fig McGraw-Hill Education Limited 59
119 Dominance relations are established between pairs of alleles Three examples: 1. marbled-1 (C M1 C M1 ) x clear (C C C C ) all F 1 marbled-1 (C M1 C C ) F 2 progeny: 798 marbled-1 (C M1 ) and 296 clear (C C C C ) 2. marbled-2 (C M2 C M2 ) x clear (C C C C ) all F 1 marbled-2 (C M2 C C ) F 2 progeny: 123 marbled-1 (C M2 ) and 46 clear (C C C C ) 3. marbled-1 (C M1 C M1 ) x marbled-2 (C M2 C M2 ) all F 1 marbled-1 F 2 progeny: 272 marbled-1 (C M1 ) and 72 marbled-2 (C M2 C M2 ) A 3:1 ratio in each cross indicates that different alleles of the same gene are involved. Dominance series: C M1 > C M2 > C C McGraw-Hill Education Limited
120 Mutations are the source of new alleles Chance alterations of genetic material arise spontaneously. If mutations occur in gamete-producing cells, they can be transmitted to offspring. The frequency of gametes with mutations is Mutations that result in phenotypic variants can be used by geneticists to follow gene transmission McGraw-Hill Education Limited 61
121 Nomenclature for alleles in populations Allele frequency is the percentage of the total number of gene copies for one allele in a population. The most common allele is usually the wild-type (+) allele. A rare allele is considered to be a mutant allele. Gene w/ only one common wild-type allele is monomorphic Agouti gene in mice only one allele in wild populations, many alleles in lab mice. Gene w/ more than one common allele is polymorphic High-frequency alleles of polymorphic genes are referred to as common variants McGraw-Hill Education Limited 62

122 The mouse agouti gene controls hair colour: One wild-type allele, many mutant alleles Wild-type agouti allele (A) produces yellow and black pigment in hair 14 different agouti alleles in lab mice, but only A allele in wild mice e.g., mutant alleles a and a t a recessive to A aa has black only a t dominant to a but recessive to A a t a t mouse has black on back and yellow on belly 2017 McGraw-Hill Education Limited Fig. 2.28c 63
123 One gene may contribute to several characteristics Pleiotropy is the phenomenon of a single gene determining several distinct and seemingly unrelated characteristics. e.g., Many aboriginal Maori men have respiratory problems and are sterile. Defects due to mutations in a gene required for functions of cilia (failure to clear lungs) and flagella (immotile sperm) With some pleiotropic genes: Heterozygotes can have a visible phenotype. Homozygotes can be inviable (e.g., A Y allele of agouti gene in mice) McGraw-Hill Education Limited 64

124 The A Y allele produces a dominant coat colour phenotype in mice A Y allele of agouti gene causes yellow hairs with no black Cross agouti x yellow mice Progeny in 1:1 ratio of agouti to yellow Yellow mice must be heterozygous for A and A Y Fig. 2.29a A Y is dominant to A 2017 McGraw-Hill Education Limited 65
 mice cannot be obtained because")
125 The A Y allele is a recessive lethal allele A Y is dominant to A for hair colour, but is recessive to A for lethality. Cross yellow x yellow mice F 1 mice are 2/3 yellow and 1/3 agouti 2:1 ratio is indicative of a recessive lethal allele Pure-breeding yellow (A Y A Y ) mice cannot be obtained because they are not viable. Figure 2.29b 2017 McGraw-Hill Education Limited 66

126 Extensions to Mendel's analysis explain alterations of the 3:1 monohybrid ratio Table McGraw-Hill Education Limited 67
127 A comprehensive example: Sickle-cell disease Haemoglobin transports oxygen in RBCs Two subunits alpha (α) globin and beta (β) globin Mutations in the β-globin gene cause β-thalassemia. Most common mutation of β-globin (Hbβ S ) causes sicklecell disease. Pleiotropic affects >1 trait (deformed RBCs, anaemia, heart failure, resistance to malaria) Recessive lethality heart failure Different dominance relations for different phenotypic aspects of sickle-cell disease McGraw-Hill Education Limited 68
128 Pleiotropy of sickle-cell anaemia: Dominance relations vary with the phenotype under consideration Fig. 2.30a 2017 McGraw-Hill Education Limited 69
129 Pleiotropy of sickle-cell anaemia: Dominance relations vary with the phenotype under consideration Fig. 2.30b 2017 McGraw-Hill Education Limited 70
130 Extensions to Mendel for Gene Interaction Two genes can interact to determine one trait. Novel phenotypes can result from gene interactions, e.g., seed coat in lentils Complementary gene action, e.g., flower colour Epistasis, e.g., dog fur, Bombay phenotype in humans, squash colour, chicken feather colour In all of these cases, F 2 phenotypes from dihybrid crosses are in a variation of the 9:3:3:1 ratio expected for independently assorting genes McGraw-Hill Education Limited 71

131 Novel phenotypes resulting from gene interactions, e.g., seed coat in lentils Dihybrid cross of lentils, tan x grey All F 1 seeds are brown F 2 progeny: 9/16 brown 3/16 tan 3/16 grey 1/16 green 9:3:3:1 ratio in F 2 suggests two independently assorting genes for seed coat colour Fig. 2.31a 2017 McGraw-Hill Education Limited 72
132 Results of self-crosses of F 2 lentils supports the two-gene hypothesis Figure 2.31b 2017 McGraw-Hill Education Limited 73
133 Sorting out the dominance relations by select crosses of lentils F 2 phenotypes from dihybrid crosses will be in 9:3:3:1 ratio only when dominance of alleles at both genes is complete Figure 2.31c 2017 McGraw-Hill Education Limited 74
134 A biochemical model for the inheritance of lentil seed coat colours The seed has an opaque outer layer (the seed coat) and an inner layer (the cotyledon). The green chlorophyll in the cotyledon is not visible if the seed coat is coloured. Allele A encodes enzyme A. Allele a does not produce this enzyme. Allele B of a second gene encodes a different enzyme; b produces none of this enzyme. Seeds appear brown if the tan and grey pigments are both present McGraw-Hill Education Limited 75
135 The 9:3:3:1 ratio implies that the A and B genes operate in independent biochemical pathways. In the absence of both enzymes (aa bb), the seed coat is unpigmented, so the green chlorophyll in the cotyledon will show through. The 9:3:3:1 ratio implies that the A and B genes operate in independent biochemical pathways. Figure McGraw-Hill Education Limited 76


136 Complementary gene action in sweet peas Purple F 1 progeny of sweet peas are produced by crossing two purebreeding white lines. Figure 2.33 a 2017 McGraw-Hill Education Limited 77
 7/16 white (A bb, aa B, aa bb) Figure 2.33b 2017 McGraw-Hill Education Limited 78")
137 Complementary gene action generates purple flower colour in sweet peas Dihybrid cross generates 9:7 ratio in F 2 progeny 9/16 purple (A B ) 7/16 white (A bb, aa B, aa bb) Figure 2.33b 2017 McGraw-Hill Education Limited 78
138 Possible biochemical explanation for complementary gene action for flower colour in sweet peas One pathway has two reactions catalyzed by different enzymes At least one dominant allele of both genes is required for purple pigment Homozygous recessive for either or both genes results in no pigment 2017 McGraw-Hill Education Limited Figure
139 Epistasis results from the effects of an allele at one gene masking the effects of another gene The gene that does the masking is epistatic to the other gene. The gene that is masked is hypostatic to the other gene. Epistasis can be recessive or dominant Recessive epistatic gene must be homozygous recessive (e.g., ee) Dominant epistatic gene must have at least one dominant allele present (e.g., E ) 2017 McGraw-Hill Education Limited 80


 4/16")


140 Recessive epistasis in Golden Labrador dogs 9:3:4 ratio in F 2 progeny of dihybrid crosses indicates recessive epistasis 9/16 black (B E ) 3/16 brown (bb E ) 4/16 yellow (B ee, bb ee) Genotype ee masks the effect of all B genotypes Figure McGraw-Hill Education Limited 81
141 A developmental explanation for coat colour in Labrador retrievers. Protein B activates an enzyme that generates eumelanin from a colourless precursor. When protein B is present, only black eumelanin is produced so that the hair is black. Protein b produces less dense brown eumelanin, resulting in brown (chocolate) hair. In the absence of protein E, no eumelanin is deposited in the hair shaft, and instead, pheomelanin (yellow pigment) is synthesized and deposited McGraw-Hill Education Limited 82
142 Homozygous ee dogs are always yellow regardless of the gene B genotype Figure McGraw-Hill Education Limited 83

143 Recessive epistasis in humans with a rare blood type Gene for substance H is epistatic to the ABO gene Without the H substance, there is nothing for the A or B sugar to attach to All type A, type AB, type B, and type O people are H People with hh genotype will appear to be type O Figure McGraw-Hill Education Limited 84
 1/16 green (aa bb) The dominant allele of one gene masks both alleles of another gene. Figure 2.")
144 Dominant epistasis I in summer squash 12:3:1 ratio in F 2 progeny of dihybrid crosses indicates dominant epistasis I 12/16 white (A B, aa B ) 3/16 yellow (A bb) 1/16 green (aa bb) The dominant allele of one gene masks both alleles of another gene. Figure McGraw-Hill Education Limited 85
 The dominant allele of one gene masks the dominant allele of another gene. Figure 2.")
145 Dominant epistasis II in chickens 13:3 ratio in F 2 progeny of dihybrid crosses indicates dominant epistasis II 13/16 white (A B, aa B, aa bb) 3/16 coloured (A bb) The dominant allele of one gene masks the dominant allele of another gene. Figure McGraw-Hill Education Limited 86

146 Summary of gene interactions discussed in this chapter Observing the F 2 ratios below is diagnostic of the type of gene interaction. These F 2 ratios occur only in dihybrid crosses where there is complete dominance McGraw-Hill Education Limited 87
147 Heterogeneous traits and the complementation test Heterogeneous traits have the same phenotype but are caused by mutations in different genes. e.g., deafness in humans can be caused by mutations in ~ 50 different genes Complementation testing is used to determine if a particular phenotype arises from mutations in the same or separate genes. Can be applied only with recessive, not dominant, phenotypes 2017 McGraw-Hill Education Limited 88
148 Genetic heterogeneity in humans: Mutations in many genes can cause deafness Fig McGraw-Hill Education Limited 89
149 Variations on the theme of gene interactions and genetic heterogeneity 1.Genes can interact to generate novel phenotypes. 2.The dominant alleles of two interacting genes can both be necessary for the production of a particular phenotype. 3.One gene s alleles can mask the effects of alleles at another gene. 4.Different genes may have redundant functions so that a dominant allele of either gene is sufficient for the production of a particular wild-type phenotype. 5.Mutant alleles at one of two or more different genes can result in the same phenotype McGraw-Hill Education Limited 90
 F 2 For each gene, two alleles generate three phenotypes F 2 progeny have 3 2 phenotypes Fig. 2.43 2017 McGraw-Hill Education Limited 91")
150 Interaction of two incompletely dominant genes can produce nine phenotypes Example, two genes A and B: Allele A is incompletely dominant to allele a Allele B is incompletely dominant to allele b F 1 (all identical) F 2 For each gene, two alleles generate three phenotypes F 2 progeny have 3 2 phenotypes Fig McGraw-Hill Education Limited 91
151 Breeding studies help determine inheritance of a trait How do we know if a trait is caused by one gene or by two genes that interact? Example: dihybrid cross of pure-breeding parents produces three phenotypes in F 2 progeny If single gene with incomplete dominance, then F 2 progeny should be in 1:2:1 ratio If two independently assorting genes and recessive epistasis, then F 2 progeny should be in 9:3:4 ratio Further breeding studies can reveal which hypothesis is correct 2017 McGraw-Hill Education Limited 92
152 Two hypotheses to explain phenotypes in F2 progeny of mice with different coat colours Fig (top) Are these F 2 progeny in a ratio of 9:3:4 or 1:2:1? 2017 McGraw-Hill Education Limited 93
153 Specific breeding tests can help decide between two hypotheses Hypothesis 1 two genes with recessive epistasis Hypothesis 2 one gene with incomplete dominance Figure 2.44 (bottom) 2017 McGraw-Hill Education Limited 94

154 Family pedigrees help unravel the genetic basis of ocular-cutaneous albinism (OCA) OCA is another example of heterogeneity Fig a,b,c 2017 McGraw-Hill Education Limited 95
155 The same genotype does not always produce the same phenotype In all of the traits discussed so far, the relationship between a specific genotype and its corresponding phenotype has been absolute. Phenotypic variation for some traits can occur because of: Differences in penetrance and/or expressivity Effects of modifier genes Effects of environment Pure chance 2017 McGraw-Hill Education Limited 96
156 Phenotype often depends on penetrance and/or expressivity Penetrance is the percentage of a population with a particular genotype that shows the expected phenotype. Can be complete (100%) or incomplete (e.g., penetrance of retinoblastoma is 75%) Expressivity is the degree or intensity with which a particular genotype is expressed in a phenotype. Can be variable or unvarying 2017 McGraw-Hill Education Limited 97
157 Some traits result from different genes that do not contribute equally to the phenotype Modifier genes alter the phenotypes produced by alleles of other genes. Can have major effect or more subtle effects Example: T locus of mice Mutant T allele causes abnormally short tail In some inbred strains, mice with T allele have tails that are 75% the length of normal tails In other inbred strains, mice with the same T mutation have tails that are 10% the length of normal tails Different inbred strains must carry alternative alleles of a modifier gene for the T mutant phenotype 2017 McGraw-Hill Education Limited 98
158 Environmental effects on phenotype Temperature is a common element of the environment that can affect phenotype Example 1: Coat colour in Siamese cats Extremities are darker than body because of a temperature sensitive allele Example 2: Survivability of a Drosophila mutant Shibire mutants develop normally at < 29 o C but are inviable at temperatures > 29 o C Conditional lethal mutations are lethal only under some conditions Permissive conditions - mutant allele has wild-type functions Restrictive conditions - mutant allele has defective functions 2017 McGraw-Hill Education Limited 99


159 A temperature sensitive mutation affects coat colour in Siamese cats Fig McGraw-Hill Education Limited 100


 lethality occurs,")
160 Tools of Genetics Temperature-Sensitive Mutations You may know Dr. David Suzuki for his work as an environmentalist, broadcaster, and a world leader in sustainable ecology He is also an award-winning scientist. While at UBC, he conducted large-scale genetic screens in Drosophila, with his main focus being the study of temperature-sensitive (ts) mutations. These ts mutants are useful as tools for investigations into the nature of genetic lesions. By manipulating the conditional and restrictive conditions, one could determine at what developmental stage(s) lethality occurs, as well as any phenotypically distinct (or pleiotropic) defects that may arise upon brief exposure to the restrictive temperature at various stages of development McGraw-Hill Education Limited 101
161 Mendelian principles can also explain continuous variation Discontinuous traits give clear-cut, "either-or" phenotypic differences between alternative alleles Example: All of the traits Mendel studied in peas were discontinuous Continuous traits are determined by segregating alleles of many genes that interact together and with the environment Examples in humans: height, weight, skin colour Often appear to blend and "unblend" Also called quantitative traits because the traits vary over a range that can be measured Usually polygenic controlled by multiple genes 2017 McGraw-Hill Education Limited 102

162 Mendelian explanation of continuous variation The more genes or alleles, the more possible phenotypic classes and the greater the similarity to continuous variation. In these examples, all of the alleles are incompletely dominant and have additive effects. Fig (partial) 2017 McGraw-Hill Education Limited 103
 The more genes or alleles, the more possible phenotypic classes and the greater the similarity to continuous variation.")
163 Mendelian explanation of continuous variation (cont.) The more genes or alleles, the more possible phenotypic classes and the greater the similarity to continuous variation. In these examples, all of the alleles are incompletely dominant and have additive effects. Fig (partial) 2017 McGraw-Hill Education Limited 104