Nature Biotechnology: doi: /nbt Supplementary Figure 1
|
|
|
- Ralph Johnson
- 5 years ago
- Views:
Transcription

1 Supplementary Figure 1 Schematic and results of screening the combinatorial antibody library for Sox2 replacement activity. A single batch of MEFs were plated and transduced with doxycycline inducible lentiviruses and an rtta virus. Viral expression was induced for 14 days and images were collected. All MEFs were transduced with viruses encoding Oct4, Klf4 and a previously validated shrna against p53 (shp53). Additional conditions included the positive control (left panel, with viruses encoding Sox2 and c-myc), the test for the antibody library (middle panel, since we observed only a few colonies per plate, representative cut outs of colonies are shown) and a negative control with a lentivirus expressing tdtomato (red). Scale bars = 100 µm. Individual colonies arising in the screen were photographed at the same magnification as the other panels but cropped and enlarged variously for visual clarity.

2
3 Supplementary Figure 2 Validation of SoxAb- and OctAb-generated ipscs. Fig. S2 a and b) Antibody gene sequences were recovered by PCR performed on genomic DNA from ipsc lines. Primer binding sites are depicted in Fig. S1b as recovery primers. The amplicons were purified by gel extraction and sub-cloned into lentiviral or other expression vectors and submitted for sequencing. c) Primary colonies induced by Sox2 antibodies were capable of expanding into cell lines maintained under standard mouse ES conditions for at least ten passages. d) Primary colonies induced by Oct4 antibodies can be expanded into cell lines and maintained under standard mouse ES cell conditions for at least ten passages. e) ipsc lines generated with SoxAb2 do not harbor transgenic Sox2 or cmyc. f) ipsc lines generated with OctAb1 and 2 do not harbor transgenic Oct4, but do harbor transgenic human IgG. g) ipsc lines generated with SoxAb2 and OctAb1 express pluripotency markers SSEA1, Sox2, Oct3/4, and Nanog. Scale bars = 100 µm. h) ips cell lines generated with OctAb2 and SoxAb2 differentiate in vitro to the three embryonic germ layers. Scale bars = 100 µm. i) ipsc lines generated with SoxAb1 differentiate in vivo and contribute to chimeric offspring. Eightweek old chimeric mice formed by injection of KO + SoxAb1 cells (CD1 genetic background) into a C57BL6 blastocyst. j) Chimeric pups display contribution of antibody ipscs across three embryonic germ layers. k) Quantitative RT-PCR confirmation of the expression of pluripotency genes in the SoxAb1 and SoxAb2 ipsc lines, fully pluripotent ipscs (imz-9 and iimz-21) and mescs (V6.5) compared to control fibroblasts expressing OKM for twelve days under identical culture conditions used to derive the ipscs. Bars represent the mean of two biological replicates, meaning independent wells of the cell line indicated. Error bars = SEM. l) RNA-seq scatter plots show that global gene expression of antibody-derived ipsc lines is highly similar to TEC competent ipsc (imz21) and mesc (MCNT) lines but different from somatic MEFs. Gene expression is plotted as vsd-normalized counts. m) Summary of differential expression analysis (using DESeq2) showing the number of genes that are significantly upregulated (red) and downregulated (blue), that exhibit a greater than 2-fold change in expression in MEFs, and antibody-ipsc lines compared to TEC-competent ipscs and ESCs.

4
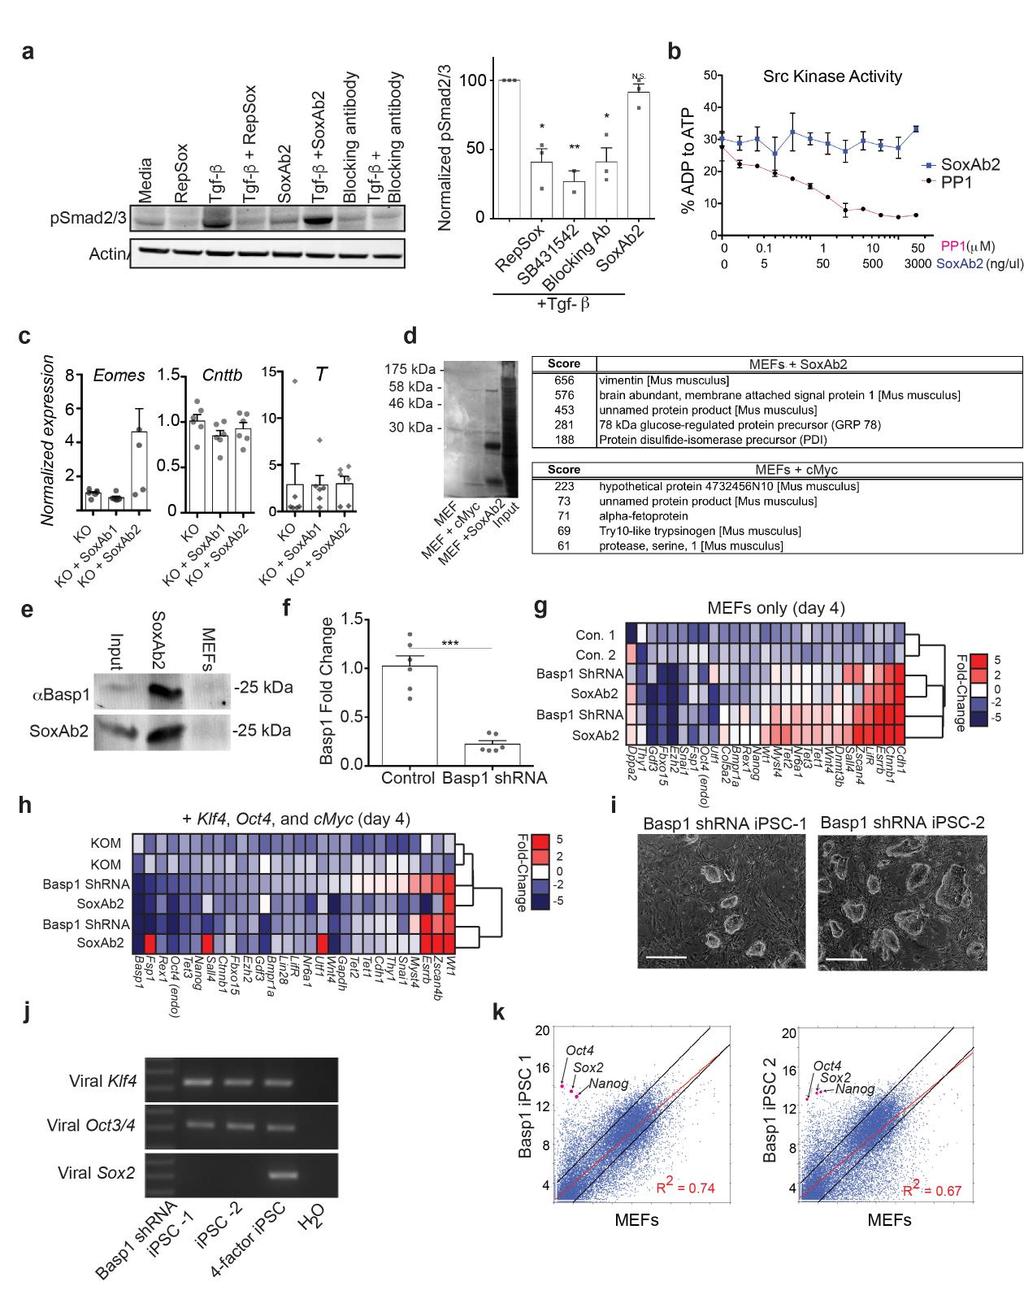
5 Supplementary Figure 3 Mechanisms governing reprogramming with SoxAb2 involve Basp1 inhibition. a) SoxAb2 does not inhibit Tgf- induced phosphorylation of Smad2/3 whereas small molecule inhibitors RepSox and Tgfneutralizing antibodies previously reported to promote Sox2-independent reprogramming do inhibit Tgf- induced phosphorylation of Smad2/3. For each treatment (SoxAb2, RepSox, SB431542, and Tgf- neutralizing antibodies) ability to inhibit Smad2/3 phosphorylation was quantified from three independent western blots. The graph depicts the mean from the three blots. Error bars represent SEM. Significance was determined by ANOVA followed by Newman-Keuls post-hoc analysis, *p<0.05, ** p<0.01. b) SoxAb2 does not directly inhibit Src-kinase activity. SoxAb2 ability to inhibit Src-kinase activity was compared to the small molecule PP1 a known Src-kinase inhibitor able to promote Sox2-independent reprogramming. c) SoxAb2 does not antagonize the induction of mesoderm genes. Mesoderm genes Eomes, T, and Ctnnb1 were quantified in three biological replicates of MEFs expressing Klf4 and Oct4 by RT-PCR following 96 hours expression of SoxAb2. Significance was assessed by ANOVA; no significant differences were observed. d) Proteins were immunoprecipitated with SoxAb2 separated by SDS-PAGE and stained with Coomassie brilliant blue. A ~25 KDa based was excised from control (middle) and SoxAb2-expressing (right) lanes and analyzed by trypsin digestion and mass spectrometry which identified candidate proteins enriched in each sample. e) SoxAb2 immunoprecipitates endogenous Basp1. MEFs were transduced with Basp1 (lanes 1,2) or not transduced (lane3). Lysates were immunoprecipitated with SoxAb2 (lanes 2 and 3) and Western blots were performed with either Anti-Basp1 (top) or the SoxAb2 (bottom). Basp1 protein was present and detected by both antibodies in the whole lysate from MEFs overexpressing Basp1 and enriched in pull-downs with the SoxAb2, demonstrating that the SoxAb2 recognized Basp1 protein. f) Quantitative RT-PCR confirming Basp1 shrna significantly reduces Basp1 expression in MEFs; p= , Students T-Test. g) The changes in gene expression in MEFs directed by SoxAb2 or knockdown of Basp1 are strongly correlated. Heat map and hierarchical clustering of control MEFs compared to MEFs expressing SoxAb2 or Basp1 shrna. Clustering represents single linkage Euclidian distance. h) Heat map and hierarchical clustering in MEFs expressing Klf4, Oct4, and cmyc (KOM) compared to KOM MEFs expressing SoxAb2 or Basp1 shrna. Clustering represents single linkage Euclidian distance. i) Primary colonies induced by Basp1 knockdown + KOM can be expanded into cell lines and cultured under standard mes conditions for at least ten passages. j) Basp1 knockdown ipsc lines do not harbor transgenic viral Sox2 as expected but do harbor viral Oct4 and Klf4 genes. k) RNAseq scatter plots showing that global gene expression of Basp1 knockdown ipsc lines is highly divergent from somatic MEFs relative to ipscs and mescs. Gene expression is plotted as vsd-normalized counts.

6
7 Supplementary Figure 4 Downstream pathways related to Basp1 inhibition can replace Sox2 in generating ipscs. Panel a) Wt1 was co-immunoprecipitated with Basp1 in somatic MEFs. b) Primary colonies induced by Wt1 overexpression + KOM can be expanded into cell lines and cultured under standard mes conditions for at least ten passages. c) Wt1 overexpression + KOM ipsc lines appropriately express pluripotency marker SSEA1, Sox2, Oct4, and Nanog. d and e) RNAseq scatter plots showing global gene expression of KOM + Wt1 ipsc lines are highly similar to TEC competent ipsc (imz21) and mesc (MCNT) lines relative to their dissimilarity with somatic MEFs. Gene expression is plotted as vsd-normalized counts. f) Wt1 overexpression + KOM ipsc lines differentiate to the three embryonic germ layers in vitro. g) Scatter plots depicting mean changes in gene expression induced by Wt1 overexpression and Basp1 knockdown on day four and twelve of reprogramming. Expression is normalized to KOM only samples. Error bars = SEM. h) ipsc lines generated with Lin28/Esrrb + Klf4 and Oct4 express pluripotency markers SSEA1, Sox2, Oct4, and Nanog. i) Quantitative RT-PCR showing shrna-mediated knockdown of Wt1 in ipsc line imz9 ipsc and v6.5 mesc reduces expression of Esrrb, Lin28, and the downstream target cmyc. Bars represent means from three biological replicates meaning independent wells of cells treated with the shrna and analyzed separately. Error bars = SEM. Significance was tested by Students t-test for each comparison, * p<0.05, **p<0.01.
8 Supplementary Figure 5 Evidence that WT1 can bind to candidate Lin28 promoter regions. WT1 ChIP-qRT-PCR on LIN28A and B genomic regions. Genomic PCR was performed on regions identified to contain WT1 consensus DNA-binding elements (green line) from in silico analysis. Bars represent the mean of three biologic replicates. Statistical significance was assessed by ANOVA, * p<0.05, **p<0.01. b) Expression of LIN28 (A and B), WT1 (C and D), and BASP1 (E and F) in CML patients. In the left panels, each bar represents a single patient. Right panels are averages of all patients for each group, with significance determined by ANOVA, ***p<0.001.
 WT-1 protein level in MEF was reduced by three different shrna sequences (Sigma Mission ), while the housekeeping gene actin")
9 Supplementary Figure 6 Validation of shrnas used in the study. The shrnas used in the study reduce expression of the expected proteins a) WT-1 protein level in MEF was reduced by three different shrna sequences (Sigma Mission ), while the housekeeping gene actin is unaffected. b) BASP-1 protein level in MEF cells was reduced by two different shrna sequences (Sigma Mission ) separately and in combination.

10 Supplementary Figure 7 Full views of gels used for western blotting.