PHA Production from Organic Wastes: The Role of VFAs and Digestate as Nutrient Media
|
|
|
- Michael Pitts
- 5 years ago
- Views:
Transcription


1 PHA Production from Organic Wastes: The Role of VFAs and Digestate as Nutrient Media 21st May 2015, Birmingham, UK Prof. Sandra Esteves


2 Anaerobic Digestion Waste and Wastewater Treatment Bio Energy Systems Monitoring and Control Environmental Analysis Biohydrogen Systems Bioelectrochemical Devices Hydrogen Energy Advanced Nanomaterials The Hydrogen Centre Biochemicals and Bioplastics Production Biogas Upgrading and Utilisation Life Cycle Analysis
3 Energy and material fluxes The Fluxes in Today s Society are already Complex What about GREEN Chemical and Biopolymer Platforms?
4 Chemicals from from Biomethane: Methane: Acetic Acid Acetic Acid Production Route: Biohydrogen Products from anaerobic fermentations CH 4 Biomethane Methane + H 2 O Steam Reforming 2H 2 + CO Synthesis Gas CH 3 COOH Acetic Acid + CO Methanol Carbonylation CH 3 OH Methanol Annual Global Production of Acetic Acid 10.7 million tonnes (34 th highest production volume chemical) Acetic Acid End-uses Adhesives, coatings, inks, resins, dyes, paints and pharmaceuticals. It can also be further converted into other chemicals e.g. vinyl acetate, acetic anhydride, cellulose acetate, terephthalic acid and polyvinyl chloride Price of Acetic Acid Variable, but can be sold for $ per metric tonne
5 Chemicals from Methane: Urea Urea Production Route: CH 4 Biomethane Methane Chemicals from Biomethane: Urea + H 2 O Steam Reforming 2H 2 + CO Synthesis Gas + H 2 O Water Gas Shift Reaction Biohydrogen Hydrogen and carbon and Carbon dioxide Dioxide H 2 + CO 22 + N 2 Haber Process Products from anaerobic fermentations (NH 2 ) 2 CO Urea + CO 2 NH 3 Ammonia Annual Global Production of Urea 120 million tonnes (18 th highest production volume chemical) End-uses of Urea 91% of urea is used for the production of solid nitrogen-based fertilisers. Non-fertiliser uses include the production of ureaformaldehyde resins, melamine, animal feed and numerous environmental applications Price of Urea $ per metric tonne

6 Anaerobic Digestion Process Biogas Rate limiting


7 Acetate Propionate Eubacteria Methanosaetaceae Methanobacteriales Methanomicrobiales Methanosarcinaceae Williams et al. 2013
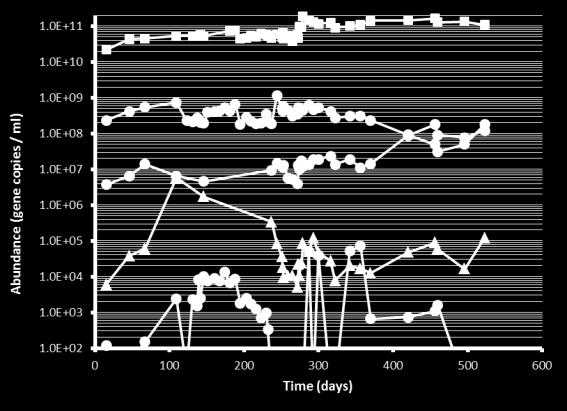
8 Methanogens and VFA residuals Williams et al. 2013
9 Propionate & Lithotrophic Methanogens VFA (mg / l) Propionate Williams et al. 2013
10 Diversity of Populations in Different Inocula Phylum distribution (%) * Inoculum A Inoculum B Methanosaeta 0 2 Methanosarcina 6 0 Actinobacteria 0 8 Firmicutes Bacteroidetes Planctomycetes 0 0 Proteobacteria 0 7 Spirochaetes 0 2 Synergistetes 1 7 Tenericutes 1 0 Verrucomicrobia 0 1 Chloroflexi 2 8 Unknown gene copies 8 33 Oliveira et al. To be submitted

11 Integration of Anaerobic Processes & PHA production

12 Volatile Fatty Acids from Food Wastes Jobling-Purser et al., submitted Experiments ~ 1/3 of the initial VS converted to VFAs in a matter of a couple of days and the rest can be produced in another fermentation

13 Volatile Fatty Acids from Badmington Grass Kumi et al., to be submitted


14 VFA Production from Thermally Hydrolysed Secondary Sludge Kumi et al., to be submitted
15 VFAs in Percolate MSW (Full Scale) Double solubilisation of organics to be digested instead of composted and available for biorefining products Oliveira et al. In preparation


16 Near Infrared Spectroscopy In Bioreactor Performance Monitoring g.l Total Solids g.l Volatile Solids Reed et al., mg.l mg.l Data Point Bicarbonate Alkalinity Volatile Fatty Acids
17 Concentration of VFAs from Sewage Sludges Pretreated Hydrolysates (Before Acidification) Concentrate: Nearly 20,000mg/l total VFAs, which was the aim for the application Tao et al., submitted


18 Modern human society depends on the use of plastics light weight, durable and versatile and have been even cheap Very short life span in many cases Fossil fuel based plastics impose adverse environmental impacts non-biodegradable; persisting in the environment for a long time causing severe damage to wildlife Google images
 Microbial fermentation Polyhydroxyalkanoates (PHA) Maize and/or potato starch in blend with polycaprolactones and other")
19 Bioplastic Categories Biomass from crops Biomass from crops Biomass from crops and wastes Starch, cellulose Sugars Sugars, oils, VFAs Modification Starch and cellulose materials Microbial fermentation Chemical polymerisation Lactic acid Poly(lactic acid) Microbial fermentation Polyhydroxyalkanoates (PHA) Maize and/or potato starch in blend with polycaprolactones and other biodegradable esters PHA Extraction PHA
 University of South Wales (lead) July 2013 Dec 2014 ( 1.")

20 ACADEMIC EXPERTISE FOR BUSINESS (A4B) Collaborative Industrial Research Project SuPER PHA Systems and Product Engineering Research for Polyhydroalkanoates (PHA) University of South Wales (lead) July 2013 Dec 2014 ( 1.2M) Partners: Swansea and Bangor Universities Aber Instruments Ltd. Axium Process Ltd. Excelsior Technologies Ltd. FRE-Energy Ltd. Kautex-Textron Ltd. Loowatt NCH Nextek Ltd. Scitech Adhesives systems Ltd. (Supported by BASF) Thames Water Waitrose Welsh Water
21 Polyhydroxyalkanoates Polyhydroxyalkanoates (PHA) accumulate as intracellular carbon and energy reserve naturally within a variety of gram positive and gram negative bacteria. General principle for PHA accumulation = Excess carbon + Nutrient deficiency. PHAs are thermoplastic polyesters with melting point ºC. UV stable, low permeation of water and good barrier properties Properties can be tailored to resemble elastic rubber (long side chains) or hard crystalline plastic (short side chains) O O O Polyhydroxybutyrate (PHB) Brittle O O O PHBcoPHV Hard/flexible O O O O O O O O O Medium chain length Polyhydroxyalkanoate (mclpha) Thermoplastic Elastomer

22 Chemical Structures
. Xu et al., 2010 - TEM images of C. necator in fermentation,(a) 24 h, (B) 62 h, (C) 70 h, and (D) 82 h.")
23 Cupriavidus necator Cupriavidus necator, industrial PHA producer, has shown to naturally produce PHB close to 85% of its dry weight. Gram negative, rod-shaped, flagellate, chemo heterotrophic (DSMZ). Xu et al., TEM images of C. necator in fermentation,(a) 24 h, (B) 62 h, (C) 70 h, and (D) 82 h. Species generally occurs in soil, known for resistance to various metals.
24 Various control strategies for maximum PHA production This presentation outlines the investigations related to three main important factors : 1. Optimal feeding of VFA for maximum PHA production; 2. The establishment of a real-time tool for determination of the optimum polymer harvesting time; 3. The utilisation of nutrients from digestates for bacterial growth and PHA production; and 4. Evaluation of the effects of sodium chloride on bacterial growth and PHA accumulation.
25 PHB (g/l) PHA (g/l) VFA supplied as a single feed % Acetic Acid Batch fermentations with single VFA addition of 1 5 % v/v acetic acid and 1 5 % v/v butyric acid % Acetic Acid 3% Acetic Acid 4% Acetic Acid 5% Acetic Acid % Butyric Acid 0.0 2% Butyric Acid 3% Butyric Acid 4% Butyric Acid 5% Butyric Acid Time (h) Time (h) When VFA was supplied as a single feed, it was found that concentrations higher than 3% v/v VFA led to substrate inhibition. Only 18% acetic acid and 12% of butyric acid was converted into PHA, resulting in less than 65% (w/w) of PHA content in the microbial cells. Kedia et al., 2015
26 Capacitance (pf/cm) PHA (g/l) Monitoring Real Time PHA Accumulation Capacitance- Acetic Acid PHA (g/l)- Acetic Acid Capacitance- without excess carbon PHA (g/l) - without excess carbon Time (h) 0 Online capacitance (pf/cm) profile and ex-situ measured PHA yield in medium fed with acetic acid as the carbon source or without excess carbon source.
27 Monitoring Real Time PHA Accumulation Online capacitance (pf/cm) profile and ex-situ measured PHA yield in medium fed with butyric acid as the carbon source.
28 PHA (g/l) PHA Concentration / Yield from Digestates and NM NM D1 D Time (h) In D2, PHA concentration was increased by almost 3x when compared to D1 and NM. The cells were almost 90% packed with PHA in D2. PHA Yields and % CDW: NM g PHA/ g VFA (28 h); 78 % CDW D g PHA/ g VFA (48 h); 84% CDW D g PHA/ g VFA (43 h); 90% CDW
29 CDW (g/l) Effect of NaCl concentration on bacterial growth At 24 h, max CDW was demonstrated by 9 g/l NaCl concentration 9 g/l NaCl = CDW 6.8 g/l 3.5 g/l NaCl = CDW 6 g/l 6.5 g/l NaCl = CDW 6.1 g/l Control = CDW 6.4 g/l g/l NaCl 6.5 g/l NaCl 9 g/l NaCl 12 g/l NaCl 15 g/l NaCl No salt For fermentations with NaCl concentrations of 12 g/l and 15 g/l the CDW was 69-70% lower than compared to the control at 24 h, indicating an inhibitory effect at higher salt concentrations demonstrated by the lower cell growth of C. necator cells Time CDW profile for NaCl concentration fermentations and control


30 AD integration with Biopolymers Digestate Nutrient Management Biopolymer PHA digests well high CH 4 yield contributing to increasing C:N ratio in digesters and increase in digestate quality Biocomposite Centre


31 Recycling Bioplastics Through AD Processes
32 Methane yield ml CH 4 / g VS added 600 Anaerobic Biodegradability of Polymers Days


33 Acknowledgments Dr. Tim Patterson, Dr. Gopal Kedia, Dr. Pearl Passanha, Phil Kumi, Ben Joblin-Purser, Dr. Des Devlin, Dr. James Reed, Dr. Julie Williams, Dr. Gregg Williams, Dr. Christian Laycock, Prof. Richard Dinsdale, Prof. Alan Guwy, Dr. Robert Lovitt and team (Swansea University) and Dr. Robert Elias and team (Bangor University) The sole responsibility for the content of this document lies with the authors. It does not necessarily reflect the funders opinion. Neither the authors or the funders are responsible for any use that may be made of the information contained therein.