Electronic Supplementary Information
|
|
|
- Elvin Elwin Elliott
- 5 years ago
- Views:
Transcription
1 Electronic Supplementary Information FRET-based probing to gain direct information on sirna sustainability in live cells: Asymmetric degradation of sirna strands Seonmi Shin, a Hyun-Mi Kwon, b Kyung-Sik Yoon, c Dong-Eun Kim,*b and Sang Soo Hah *a a Department of Chemistry, Research Institute for Basic Sciences, and Research Center for New Nano Bio Fusion Technology, Kyung Hee University, Seoul , Korea. b Department of Bioscience and Biotechnology and WCU Program, Konkuk University, Seoul , Korea. c Department of Biochemistry and Molecular Biology, School of Medicine, Kyung Hee University, Seoul , Korea * To whom correspondence should be addressed: kimde@konkuk.ac.kr or sshah@khu.ac.kr. 1
2 Experimental Section: Unless otherwise noted, reagents were obtained from commercial suppliers and were used without further purification. 21-nt single-stranded (ss) sirnas against egfp (sense or passenger strand: 5 -pggc UAC GUC CAG GCG CGC ACC-3, and antisense or guide strand: 5 -pugc GCU CCU GGA CGU AGC CUU-3, C. D. Novina et al., Nat. Med., 2002, 8, 681) were synthesized and purified by Bioneer (Daejun, Korea). Double fluorescent labeling occurred at the 3 and 5 ends of the sense and antisense strands with TAMRA (5 -tetramethylrhodamine) and Cy5, respectively; the structures of the double-stranded sirna derivatives conjugated to the 5 and/or 3 of the passenger and guide strands are shown in Fig. 1 in the text. It is known that when these two fluorophores of TAMRA and Cy5 are <10 nm apart, emission from the FRET acceptor Cy5 can be detected due to energy transfer upon excitation of the FRET donor TAMRA (Refs. 5 and 6 in the text). This is because the two-dye probes are composed of an energy donor (TAMRA, exc = 560 nm) and an energy acceptor (Cy5, exc = 647 nm) as a FRET pair, and also because the Förster radius of TAMRA and Cy5 dye pair is reported to be 5.3 nm (Ref. 5 in the text) with largely separated excitation profiles (in the present study, the fluorophores in the dyelabeled 21-nt sirnas are designed to be <6 nm apart and this separation can greatly reduce direct excitation of the acceptor Cy5 when the donor fluorophore is excited at 560 nm). The concentrations of the sirna stock solutions were calculated from absorption measurement at 260 nm (1 OD 260 = 40 g/ml) with an Agilent 8453 spectrometer (Santa Clara, CA), where the absorption of the TAMRA label at 260 nm was taken into account. The presence of the fluorescent labels was verified by absorption measurements at 560 nm for TAMRA ( TAMRA (560 nm) = 91,000 M -1 cm -1 ) and 650 nm for Cy5 ( Cy5 (650 nm) = 250,000 M -1 cm -1 ) (Refs. 5,6 in the text). Three double-labeled sirna duplexes were prepared through hybridization of antisense and sense RNA strands (Fig. 1 in the text). Equimolar amounts of both 2
3 RNAs were mixed in an annealing buffer (final buffer concentration: 50 mm Tris at ph 7.5, 100 mm NaCl), and annealing was performed in a thermal cycler (2 min incubation at 94 C, followed by slow cooling to 25 C over a time period of 45 min). Emission fluorescence spectrum of each prepared dye-labeled sirna was scanned using Synergy Mx fluorimeter (BioTek, Winooski, VT) upon excitation at 560 nm. HEK293T human renal epithelial cells were obtained from American Type Culture Collection (Manassas, VA) and were maintained in tissue culture plates at 37 C in an atmosphere of 5% CO 2 in DMEM/High Glucose (Thermo, Waltham, MA) supplemented with 10% fetal bovine serum, 100 IU/ml penicillin and 0.1 mg/ml streptomycin. Exponentially growing cells were cultured following standard procedures until approximately 50% confluence was reached. Cells (approximately 50,000) were plated and harvested by means of trypsinization (0.5 ml of 0.25% trypsin solution for 1 min at 37 C), and the resulting single cell suspension was plated in 6 cm wells at cells per well for h prior to egfp expression vector (pegfp-n1, BD Clontech, Heidelberg, Germany) according to the standard transfection protocols. Briefly, cationic lipid complexes were prepared by incubating 0.4 g egfp vector with 4 μl lipofectamine (Gibco-Invitrogen, Rockville, Maryland) in 100 μl serum-free DMEM (Gibco-Invitrogen) for 20 min, and were slowly added to the wells. After 4-h incubation, media were changed with the fresh growth media, and the cells were further incubated. At 16 h after transfection, egfp expression was analyzed using fluorescence microscopy in the FITC channel. In other cases, after 16-h incubation, cells were washed and used for transfection with nonlabeled or dye-labeled sirnas for confocal image acquisition. The expression levels of egfp and the fluorescence intensities in cells were quantified using Gel-Pro Analyzer (Media Cybernetics). For confocal images, HEK293T cells were seeded in an 8-well LabTek chamber slide (Sigma) at a density of and maintained for 24 h. Liposome-siRNA complexes were prepared in 50 μl serum-free DMEM by incubating 30 pmol of double-labeled sirna with
4 μl lipofectamine for 20 min at room temperature. After serum-free media were added to the solution, cells were transfected with the complexes and incubated for 30 min, 1 h, 2.5 h, and 3.5 h, respectively. After the transfection, the media were discarded and the cells were washed 3 times with PBS solution. After the cells were fixed with 3.7% paraformaldehyde solution, confocal images were obtained at each time point using LSM510 confocal laser scanning microscope (Carl Zeiss Inc., USA). To acquire an egfp fluorescence signal (emission: 509 nm), each sample was excited at 488 nm. A fluorescence signal of TAMRA-siRNA was detected at 581 nm with an excitation at 543 nm, and a fluorescence signal of Cy5-siRNA was detected at 667 nm with an excitation at 633 nm, respectively. A FRET signal was obtained at 667 nm with an excitation at 543 nm. 4
5 Figure Legend: Supplementary Figure 1. Fluorescence spectra of a TAMRA-labeled sirna duplex (resulting from TAMRA-labeled guide strand and non-labeled passenger strand, grey line) as a standard (14.0 M) and three double-labeled sirna duplexes (14.0 M) before and after RNase treatment were scanned and recorded upon excitation at 560 nm. It should be noted that the released TAMRA after degradation of the dye-labeled sirnas may cause negligible effect on the FRET donor s emission intensity in spite of some possible energy transfer because of the some closely positioned protein acting as a FRET acceptor. Supplementary Figure 2. Fluorescence emission images for comparison of gene silencing effects of sirna labeled with FRET dyes. Non-, both-, sense-, and antisense-labeled sirnas (30 pmol each), respectively, were transfected into the egfp-expressing HEK293T cells. Images were taken 16 h after transfection (Column 1: phase contrast images, Column 2: egfp expression images at 509 nm after 488-nm excitation, Column 3: merged images). Supplementary Figure 3. Confocal image analysis of sirna labeled with FRET dyes. Fluorescence emission after 1-h incubation from the egfp-expressing HEK293T cells into which non-labeled, sense-labeled (or passenger strand-labeled), and mixture (9:1) of non-labeled and sense-labeled sirnas, respectively, were transfected (Column 1: egfp expression images at 509 nm after 488-nm excitation, Column 2: fluorescence from TAMRA at 581 nm after 543-nm excitation, Column 3: fluorescence from Cy5 at 667 nm after 643-nm excitation, Column 4: merged images). 5
6 Supplementary Figure 1 6

7 Supplementary Figure 2 7
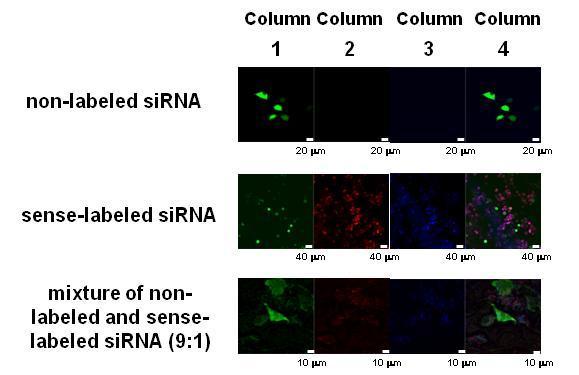
8 Supplementary Figure 3 8