A quantitative investigation of linker histone interactions with nucleosomes and chromatin
|
|
|
- Arnold Thompson
- 5 years ago
- Views:
Transcription
1 White et al Supplementary figures and figure legends A quantitative investigation of linker histone interactions with nucleosomes and chromatin 1 Alison E. White, Aaron R. Hieb, and 1 Karolin Luger 1
2 White et al Supplementary figures and figure legends Supplementary Figures: Supplementary Figure 1: Validation of FRET and competition assays a) 5% native PAGE of samples taken from a HI-FI competition experiment between S31/30 (10 nm) and A1/10 (0-500 nm), for H1FL (1 nm). The gel was visualized at the indicated wavelengths, then stained with ethidium bromide. Lanes 1-6 are H1FL with decreasing amounts of A1/10 (500, 62.5, 15.6, 1.95, 0.244, nm, respectively). Lane 7 is S31/30 Atto647N nucleosome alone. Donor signal with H1FL remains with S31/30 nucleosome as more A1/10 nucleosome competitor is added (lanes 1-6: middle gel) indicating that A1/10 nucleosome is unable to compete H1FL from the S31/30 nucleosome. b) Representative (de)quenching curves of S30/30 nucleosome with the H2A.Z histone variant (S30/30.z) reconstituted with mouse histones, to measure the interaction with H1*FL. H1FL was held constant at nm and S30/30.z nucleosome was titrated (0-25 nm). Curves were fit with a quadratic equation (Eq. 3). c) Representative (de)quenching curve of NLE-Tri (NLE-Tri.z) nucleosome with the H2A.z histone variant containing mouse histones, upon binding to H1*FL. H1FL was held constant at nm and NLE-Tri.z nucleosome was titrated (0-25 nm). Curves were fit with Eq. 3. Supplementary Figure 2: Analysis of NLE-Tri H1 complexes by Atomic Force Microscopy NLE-Tri was imaged with AFM alone or in presence of H1FL (molar ratio of 1 H1 per 1 NLE-Tri array). a) Digital zooms of AFM scan with example height trace(s) of NLE-Tri alone (left) or with H1FL (right). Height increases 1.3 to 1.9 nm when H1FL is present. b) Upper two panels: Digital zoom of scans of NLE-Tri alone showing the open geometry of the trinucleosome. Lower two panels: Digital zoom of scans of NLE-Tri in the presence of H1FL depicting the closed trinucleosome. Supplemental Figure 3: Representative FRET curves, and competition with H1 C-terminal tail deletion constructs. 2
3 White et al Supplementary figures and figure legends a) Representative competition experiment between S31/30 (10 nm) and the indicated unlabeled nucleosome (0-500 nm) for H (1 nm). Curves were fit with Eq. 4. b) Representative competition curves between S31/30 (20 nm) and the indicated unlabeled nucleosome (0-500 nm) for H11-96 (1 nm). Curves were fit with Eq. 4. c and d) Representative (de)quenching isotherm of (c) LE-Tri (0-25 nm) or (d) NLE-Tri (0-25 nm) for H (0.1 nm). Data were fit with Eq 3. Supplemental Figure 4: Validation of NLE-Tri and LE-Tri saturation and H1 purification. a) Representative (de)quenching curves of H1FL purified with the published method demonstrating the effect of prep age on H1FL affinity. Upper panel: bi-phasic nature of H1- nucleosome interaction after storage of H1 at 4 0 C for ~4 days. The gray curve is S30/30 (from figure 3b right). Lower panel: the bi-phasic curve (above) separated into 2 binding isotherms (lower and upper) fit with eq 3. Lower portion (black) has a Kd of / (R 2 =0.901); upper portion (dark gray) has a Kd of / (R 2 =0.89). b) 15% polyacrylamide SDS PAGE of H1 derivatives using an improved purification method (Lanes 2-6), fluorescent image (top) and Imperial protein stain (bottom). Lanes 2-4 are the indicated H1 derivative which had previously been frozen. Lane 5: freshly made protein; lane 6: unlabeled H1FL. Degradation of H1FL occurs rapidly (in less than one week) at 4 0 C storage (lane 7); this is only seen when visualized by fluorescence. c) Sequences of all mono-nucleosome DNA fragments used in this study. Trinucleosomes sequences are 3 copies of S30/30. d) Trinucleosomes were analyzed for degree of saturation. EcoRI digestion of NLE-Tri (top) and LE-Tri (bottom); the absence of free 207 DNA indicates the trinucleosome is saturated. U: uncut, C: cut. Lane 1: uncut trinucleosome; lane 2: EcoRI-treated; lane 3: S30/30 nucleosome control; lane 4: S30/30 bp DNA. e) Analysis of trinucleosomes by analytical ultracentrifugation (AUC). Sedimentation coefficients (S(20,w)) for trinucleosome substrates. NLE-Tri = ~16S; LE-Tri = ~18S. Both trinucleosome 3
4 White et al Supplementary figures and figure legends substrates were reconstituted with mouse histones and have a slightly different S50 compared to published results using Xenopus laevis histones 1. References 1 Winkler, D. D., Luger, K. & Hieb, A. R. Quantifying Chromatin-Associated Interactions: The HI-FI System. Methods Enzymol 512, , doi:b [pii] /B (2012). 4

 λ 488 nm Ex.; 520 Em.")
5 S31/30* Nuc S31/30* Nuc S31/30* Nuc a) H1* FL H1* FL H1* FL A1/10 A1/10 A1/10 S31/30* Nuc A1/10 Nuc M Acceptor (nuc) λ 633 nm Ex.; 670 Em. Donor (H1) λ 488 nm Ex.; 520 Em. Ethidium Bromide Free DNA b) c) Supplementary Figure 1


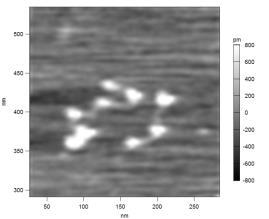
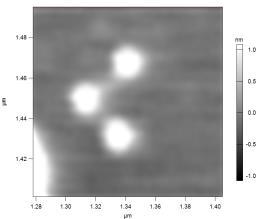
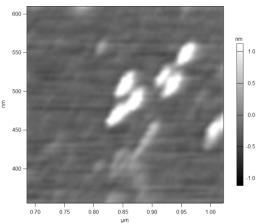
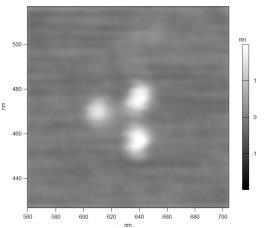
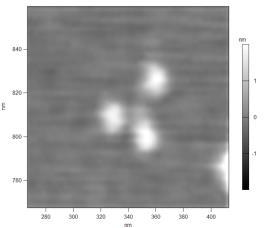
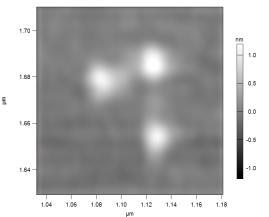
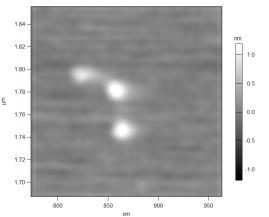
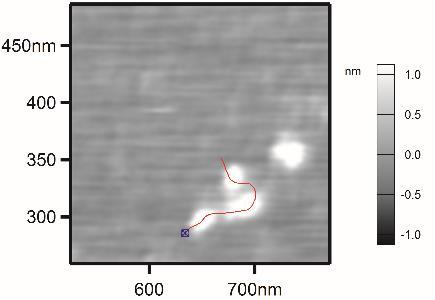
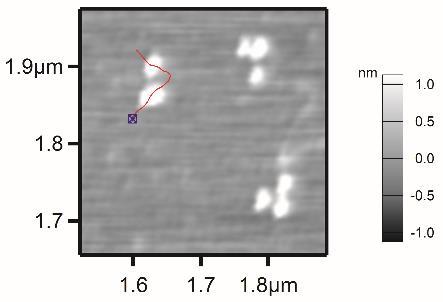
6 a) NLE-Tri NLE-Tri + H1 b) NLE-Tri NLE-Tri + H1 Supplementary Figure 2
7 a) b) c) d) Supplementary Figure 3


8 a) c) S30/30 -ATCTAATACTAGGACCCTATACGCGGCCGCATCGGAGAATCCCGGTGCC S31/30* GATCTAATACTAGGACCCTATACGCGGCCGCATCGGAGAATCCCGGTGCC A3/30* CGCATCGGAGAATCCCGGTGCC S17/13 --TC G----GGATACGCGGCCGCCCTGGAGAATCCCGGTGCC A18/1 -ATC C----CTATACGCGGCCGCCCTGGAGAATCCCGGTGCC S7/11 ---C G AGCCAG-GCCTGAGAATC-CGGTGCC A1/ A----G-GCCTGAGAATC-CGGTGCC NCP G-GCCTGAGAATC-CGGTGCC * ******* ******* S30/30 GAGGCCGCTCAATTGGTCGTAGACAGCTCTAGCACCGCTTAAACGCACGT S31/30* GAGGCCGCTCAATTGGTCGTAGACAGCTCTAGCACCGCTTAAACGCACGT A3/30* GAGGCCGCTCAATTGGTCGTAGACAGCTCTAGCACCGCTTAAACGCACGT S17/13 GAGGCCGCTCAATTGGTCGTAGACAGCTCTAGCACCGCTTAAACGCACGT A18/1 GAGGCCGCTCAATTGGTCGTAGACAGCTCTAGCACCGCTTAAACGCACGT S7/11 GAGGCCGCTCAATTGGTCGTAGACAGCTCTAGCACCGCTTAAACGCACGT A1/10 GAGGCCGCTCAATTGGTCGTAGACAGCTCTAGCACCGCTTAAACGCACGT NCP GAGGCCGCTCAATTGGTCGTAGACAGCTCTAGCACCGCTTAAACGCACGT ************************************************** S30/30 ACGCGCTGTCCCCCGCGTTTTAACCGCCAAGGGGATTACTCCCTAGTCTC S31/30* ACGCGCTGTCCCCCGCGTTTTAACCGCCAAGGGGATTACTCCCTAGTCTC A3/30* ACGCGCTGTCCCCCGCGTTTTAACCGCCAAGGGGATTACTCCCTAGTCTC S17/13 ACGCGCTGTCCCCCGCGTTTTAACCGCCAAGGGGATTACTCCCTAGTCTC A18/1 ACGCGCTGTCCCCCGCGTTTTAACCGCCAAGGGGATTACTCCCTAGTCTC S7/11 ACGCGCTGTCCCCCGCGTTTTAACCGCCAAGGGGATTACTCCCTAGTCTC A1/10 ACGCGCTGTCCCCCGCGTTTTAACCGCCAAGGGGATTACTCCCTAGTCTC NCP ACGCGCTGTCCCCCGCGTTTTAACCGCCAAGGGGATTACTCCCTAGTCTC ************************************************** S30/30 CAGGCACGTGTCAGATATATACATCGATTGCATGTGGATCCGAATTCATA S31/30* CAGGCACGTGTCAGATATATACATCGATTGCATGTGGATCCGAATTCATA A3/30* CAGGCACGTGTCAGATATATACATCGATTGCATGTGGATCCGAATTCATA S17/13 CAGGCACGTGTCAGATATATACATCCTGTGCATGTATTGAC A18/1 CAGGCACGTGTCAGATATATACATCCGAT S7/11 CAGGCACGTGTCAGATATATACATCCAGGCCTTGTGTCG A1/10 CAGGCACGTGTCAGATATATACATCCAGGCCTTGTGTC NCP CAGGCACGTGTCAGATATATACATCCAG ************************* b) H1 FL H H H1 FL H1 FL H1 FL Fluorescence S30/30 TTAATG-AT 207 S31/30* TTAATG-AT 208 A3/30* TTAATG-AT 180 S17/ A18/ S7/ A1/ NCP deg Imperial stain e) d) U C NLE-Tri S30/30 Nuc S30/30 DNA LE-Tri S30/30 Nuc S30/30 DNA Supplementary Figure 4