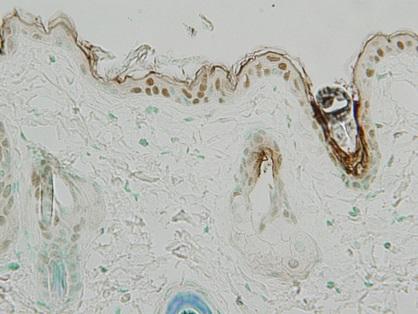
WT Day 90 after injections
|
|
|
- Beatrice Hill
- 5 years ago
- Views:
Transcription


 3 1 PBS")


1 Supplementary Figure 1 a Day 1 after injections Day 9 after injections Klf5 +/- Day 1 after injections Klf5 +/- Day 9 after injections BLM PBS b Day 1 after injections Dermal thickness (μm) 3 1 Day 9 after injections PBS BLM PBS BLM Klf5 +/-
2 Supplementary Figure 1 Bleomycin (BLM)-induced dermal fibrosis lasts longer in Klf5 +/- mice. Subcutaneous injections of BLM (1 μg every other day for 3 weeks) were given to the back skin of female mice at 6 weeks of age. Skin tissue was harvested one day (day 1 after injections) or 3 months (day 9 after injections) after the completion of phosphate buffered saline (PBS) or BLM injections. (a) Representative skin sections of both wild-type () and Klf5 +/- mice injected with PBS or BLM. Scale bar, 1 μm. (b) The summary of dermal thickness in PBS- or BLM-challenged and Klf5 +/- mice. n = mice per group. Data are mean ± s.e.m. *P <.5 by two-tailed unpaired t- test in each set of pairs.


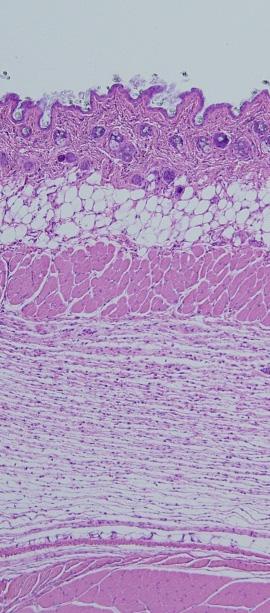
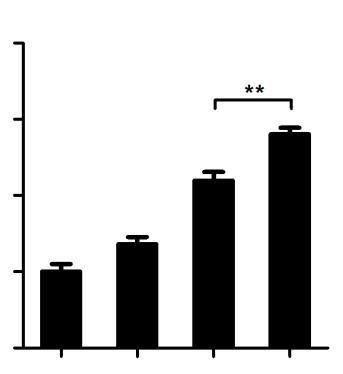
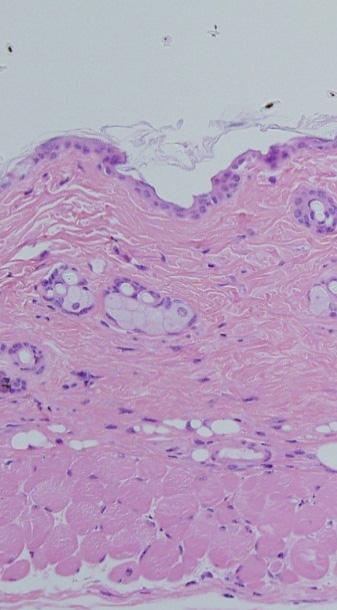
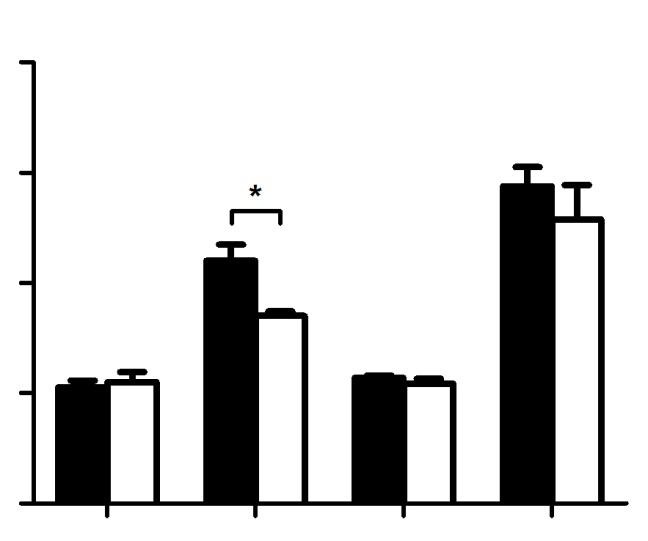
3 Supplementary Figure a Klf5 +/- Tsk/+ Tsk/+; Klf5 +/- b c d Hypodermal thickness (μm) Klf5 +/- Tsk/+ Tsk/+; Klf5 +/- Relative myofibroblast number 3 1 Klf5 +/- Tsk/+ Tsk/+; Klf5 +/- Relative CTGF-positive fibroblast number 3 1 Klf5 +/- Tsk/+ Tsk/+; Klf5 +/- e 8 Ctgf 8 Col1a 6 6 Klf5 +/- Tsk/+ Tsk/+; Klf5 +/- Klf5 +/- Tsk/+ Tsk/+; Klf5 +/-
4 Supplementary Figure Klf5 heterozygosity increases hypodermal thickening in Tsk/+ mice. (a) Representative skin sections of the following mice are shown: wild-type () mice with or without Tsk allele and Klf5 +/- mice with or without Tsk allele. Vertical arrows indicate the hypodermal thickness. Scale bar, 1 μm. (b) Hypodermal thickness of each group is summarized. (c,d) The relative numbers of myofibroblasts (c) and connective tissue growth factor (CTGF)-positive fibroblasts (d) in the hypodermis. The number per high power field is adjusted to that in mice set at 1. (e) mrna expression levels of Ctgf and Col1a in the skin tissue. n = mice per group. Data are mean ± s.e.m. *P <.5, **P <.1, ***P <.1 by one-way ANOVA with Bonferroni s post hoc test.

 1")


5 Supplementary Figure 3 b a Klf5 fl/fl PBS Klf5 fl/fl ;Col1a-Cre PBS c 3 * *** Klf5 fl/fl Dermal thickness (μm) 1 * PBS BLM PBS BLM Klf5 fl/fl ;Col1a-Cre Klf5 fl/fl BLM Klf5 fl/fl ;Col1a-Cre BLM d Klf5 fl/fl Klf5 fl/fl ; Col1a-Cre * *** Relative collagen content PBS BLM PBS BLM Klf5 fl/fl Klf5 fl/fl ; Col1a-Cre e f Klf5 fl/fl BLM Klf5 fl/fl BLM -smooth muscle actin Klf5 fl/fl ;Col1a-Cre BLM CTGF Klf5 fl/fl ;Col1a-Cre BLM Relative myofibroblast number 6 * ** PBS BLM PBS BLM Klf5 fl/fl Klf5 fl/fl ; Col1a-Cre Relative CTGF-positive fibroblast number 8 6 * *** PBS BLM PBS BLM Klf5 fl/fl Klf5 fl/fl ; Col1a-Cre
6 Supplementary Figure 3 Fibroblast-specific Klf5 deletion exacerbates bleomycin (BLM)-induced dermal fibrosis. Subcutaneous injections of BLM (3 μg every other day for 3 weeks) were given to the back skin of female mice at 6 weeks of age. (a) KLF5 staining in dermal fibroblasts. Scale bar, 1 μm. (b) Representative skin sections of Klf5 fl/fl and Klf5 fl/fl ;Col1a-Cre mice injected with phosphate buffered saline (PBS) or BLM. Scale bar, 1 μm. (c) Dermal thickness of each group is summarized. (d) Relative skin collagen content. (e,f) The relative numbers of myofibroblasts (e) and connective tissue growth factor (CTGF)- positive fibroblasts (f) in the dermis. The number per high power field is adjusted to that in PBS-treated Klf5 fl/fl mice set at 1. The representative pictures of skin histology in Klf5 fl/fl and Klf5 fl/fl ;Col1a-Cre mice treated with BLM are shown in the left panels. Scale bar, 1 μm. n = mice per PBS-treated groups and n = 7 mice per BLM-treated groups. Data are mean ± s.e.m. *P <.5, **P <.1, ***P <.1 by one-way ANOVA with Bonferroni s post hoc test.

7 Supplementary Figure Klf5. Ctgf 1..5 Klf5 +/ Klf5 +/- Col1a Acta Itgb Klf5 +/ Klf5 +/ Klf5 +/- Supplementary Figure In cultured dermal fibroblasts taken from Klf5 +/- mice, only connective tissue growth factor (CTGF) expression is significantly increased among several pro-fibrotic markers compared to wild-type () fibroblasts. Relative mrna expression levels of Klf5, Ctgf, Col1a, Acta (encoding α-smooth muscle actin), and Itgb5 (encoding integrin β5) were assessed by qrt-pcr. n = mice per group. Data are mean ± s.e.m. *P <.5, **P <.1 by two-tailed unpaired t-test.
8 Supplementary Figure 5 CTGF 5 ** *** 3 1 SCR (nm) KLF5 sirna (nm) Fli1 sirna (nm) KLF5 FLI * ** ** *** 1..5 *** SCR (nm) KLF5 sirna (nm) Fli1 sirna (nm) SCR (nm) KLF5 sirna (nm) Fli1 sirna (nm) Supplementary Figure 5 A dose-dependent increase in CTGF expression with downregulation of KLF5 and Fli1. Fibroblasts were treated with scrambled control RNA (SCR) or indicated sirna for hours and serum-starved for hours. mrna levels of indicated genes were assessed. The mrna levels are adjusted to that with SCR alone set at 1. Data are mean ± s.e.m. of independent experiments. *P <.5, **P <.1, ***P <.1 by one-way ANOVA with Bonferroni s post hoc test. Significant differences are compared to the leftmost group.

 Klf5 and Fli1 levels are decreased in the skin tissue of Klf5 +/- ;Fli1 +/- mice at an mrna level. n = 8 mice per group.")

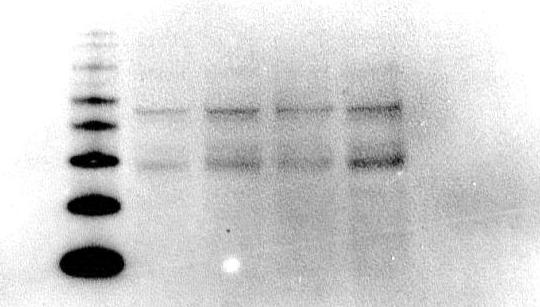
9 Supplementary Figure 6 a Klf5 Fli Klf5 +/- ;Fli1 +/- Klf5 +/- ;Fli1 +/- b c 5 kda- Skin homogenates Klf5 +/- ; Fli1 +/- KLF5 5 kda- Whole cell lysates of fibroblasts Klf5 +/- ; Fli1 +/- KLF5 5 kda- Fli1 5 kda- 5 kda- Fli1 kda- β-actin kda- β-actin Supplementary Figure 6 KLF5 and Fli1 expressions in the skin of Klf5 +/- ;Fli1 +/- mice. (a) Klf5 and Fli1 levels are decreased in the skin tissue of Klf5 +/- ;Fli1 +/- mice at an mrna level. n = 8 mice per group. (b) KLF5 and Fli1 levels are decreased in the skin tissue of Klf5 +/- ;Fli1 +/- mice at a protein level. The result is a representative of n = pairs of samples. (c) KLF5 and Fli1 levels are decreased in the cultured dermal fibroblasts from Klf5 +/- ;Fli1 +/- mice at a protein level. The result is a representative of n = pairs of samples. Data are mean ± s.e.m. *P <.5, **P <.1 by two-tailed Mann- Whitney U test.


10 Supplementary Figure 7 a.5 Ctgf Col1a Klf5 +/- Fli1 +/- Klf5 +/- Fli1 +/- b Klf5 +/- Fli1 +/- c. Relative collagen content 1..5 Klf5 +/- Fli1 +/- Supplementary Figure 7 Neither Klf5 +/- mice nor Fli1 +/- mice show increased levels of skin thickness or collagen content. (a) Using back skin samples of wild-type (), Klf5 +/-, and Fli1 +/- mice, Ctgf and Col1a mrna levels were assessed by qrt-pcr. Ctgf mrna expression in Klf5 +/- skin and Col1a mrna expression in Fli1 +/- skin were upregulated. (b) Histology of back skin samples at 3 months of age. No significant difference in skin thickness was seen among, Klf5 +/-, and Fli1 +/- mice. Representative pictures of n = 8 mice per group. Scale bar, 1 μm. (c) Relative total collagen content in the back skin assessed by total collagen assay. Although collagen content shows a slight increase in Klf5 +/- mice and Fli1 +/- mice compared to mice, the difference is not statistically significant. n = mice per group. Data are mean ± s.e.m. *P <.5, **P <.1 by two-tailed unpaired t-test. The significant differences in a,c are compared to the group.


11 Supplementary Figure 8 a Dcn.5 Lum.5 Adamts Klf5 +/- ;Fli1 +/- Klf5 +/- ;Fli1 +/- Klf5 +/- ;Fli1 +/- Bgn Fmod 3 Bmp1. Lox Klf5 +/- ;Fli1 +/- Klf5 +/- ;Fli1 +/- Klf5 +/- ;Fli1 +/- Klf5 +/- ;Fli1 +/- b DCN 6 LUM ADAMTS Normal SSc Normal SSc Normal SSc BGN FMOD BMP1 LOX Normal SSc Normal SSc Normal SSc Normal SSc c DCN.5 LUM 5 ADAMTS SCR (nm) KLF5 sirna (nm) Fli1 sirna (nm)
12 Supplementary Figure 8 Fibrillogenesis-associated genes are dysregulated in Klf5 +/- ;Fli1 +/- mice. (a,b) mrna levels of enzymes and small leucine-rich proteoglycans involved in fibrillogenesis were assessed by qrt-pcr in the skin of mice (a) and human (b). n = 7 mice or individuals per group. (c) Foreskin fibroblasts were transfected with scrambled control RNA (SCR), KLF5 sirna, or Fli1 sirna for hours and serum-starved for hours. Samples were harvested and mrna expression levels were assessed by qrt-pcr. n = 3- independent experiments. Data are mean ± s.e.m. *P <.5, **P <.1, ***P <.1 by two-tailed unpaired t-test. The significant differences in c are compared to the wild-type () group.


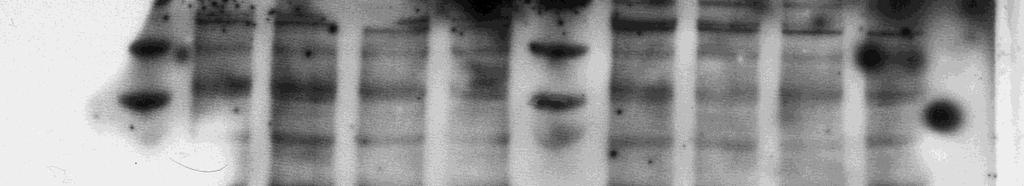
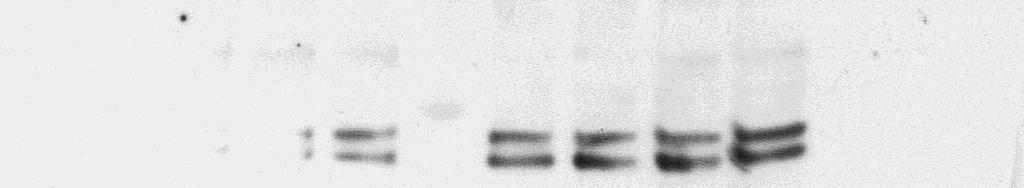
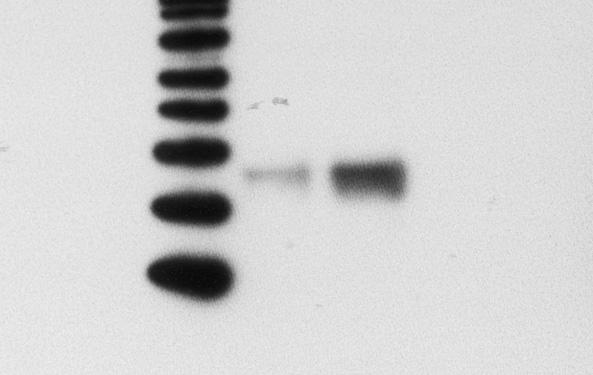
13 Supplementary Figure 9: Full blots Fig 1b KLF5 Fig 1b β-actin Fig 1f

")


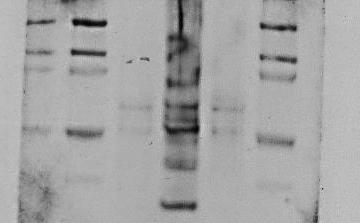

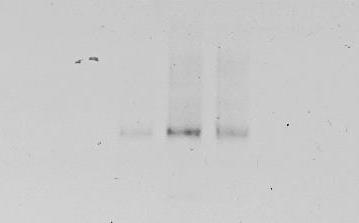


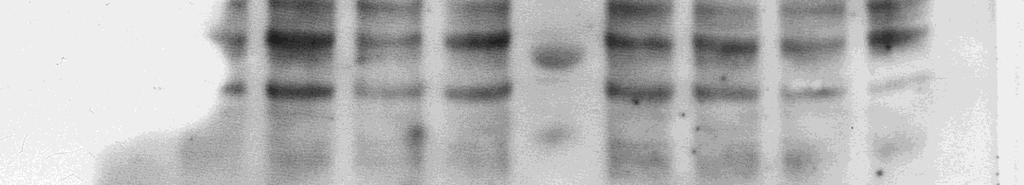
14 Fig 3b CTGF (long exposure) Fig 3h KLF5 Fig 3h Fli1 Fig 3b CTGF (short exposure) Fig 3i KLF5 Fig 3b KLF5 Fig 3i Ets1 Fig 3b β-actin Fig 3i Fli1 Fig 3e Fig 3j


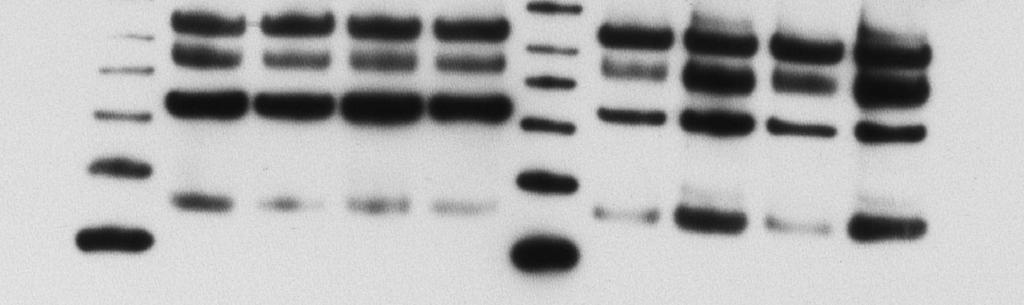
15 Fig 3m CTGF Type I collagen KLF5 Fli1 -actin


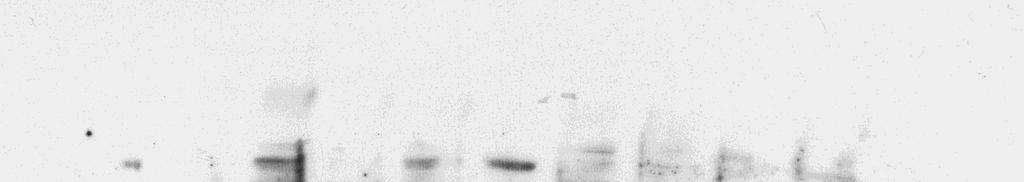


16 Fig 5h p-smad3 Smad3 p-erk ERK p-p38 p38 p-jnk JNK -actin


17 Fig 7j Fig 8c CTGF KLF5 Fli1 -actin

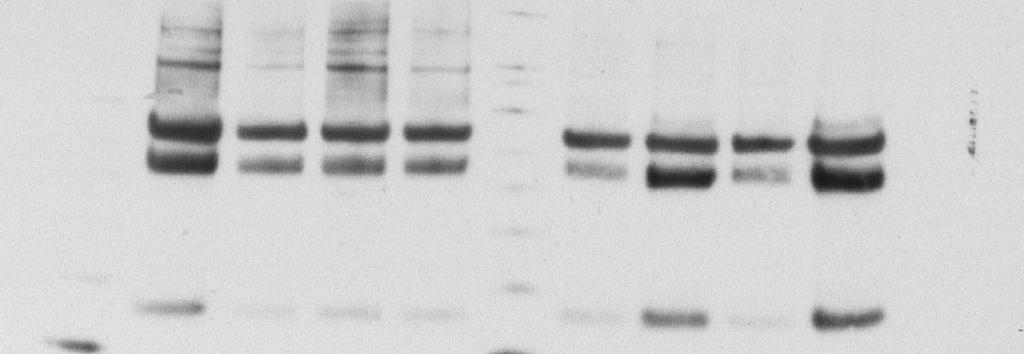


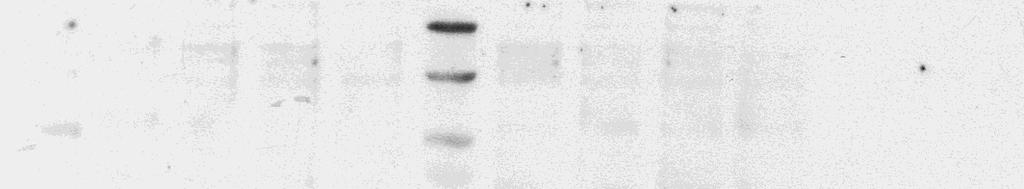
18 Supplementary Fig 6 b c KLF5 KLF5 Fli1 Fli1 β-actin β-actin
19 Supplementary Table 1 The sequences of the primers used for qrt-pcr. The nucleotide sequences of the primers are listed in the 5 to 3 direction. In each set of primers, the first sequence indicates the forward primer and the second sequence shows the reverse primer. Gene Human Gene Mouse KLF5 CCCTTGCACATACACAATGC Klf5 TGGTTGCACAAAAGTTTATAC GGATGGAGGTGGGGTTAAAT GGCTTGGCGCCCGTGTGCTTCC FLI1 GGATGGCAAGGAACTGTGTAA Fli1 ACTTGGCCAAATGGACGGGACTAT GGTTGTATAGGCCAGCAG CCCGTAGTCAGGACTCCCG CTGF TTGCGAAGCTGACCTGGAAGAGAA Ctgf GTGCCAGAACGCACACTG AGCTCGGTATGTCTTCATGCTGGT CCCCGGTTACACTCCAAA COL1A GATGTTGAACTTGTTGCTGAGG Col1a GGAGGGAACGGTCCACGAT TCTTTCCCCATTCATTTGTCTT GAGTCCGCGTATCCACAA DCN TGCAGGTCTAGCAGAGTTGTGT Dcn TGAGCTTCAACAGCATCACC AATGCCATCTTCGAGTGGTC AAGTCATTTTGCCCAACTGC LUM CTTCAATCAGATAGCCAGACTGC Lum AGATGCTTGATCTTGGAGTAAGA AGCCAGTTCGTTGTGAGATAAAC CAATGAACTTGAAAAGTTTGATG FMOD CCACTTCACCCACTCCACTT Fmod CAATGTCTACACCGTCCCTGA CTGGTGACCTCCAATCTGGT AGAAGGCTGCTGGAGTTGAAG LOX GTGGCCGACCCCTACTACATCC Lox GAGAGGTTGGCGAACA AGCAGCACCCTGTGATCATAATCTC AGTACGACTTCGGCAC BGN AGGAGGCGGTCCATAAGAAT Bgn GTGTTGCTTCTTCATCTGGCTATG AGGGTTGAAAGGCTGGAAAT ACCTTCCGCTGCGTTACTG BMP1 CTGTGAGTGGGTCATTGTGG Bmp1 CCATGTCTCTATTGTACGCGAGAA GGTGTCATCCGAGTGGAACT AAGATGCCCCTGGAGAATGTG ADAMTS CTGGCAAGCATTGTTTTAAAGGA Adamts AGTGGGCCCTGAAGAAGTG GGAGCCAAACGGACTCCAAG CAGAAGGCTCGGTGTACCAT Acta CCGACCGAATGCAGAAGGA Acta AGCTGTTTTCCCATCCATTG ACAGAGTATTTGCGCTCCGAA GCGCTTCATCACCCACGTAG IL6 CCACTCACCTCTTCAGAACGAAT Il6 AGTTGCCTTCTTGGGACTGA TTGGAAGCATCCATCTTTTTCA TCCACGATTTCCCAGAGAAC 18S CGCCGCTAGAGGTGAAATTC 18s CGCCGCTAGAGGTGAAATTC TTGGCAAATGCTTTCGCTC TTGGCAAATGCTTTCGCTC Itgb5 ACCTGCCAAGATGGCATATC CACGGACACTTCAAAGGATG Col1a1 GCCAAGAAGACATCCCTGAAG TGTGGCAGATACAGATCAAGC Col3a1 TTTGTGCAAGTGGAACCTG TGGACTGCTGTGCCAAAATA Fn1 CTGTGACAACTGCCGTAG CGATGCTTGGAGAAGCTG Tsp1 TGGTAGCTGGAAATGTGGTG CAGGCACTTCTTTGCACTCA