Fluorescence in situ hybridization (FISH) Testing in Multiple Myeloma
|
|
|
- Lee Wilkerson
- 5 years ago
- Views:
Transcription
1 Fluorescence in situ hybridization (FISH) Testing in Multiple Myeloma William Bellamy, Ph.D., HCLD (ABB), CC (ABB) Arkansas Clinical Laboratory Management Association/ American Society for Clinical Lab Science Little Rock, 2019
2 Molecular Diagnostics Detection and/or quantification of specific DNA or RNA molecules. Qualitative Assays High sensitivity Quantitative Assays Detection cutoff > qualitative broad dynamic range Is it present? How much is present? Information Assays Is a genetic variant present?
3 Molecular Diagnostics How What Why PCR Southern Blot FISH Sequencing Rearrangements Mutations Insertions Deletions Foreign DNA/RNA Diagnostic ambiguity Cryptic abnormalities Stratification Response to therapy Prediction of 2 0 AML Baseline for MRD Infectious Diseases


4 Molecular alterations Deletion/ Insertion Example: 22q11.2 region DiGeorge syndrome Amplification Example: 17q21.1 (ERBB2) Breast cancer Translocation 22 Der 22 Example: t(11;22)(q24;q12) Ewing s sarcoma 11 Der 11
 60 CAGCAA Examples: huntingtin Huntington disease MSI Colon")
5 Molecular alterations Point Mutation (Single base pair change) CCTGAGGAG CCTGTGGAG Example: hemoglobin, beta sickle cell disease Deletion/Insertion (Frame Shifts) GAATTAAGAGAAGCA GAAGCA Example: epidermal growth factor receptor lung cancer Sequence Repeats TTCCAG (CAG) 60 CAGCAA Examples: huntingtin Huntington disease MSI Colon Cancer
6 Variant Sizes Size (bp) Variant Type Example 1 Substitution, SNV BRAF p. V600E <15 Small indel EGFR exon 19 deletions <500 Med. indel FLT3 ITD, internal tandem duplication >500 Large indel Li-Fraumeni syndrome exon deletion in TP53 >1000 Copy number variant MET amplification Variable Structural variants (i.e. translocation) EML4-ALK; BCR-ABL1
 Point Mutations Small insertions/ deletions Large duplications/ deletions Trisomies/ monosomies Altered")
7 Base pairs (log scale) PCR-based Methods Fluorescence in situ hybridization (FISH) Next-Generation Sequencing (NGS) Point Mutations Small insertions/ deletions Large duplications/ deletions Trisomies/ monosomies Altered ploidy


8 UAMS Multiple Myeloma FISH Testing


9 Overview: Multiple Myeloma Multiple myeloma is characterized by malignant plasma cells that reproduce uncontrollably. Plasma cells are terminallydifferentiated B-cells that produce and secrete antigenspecific antibodies. Multiple myeloma plasma cells tend to localize within the bone marrow, although they may be found outside of the marrow as well.


10 Overview: Multiple Myeloma Monoclonal protein: serum and/or urine Osteolytic lesions, hypercalcemia, anemia, increased susceptibility to infections Spectrum: from localized disease to aggressive widely disseminated


11 Immunohistochemical Staining CD38 or CD138 to highlight plasma cells Kappa and Lambda light chain KAPPA CD138 LAMBDA 11
12 Initiation and Progression of myeloma Initiation Progression Germinal Center Bone Marrow Peripheral Blood Post-Germinal- Center B-Cell MGUS Smoldering Myeloma Myeloma Plasma cell leukemia Inherited Variants Primary Genetic Events: IGH Translocations Hyperdiploidy Secondary genetic events: Copy number abnormalities DNA hypomethylation Acquired mutations Adapted from: Morgan et al. Nat Rev Cancer, 2012
13 Genetics of Multiple Myeloma All MM cells are genetically abnormal Cytogenetic studies reveal abnormal karyotype in ~40-50% of MM patients When combined with FISH, number approaches 100% Multiple aberrations per cell (range 1-13) No universal abnormality Lesions present in MGUS
14 Types of Chromosome Aberrations in Myeloma Numerical aneuploidy is present early but more pronounced in the progression of malignancy Balanced reciprocal translocations involving IgH contribute to malignant transformation by oncogene dysregulation Copy Number changes Deletions 1p, 12p, 13q, 14q, 16q, 17p Gains/amplification 1q MYC and Non-IgH translocations contribute to disease progression by deletion and duplication of chromosome segments
15 Genetics of Multiple Myeloma Numerical Changes DNA Hyperdiploidy common (~50% MM) chromosomes Trisomies of chromosomes 3, 5, 7, 9, 11, 15, 19 Rare IgH translocations (~10%) DNA Hypodiploidy denotes poor prognosis Chromosomal range: 42~45 Monosomies of chromosomes 8, 13, 14,16, 22 Prevalent IgH translocations (~70%)
16 Hyperdiploid myeloma
17 Duplication/Amplification of 1q21 Prognostic Significance: Frequency of dup1q21 increases from ~40% in overt myeloma to ~70% at relapse Dup1q21 is associated with a more aggressive clinical course More than 4 copies of 1q is associated with a drug-resistant phenotype Dup1q21 is an independent adverse prognostic factor
18 Genetics of Multiple Myeloma Structural Changes IgH translocations found in 40-60% of MM patients by FISH (Similar in MGUS) May occur at both pre- and post-germinal center stages of B-cell development Result in juxtaposition of oncogenes with IgH enhancers Multiple partners
19 IgH Rearrangements Approximately 40% have IgH aberrations involving five recurrent oncogenes Locus Oncogene Incidence 11q13 (CCND1) 15-20% 4p16 (FGFR3 and MMSET) 10-15% 16q23 (MAF) 3-5% 20q11 (MAFB) 1.5-3% 6p21 (CCND3) <1%
20 Pathway/Activity Molecular Alterations in MM Genes Cell Cycle Transit & Proliferation KRAS (28%), NRAS (21%), BRAF (4-6%), MYC (1%) Immortalization Resistance to Apoptosis NF-kB pathway CDKN2C, RB1 (3%), CCND1 (3%), CDKN2A PI3K/AKT TRAF3 (3%), CYLD (3%), IkB Plasma cell differentiation XBP1 (3%), PRDM1 (BLIMP) (6%), IRF4 (5%) DNA Repair TP53 (8%), MRE11A (1%), PARP1 RNA Editing DIS3 (13%), FAM46C (10%), LRRK2 (5%) Epigenetic abnormalities Global Hypomethylation Gene-specific hypermethylation Epigenetic Alterations Source: Chapman et al. Nature 2011; Morgan et al. Nat. Rev. Cancer 2012 KDM6A (UTX) (10%), MLL (1%), MMSET (8%), HOXA9, KDM6B MGUS Myeloma Myeloma Plasma cell leukemia


21 Specimen DNA FISH Probe Assay Obtain specimen and apply to microscope slide Assay Denature specimen DNA and add probe Probe hybridizes to specimen DNA: 4 to 16 hours (overnight) Wash slides: 2 minutes Add counterstain Analysis Perform analysis
22 Fluorescence in situ Hybridization Strengths Applicable to wide variety of tissues Metaphase & interphase Specimen structure remains intact Detects cytogenetically cryptic aberrations (ex. t(4;14)) Not dependent on proliferation (ifish) Contamination from previous tests not an issue Limitations Can not detect very small genetic lesions (i.e. point mutations) Lacks very low level detection of PCR Counting signals is laborious Requires high level of expertise Sensitive to small changes in environmental factors (temperature; humidity)
 Automates")


23 UAMS FISH Testing FISH Instrumentation: CytoBrite TM Slide Incubation System (SciGene) Automates Hybridization Process Provides superior thermal control 12 to 72 Slide Capacity Thermobrite TM Hybridization Unit (Abbott) Automates Hybridization Process Provides Consistent Hybridization 12 Slide Capacity


24 UAMS FISH Testing FISH Instrumentation: BioView Duet TM Automated Image Analysis System
 Chr A Metaphase Chr B Interphase Locus Specific Probes (LSI) Chr A")
25 Chromosomal Enumerator Probes Probe Types Centromeric Enumeration Probe (CEP) Chr A Metaphase Chr B Interphase Locus Specific Probes (LSI) Chr A Chr B

26 FISH: Numeric Aberrations NORMAL DELETION MONOSOMY TRISOMY
27 Dual color, dual-fusion (D)-FISH probes NORMAL TRANSLOCATION D-FISH Double fusion strategy. More sensitive than S-FISH or ES-FISH. Use: Predominantly for translocations. Both probes span breakpoint region. Results in generation of 2 fusion signals in true-positives


28 t(4;14) by FISH Typical D-FISH Patterns Normal Abnormal 2R, 2G 1R, 1G, 1F 1R, 1G, 2F

29 Dual color, break-apart FISH probes NORMAL TRANSLOCATION Break-apart Probes Different colored probes that hybridize to sequences flanking both sides of breakpoint region Use: Predominantly for translocations with multiple partners. Normal cells demonstrate 2 fusion signals. Structural aberrations that alter the breakpoint site results in separation of signals changing both the number and color observed.

30 t(14q32) by FISH Typical BAP-FISH Pattern Normal Abnormal Split signals 2F 1R, 1G, 1F
31 2019 NCCN Myeloma Molecular Recommendations At initial work-up : Cytogenetics Plasma cell FISH for: Deletion 13q 1q21 amplification Deletion 17p (TP53) t(4;14) (FGFR3/MMSET) t(11;14) (CCND1) t(14;16) (cmaf) IMWG adds FISH for t(14;20) (MAFB)

 Tetrameric Antibody")


32 UAMS Multiple Myeloma FISH Panel CD138+ Enrichment: A. B. (A) Tetrameric Antibody Complex (TAC) with magnetic bead attached. (B) EasySep TM magnet. C. RoboSep-S automated cell-enrichment instrument
33 UAMS Multiple Myeloma FISH Panel CD138+ Enrichment 1 : %Abnormal Plasma Cells Case # Pre-enrichment (%) Post-enrichment (%) Case # %Abnormal Plasma Cells Pre-enrichment (%) Post-enrichment (%) As assessed by flow cytometry using a cocktail of anti-cd19, CD-38, CD45 and CD-138 antibodies
34 UAMS Multiple Myeloma FISH Panel Initial Test (Fresh, CD138+ enriched cells): 1p32/1q21 13q14 Tumor suppressor region 17p13.1 (TP53) Tumor suppressor (P53) t(14q32) (IGH BAP) Chromosomal Locus Gene Probe Color Probe Type 1p32 CDKN2C Green LSI 1q21 CKS1B Orange LSI 13q14 DLEU1,DLEU2 Orange LSI 13q34 LAMP1 Green LSI 17p13 TP53 Orange LSI 17q11.2 NF1 Green LSI 14q32 IGH Orange-Green BAP

35 UAMS Multiple Myeloma FISH Panel Dual Color CDKN2C/CKS1B (1p32/1q21) Probe Normal: 2O-2G Abnormal: 3O-2G Duplication 1q21 CDKN2C/CKS1B Probe Labels Probe Name Probe Location Probe Size Fluorophore CKS1B 1q kb Orange CDKN2C 1p kb Green
36 UAMS Multiple Myeloma FISH Panel Reflex (if IGH positive): t(11;14)(q13;q32) t(14;16)(q32;q23) Chromosomal Locus t(4;14)(p16;q32) t(14;20)(q32;q12) Gene Probe Color Probe Type 4p16 FGFR3 ORANGE 14q32 IGH GREEN D-FISH 11q13 CCND1-MYEOV ORANGE 14q32 IGH GREEN 14q32 IGH GREEN 16q23 MAF ORANGE 14q32 IGH GREEN 20q12 MAFB ORANGE D-FISH D-FISH D-FISH
37 UAMS Multiple Myeloma FISH Panel Assay Requirements: Specimen is received in Lab MRD Flow Cytometry Result Bone Marrow Aspirate Result If MRD Flow shows >1.5% MM Plasma Cells If MRD Flow shows <1.5% MM Plasma Cells If BM <10% Plasma Cells If BM >10% Plasma Cells Proceed with FISH Defer to BM Aspirate Cancel Test Proceed with FISH

38 UAMS Multiple Myeloma FISH Panel 17p13.1/17q11 probe set
39 4p16.3/14q32 probe set
40 UAMS FISH Case 1 Chromosome 1 1R2G 2R1G 1R1G 3R2G 3R1G (1p32/1q21) 2R2G (5.5%) (5.6%) (3.1%) (5.7%) (5.7%) Tech Tech Chromosome 13 1R2G 1R1G 2R1G (13q14/13q34) 2R2G (6.8%) (4.4%) (9.0%) Tech Tech Chromosome 14 1F 1R1G1F 3F (14q32 BAP) 2F (6.0%) (8.0%) (1.8%) Tech Tech Chromosome 17 1R2G 1R1G 2R1G 3R3G (17p13/17q11) 2R2G (6.6%) (4.4%) (5.0%) (3.8%) Tech Tech
41 UAMS FISH Case 1: Reflex t(4;14) 1R1G2F 1R1G1F 2R3G (4p16/14q32) 2R2G (1.5%) (12.5%) (2.4%) Tech Tech t(11;14) 1R1G2F 1R1G1F 2R3G (11q13/14q32) 2R2G (1.5%) (11.6%) (5.7%) Tech Tech t(14;16) 1R1G2F 1R1G1F 2R3G 1R3G (14q32/16q23) 2R2G (1.5%) (10.8%) (1.5%) (6.3%) Tech Tech t(14;20) 1R1G2F 1R1G1F 2R3G (14q32/20q12) 2R2G (1.5%) (12.0%) (2.0%) Tech Tech

 7")
 probes")
 probes")

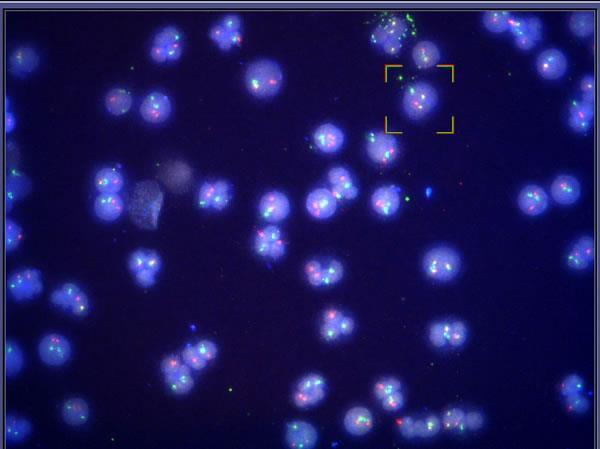
42 Case 1 Chromosome 1 (Dup1q21) Chromosome 13 (Monosomy 13) Chromosome 17 (Normal) t(11;14) probes t(4;14) probes t(14;16) probes t(4;14); Monosomy 13; dup1q21
43 Summary Cytogenetics, FISH and molecular genetics can define subgroups of patients and should be used as part of the evaluation process both at diagnosis and at therapeutic decision points. Genetic alterations are common in myeloma. ~40-50% by karyotype; higher by FISH No specific alterations are associated with myeloma. Includes both numeric and structural aberrations
44 Summary (2) Markers of aggressive clinical course and poor prognosis include: Hypodiploidy Deletion of 17p13 (P53) Monosomy 13/ del(13q14) t(4;14) (MMSET-FGFR3/ IGH) Duplication/amplification of 1q21 Deletion of 1p32 New methodologies are defining additional markers of disease progression as well as identifying alterations suitable for targeted therapies currently available