Funded by the Overseas Development Administration (ODA)
|
|
|
- Estella Lynch
- 5 years ago
- Views:
Transcription

1 Centre for Arid Zones Studies, University of Wales, UK Cambridge Laboratory, Norwich, UK ICRISAT, India Funded by the Overseas Development Administration (ODA)

2 Early papers on QTL mapping


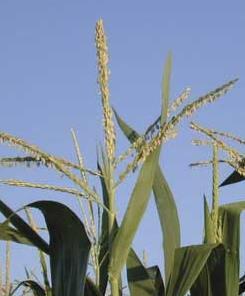
3 Staple food crop of semi-arid tropics Late 196s male sterile lines developed 1971: first of several devastating downy mildew epidemics Annual yield reduced from 13 to 3 mill. metric tonnes Little know about genetics - quantitative
4 Niger Senegal Nigeria India


5 In Wales against Indian and African pathogen populations In ICRISAT, India against local pathogen populations
6 LOD SCORE LGD x ICMP LG1 LG LG LG LG5 6 LG6 6 LG India 4 Map distance (cm) 4 Niger Nigeria Senegal
7 The same QTLs are effective under differing disease pressures.4 1 LG1 LG. ICMP LGD UK ICMP LGD UK 4 LG6 6 4 LG7.4 LGD 4. ICMP India % disease incidence
8 Minor QTLs due to the effects of modifier genes? Minor QTLs due to race-specific genes to pathogen avirulences at low frequency in the pathogen population
9 Generating single zoospore isolates Newly germinated seedlings Inoculate root with droplet containing '1' zoospore Thin layer agar in petri dish Incubate overnight Lift agar with seedlings into pot & cover Look for infected plants after two weeks
10 Nigerian single zoospore isolate-1 4 LG1& 4 LG LG LG5 4 4 LG6 4 4 LG7 4 Nigerian pathogen population Nigerian single zoospore isolate-1
11 Nigeriansinglezosporeisolate- 4 LG1& 4 LG LG LG5 4 LG6 LG7 4 4 Nigeriansingle zosporeisolate-
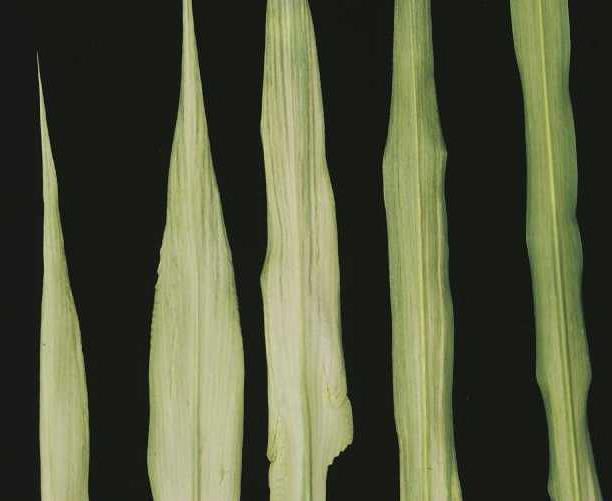

12 Tall/chlorotic Stunted
13 Nigerian single zoospore isolate LG1& 6 4 LG LG4 4 LG5 4 LG6 4 LG % downy mildew % tall / chlorotic % stunted
14 Nigerian single zoospore isolate - Phenotypes of parental genotypes at the QTL 1 LG3 AA (sus par) BB (res par) 8 % DM % DM tall % stunted


15 Greater food security to ~ million people, who grew the previously popular but DM susceptible variety HHB 67

16 University of California Davis

17 Causes the serious potato and tomato disease late blight In potato, race-specific R genes lasts -3 years Breeding programs now concentrate on selecting for general or field resistance Generally quantitative and governed by many genes Resistance found in wild species eg for tomato L. hirsutum (S. habrochaites)


 and")
18 L. hirsutum lines found to be resistant to over 1 isolates; Mike Coffey, UC Riverside L. hirsutum x L. esculentum BC-H F1 BC-E Phenotyped with detached leaf & 4 isolates, whole plants (in growth cabinet) and field screens


19 QTLs were of small effect and environmentally variable Many QTLs mapped to plant architecture traits especially determinacy, flowering, canopy


20 L. esculentum Droplet has not dispersed leaf becomes susceptible L. hirsutum Droplet rapidly disperses leaf is resistant
, 1777-1713 Plant Glandular")

21 Glas et al. Int. J. Mol. Sci. 1, 13(1), Plant Glandular Trichomes as Targets for Breeding or Engineering of Resistance to Herbivores
22


23 QTL colocated or were linked to QTL having negative effects on horticultural traits, such as plant height, plant shape, maturity, yield, and fruit size

24

25

26

27 Travelling Salesman Problem (TSP): a mathematical problem in which one tries to find the shortest route that passes through each of a set of points once and only once.
28 Selected the minimum number of SNPs that could discriminate EVERY inbred in a set 15 SNP markers could discriminate among 4 inbreds Number of Markers Number of Inbreds
29 Standard set of 15 isozymes 16 SNPs selected with TSP At least 1 on each chromosome SNPs had higher level of missing data (%) compared with isozymes (.8%)
30 Average number of matching inbreds Number SNPs missing Number SNPs mis-scored Number Isozymes missing Number Isozymes mis-scored Number of missing scores / Number of mis-scored alleles SNPs maintain power of discriminatory levels in the face of missing data and even mis-scored data


31

32 A variety that is predominantly derived from a first variety while retaining the expression of the essential characteristics of the first variety that has Plant Variety Protection. What are the essential characteristics? Having a marker set can help define thresholds
33 Recommend 37 SNPs as a first step to assessing the likelihood of essential derivation Defined the set of 37 SNPs Recommended distance thresholds of; <91% green no essential derivation 91% orange potential EDV; reversal of burden of proof 95% red definite EDV (UFS) or strong indication (ASTA) of EDV


34 Can markers replace or supplement PVP characteristics?


35 Multiple QTLs, pleiotropic effects of QTLs Too many to manage in a breeding program Genomic selection Gene modelling Hypothesis + tilling/gene editing + ecotilling, gene editing


36 GbS
37 Seq No. of markers High density chip Med density chip Single plex eg KASP No. of samples

38 No. of markers High density chip GbS? Med density chip Single plex eg KASP No. of samples
39 Chips Existing technology costs stabilize/increase Instrumentation outdated/not supported High development costs Ascertainment bias Hard to capture haplotypes GbS Next generation technology costs decrease Limited development costs Limited ascertainment bias Local haplotypes captured
40 Costs New bead systems Higher volumes Library time/ cost Processing costs for data volume and imputation FTO Chips GbS

41 Costs New bead systems High volumes Library time/ cost Processing costs for data volume and imputation FTO Chips GbS
42 European maize Zhao et al. TAG 7
43 Commodity prices - maize Collapse in S. American markets Slowing growth world-wide Pressure to reduce research and production costs
44 < Lower cost High G x E Higher cost No G x E
45
46 No. of markers GbS High density chip Med density chip NGG? Single plex eg KASP No. of samples
47 Targeted sequencing Primers/probes designed to specific sequences Samples are barcoded Mostly amplicon or ligase based Affymetrics, Keygene, DArT, Illumina etc


48 Barcode samples with unique sequence


49 weeks Sampling Coordinated batching of samples Shipping logistics Permits and documentation Data management Automated analysis

50 No. of markers GbS High density chip New computational methods haplotypes/ibd Med density chip Single plex eg KASP No. of samples
51 Simplified Process driven Data management pipelines, decision support systems Improvements in sampling Continuous improvements made through genomic selection, gene modelling, ecotilling and gene editing