At E17.5, the embryos were rinsed in phosphate-buffered saline (PBS) and immersed in
|
|
|
- Everett Johns
- 5 years ago
- Views:
Transcription
1 Supplementary Materials and Methods Barrier function assays At E17.5, the embryos were rinsed in phosphate-buffered saline (PBS) and immersed in acidic X-gal mix (100 mm phosphate buffer at ph4.3, 3 mm K 3 Fe(CN) 6, 3 mm K 4 Fe(CN) 6, 2 mm MgCl 2, 1 mg/ml X-gal), then incubated for 8 hours at 37 in the dark. Quantitative real-time PCR Total RNAs from tissues were extracted using Trizol (Gibco). cdna was generated using the Invitrogen SS II RT kit. Expression of genes indicated in the text was measured by real-time qrt-pcr, and normalized to GAPDH expression levels. Plasmid Construction Site-directed PCR mutagenesis was used to introduce the missense changes S61A, S109A, S127A, T328A and S347A into the YAP sequence. The cdnas for YAP and its serine to alanine (SA) mutant form were cloned into pet-15b (Novagen) to generate recombinant hexahistidine (His6)-tagged YAP and SA proteins, respectively. In-vitro Kinase Assay Immunoprecipitated HA-LATS1/2-WT or -KD were incubated for 30 minutes at 30 with purified His-YAP-WT or His-YAP-SA in kinase buffer (25 mm HEPES ph 7.4, 50 mm NaCl, 5 mm MgCl 2, 5 mm MnCl 2, 5 mm β-glycerophosphate and 1 mm dithiothreitol) supplemented with 10 μm adenosine 5 triphosphate (ATP) and 2 μci [γ- 32 P]ATP. Reaction mixtures were analyzed by SDS-PAGE and autoradiography to detect 32 P-labeled YAP.
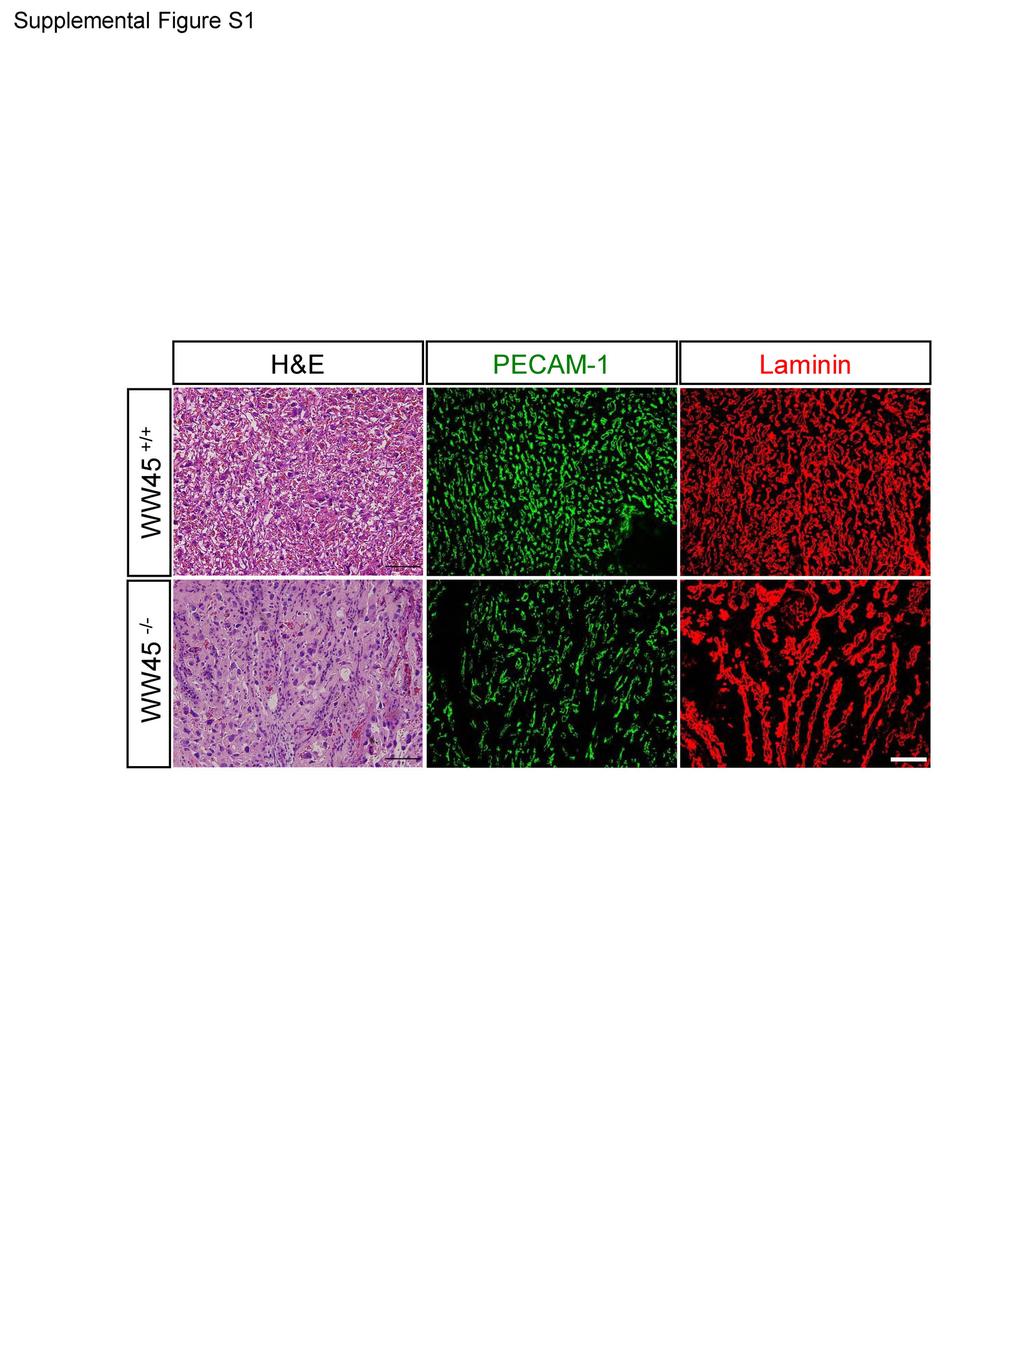
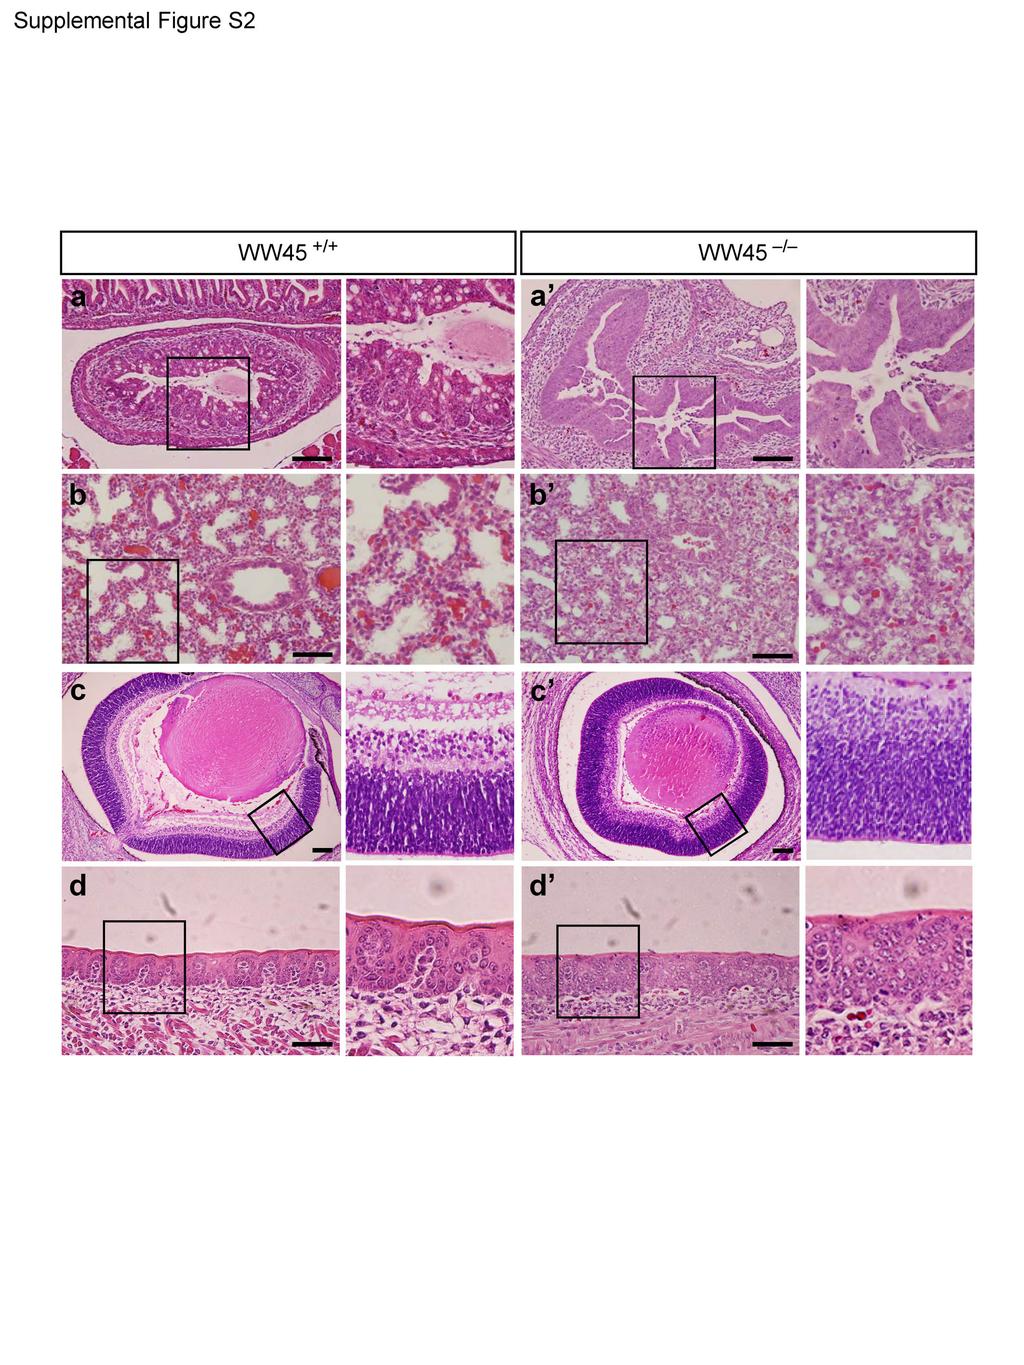
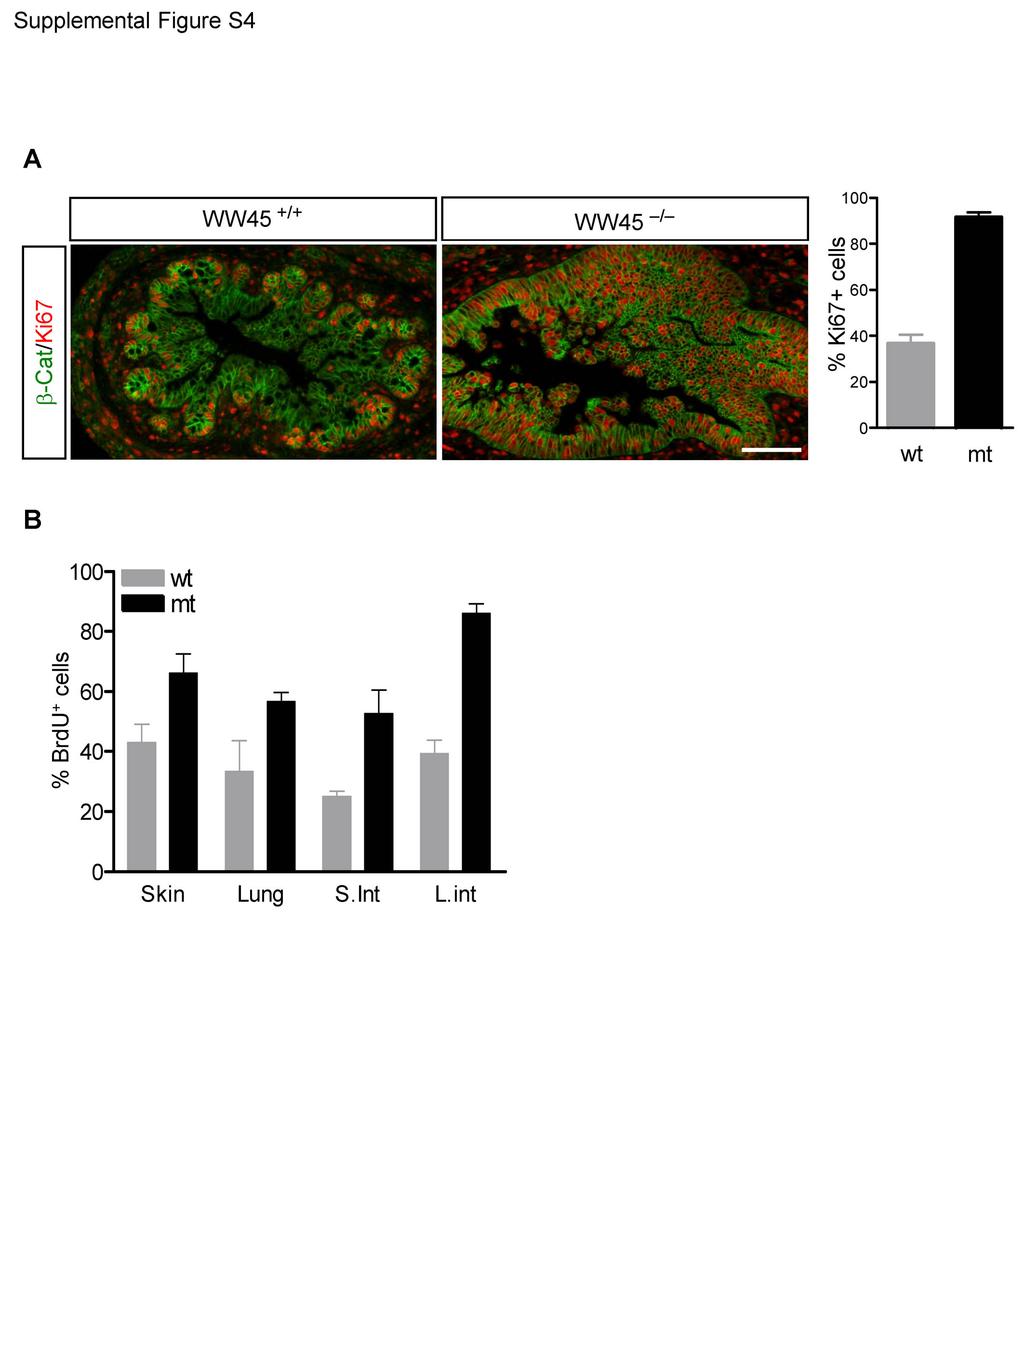
2 Supplementary Table and Figure Legends Supplementary Table1. Genotypes of progeny from WW45 heterozygous intercrosses Supplementary Figure S1. Defective vascularization of WW45 -/- placenta at E17.5. Extra-embryonic vascular defects were confirmed by immunohistochemistry analysis with antibodies against PECAM-1 and laminin. Scale bar: 100 μm. Supplementary Figure S2. Hyperplasia in WW45 -/- epithelial tissues at E17.5. Histological analysis of hematoxylin & eosin (H&E)-stained sections of wild-type (a d) or mutant (a d ) epithelial tissues. (a, a ) Large intestine. (b, b ) Lung. (c, c ) Retina. (d, d ) Tongue. Note the dense and disorganized epithelia in mutant embryos. Scale bar: 100 μm. Supplementary Figure S3. Dysmaturation of skin barrier function in mutant embryo at E17.5. Skin barrier function assay by X-gal staining. Blue-dye incorporation represents disruption to formation of the epidermal barrier in mutant embryos compared with their wild-type littermates. Supplementary Figure S4. Hyperproliferation in WW45 -/- epithelial tissues at E17.5. (A) Evaluation of cellular proliferation in wild-type or mutant colonic epithelium by co-immunohistochemistry analysis with anti-ki67 and anti-β-catenin. Note the increased numbers of Ki67-positive cells, including those located in multiple cell layers, in the mutant epithelium compared with the control epithelium; in the control epithelium, Ki67-positive cells were present mainly in the restricted proliferation zone. Scale bar: 100 μm. (B) Quantitative analysis of the percentage of BrdU-positive cells per 1.0-mm 2 area of epithelium 2 hours after BrdU injection. Data represent triplicate independent experiments ±SD. Supplementary Figure S5. Defective cell-cycle exit in WW45 -/- keratinocytes. (A and B) BrdU-labeling index of keratinocytes cultured with or without transforming growth factor (TGF)-β (A) or LiCl (B). Note the failure to stop cycling in WW45- deficient keratinocytes in response to TGF-β or LiCl treatment. Supplementary Figure S6. Requirement of WW45 for interaction between MST1/2
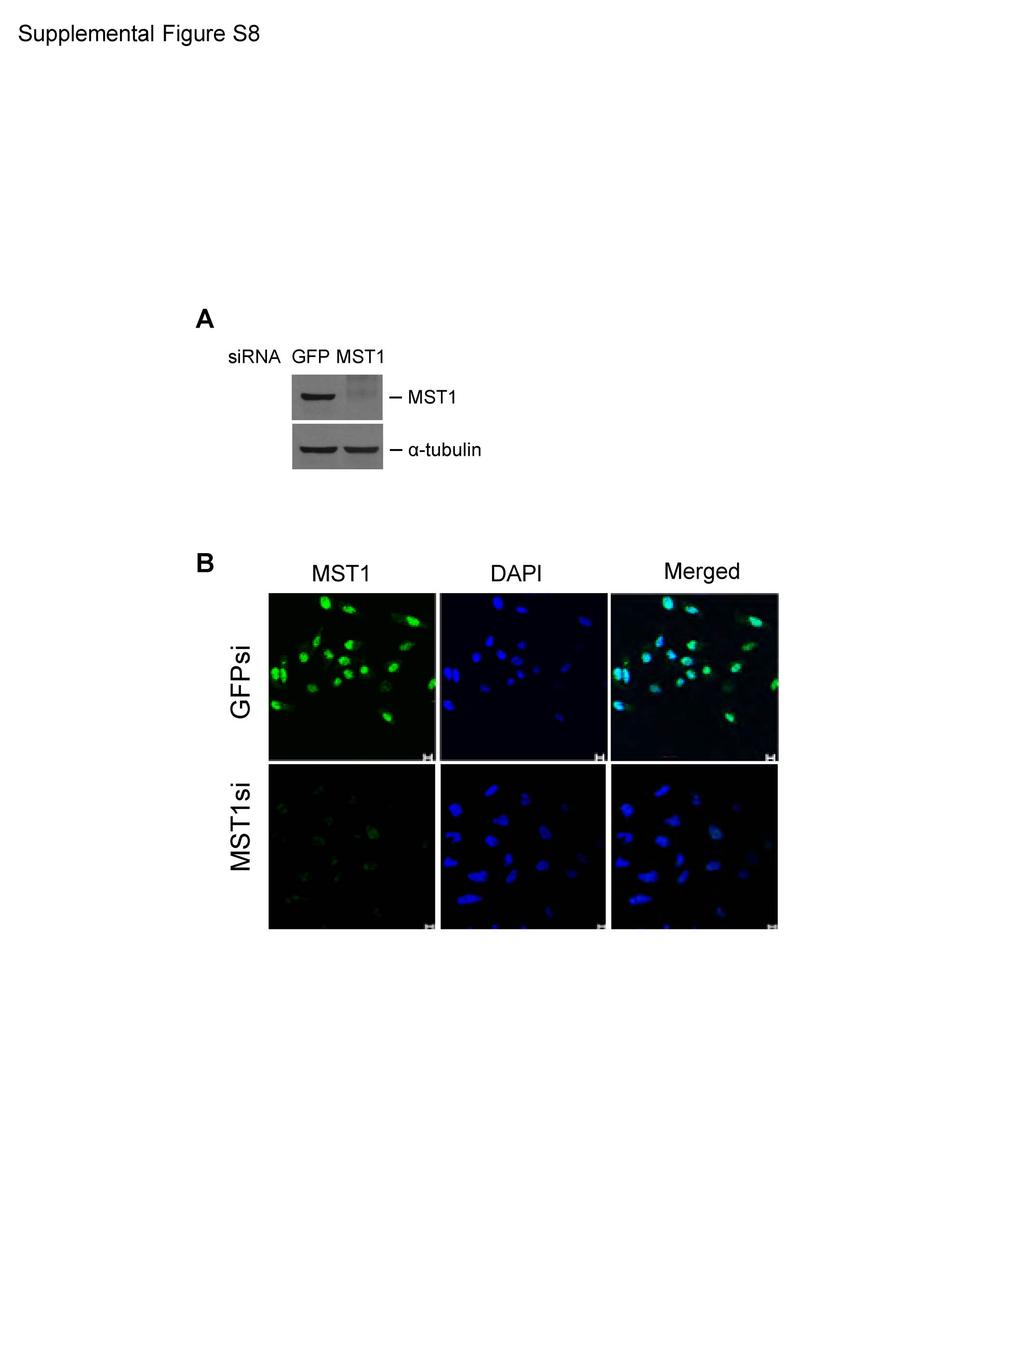
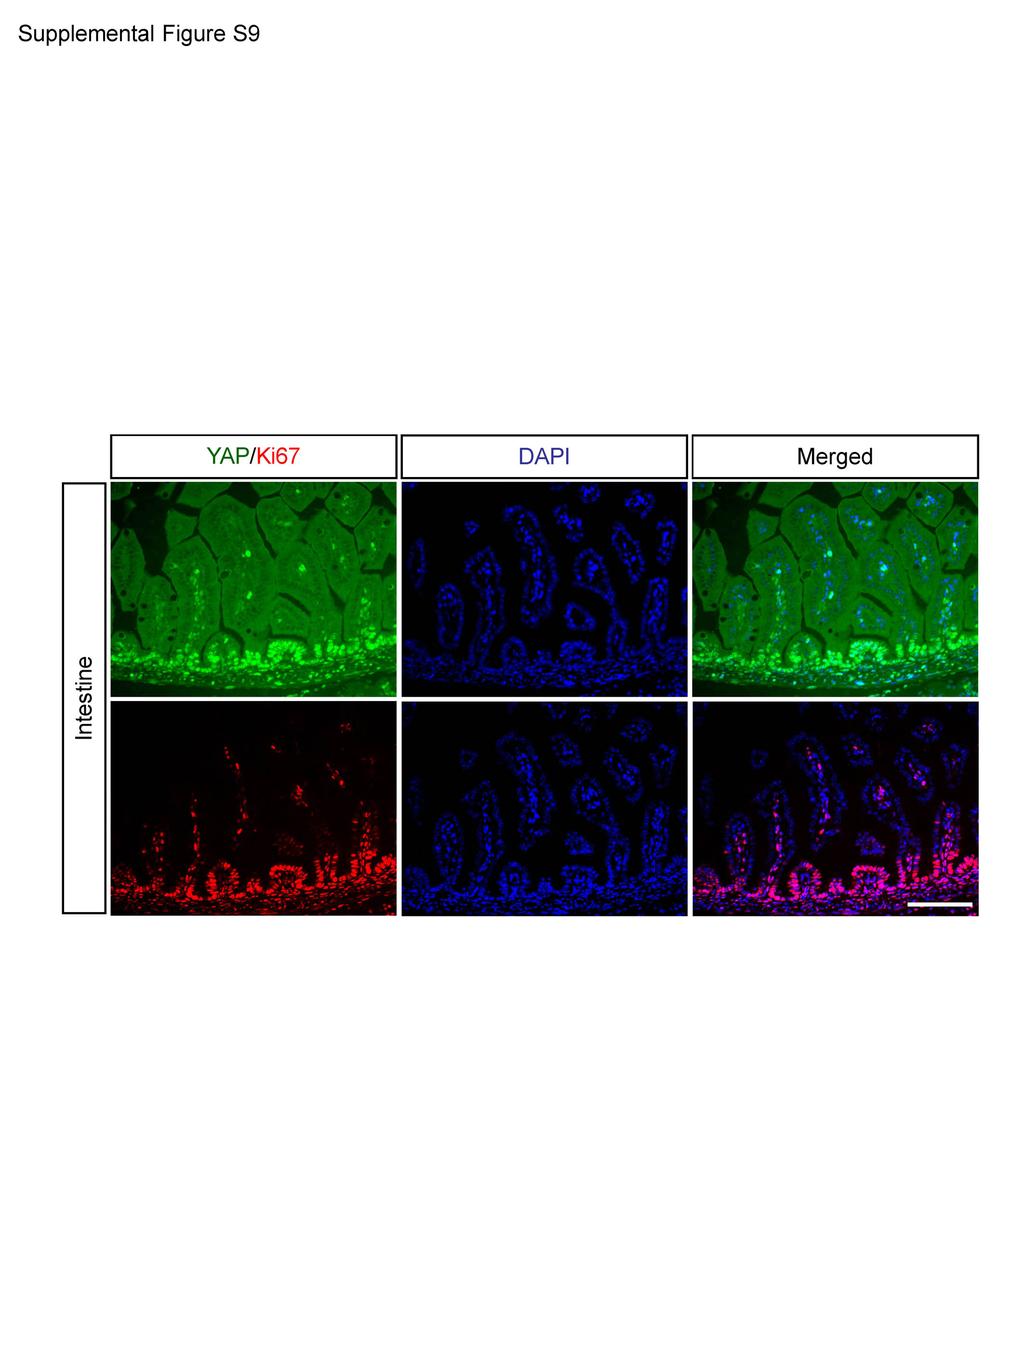
3 and LATS1/2 in primary keratinocytes. Physical associations between MST1, LATS1/2, WW45 and YAP under differentiation conditions. WW45 -/- primary keratinocytes were co-transfected with the plasmids indicated at the top of each panel. After 24 hours of transfection, cells were maintained in Ca 2+ -containing medium for a further 24 hours before harvesting for immunoprecipitation with anti-hemagglutinin (HA). The resulting precipitates were subjected to Western-blot analysis with the indicated antibodies. Note that complex formation was only detected in the presence of WW45. Supplementary Figure S7. Phosphorylation of YAP serine 127 by LATS1/2 in the MST1 pathway is induced by differentiation signals in primary keratinocytes. (A) Partial alignment of the conserved regions of YAP with the Drosophila Yki protein. The consensus motif of the site phosphorylated by LATS1/2 is underlined. Asterisk indicates the YAP serine 127 residue, which is the phosphorylation site for LATS1/2. (B) Identification of the phosphorylation site of YAP. WW45-deficient primary keratinocytes were co-transfected with the indicated plasmids and probed with the indicated antibodies. (C) In-vitro kinase assays using immunoprecipitated HA-tagged LATS1/2 WT or KD and purified His-YAP-WT or His-YAP-SA were performed, and the signals are shown by autoradiography analysis (top two panels). The input kinase and substrate for Western-blot analysis using anti-lats1/2 and anti-yap are also shown (bottom two gels). (D) Western-blot analysis with anti-yap or an antibody specific for the serine-127-phosphorylated YAP (p-yap) in wild-type and mutant primary keratinocytes cultured with or without Ca 2+ for 24 hours. Differentiation of keratinocytes and the presence of WW45 were assessed by Western-blot analysis using anti-filaggrin and anti-ww45. Supplementary Figure S8. Verification of the MST1 antibody. (A) Western-blot analysis was performed with lysates of HeLa cells stably transfected with a vector encoding MST1 sirna or GFP sirna as a control. α-tubulin was used as a loading control. (B) Control- and MST1-siRNA-expressing HeLa cells were stained with DAPI and with MST1 antibody. Supplementary Figure S9. Nuclear localization of YAP in proliferative progenitor compartment of the small intestine. The serial sections of the wild-type embryos were stained with anti-yap and anti Ki67. Note the nuclear-localized YAP in the Ki67- positive cycling cells of the crypt compartment of the small intestine. Scale bar: 100μm.
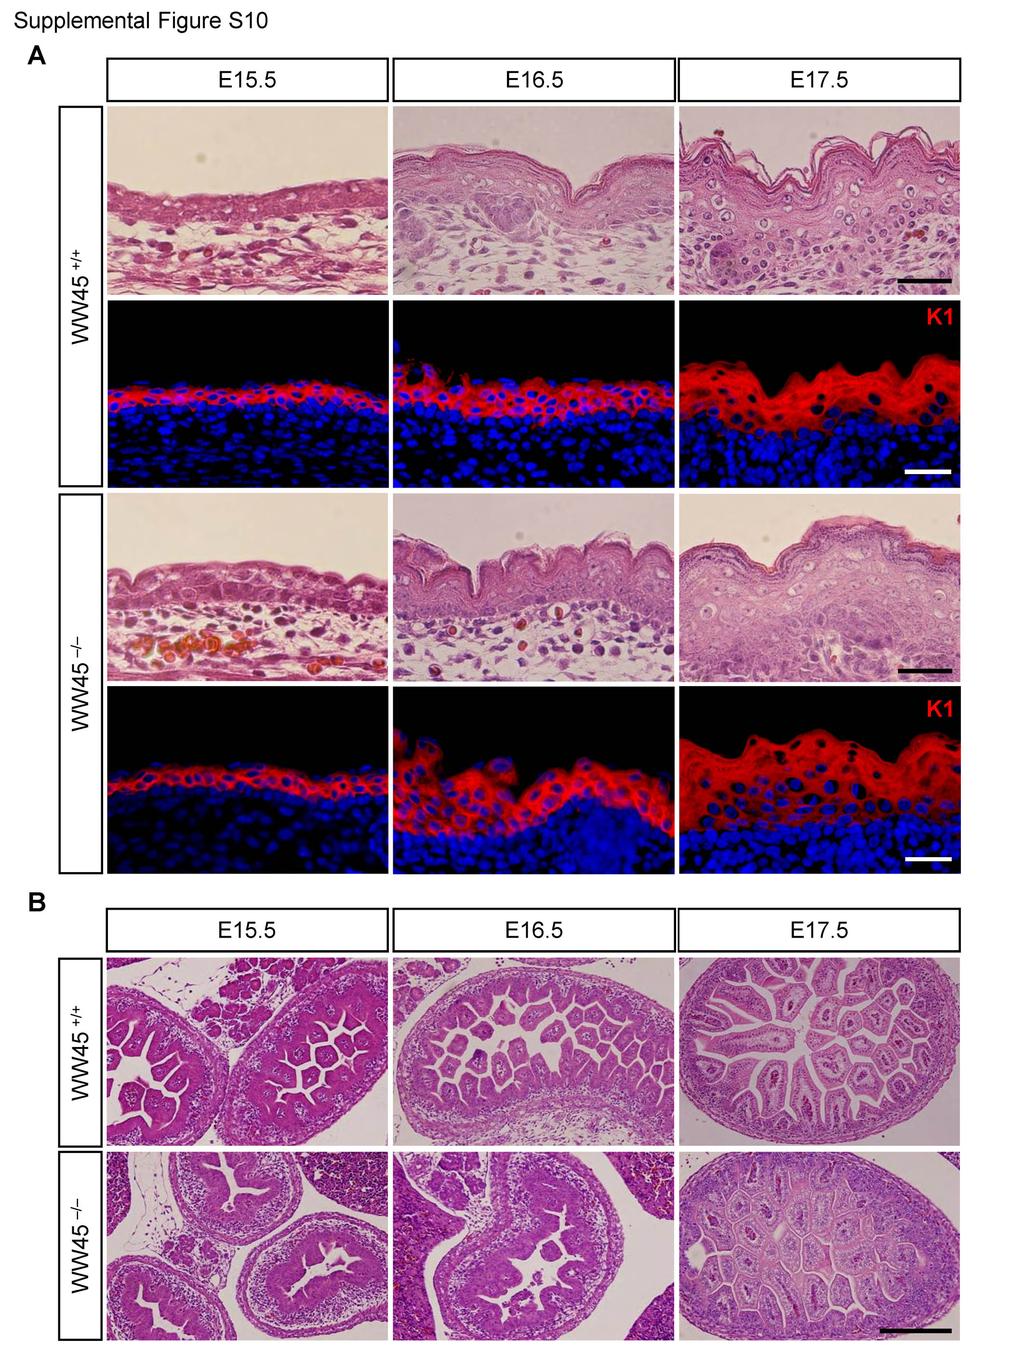
4 Supplementary Figure S10. Expansion of progenitor cells and loss of differentiated cells in WW45 -/- epithelium. (A) Representative H&E and anti-k1 stained sections of epidermis from control and mutant embryos at the indicated developmental stages. Note the expansion of the K1-positive progenitor layers in the developing WW45 -/- epidermis. (B) Representative H&E-stained sections of intestine (B) from control and mutant embryos at the indicated developmental stages. Note the increased cellularity with defective terminal differentiation in the developing WW45 -/- embryos. Scale bar: 100 μm. Supplementary Figure S11. Increased proliferation in WW45 -/- epithelium onset of terminal differentiation. Comparison of the numbers of Ki67-positive cells (average number per 1.0-mm 2 area) in wild-type and mutant epithelia at the indicated developmental stages. Data represent triplicate independent experiments ±SD. Supplementary Figure S12. Quantitative RT-PCR analysis. RNA isolated from wild-type and mutant epidermis was analyzed by quantitative RT-PCR. Data represent triplicate independent experiments ±SD.
5
6
7
8
9
10
11
12
13
14
15
16
17
T H E J O U R N A L O F C E L L B I O L O G Y
 T H E J O U R N A L O F C E L L B I O L O G Y Supplemental material Han et al., http://www.jcb.org/cgi/content/full/jcb.201311007/dc1 Figure S1. SIVA1 interacts with PCNA. (A) HEK293T cells were transiently
Supplementary Table 1. The Q-PCR primer sequence is summarized in the following table.
 Supplementary Table 1. The Q-PCR primer sequence is summarized in the following table. Name Sequence (5-3 ) Application Flag-u ggactacaaggacgacgatgac Shared upstream primer for all the amplifications of
ASPP1 Fw GGTTGGGAATCCACGTGTTG ASPP1 Rv GCCATATCTTGGAGCTCTGAGAG
 Supplemental Materials and Methods Plasmids: the following plasmids were used in the supplementary data: pwzl-myc- Lats2 (Aylon et al, 2006), pretrosuper-vector and pretrosuper-shp53 (generous gift of
T H E J O U R N A L O F C E L L B I O L O G Y
 T H E J O U R N A L O F C E L L B I O L O G Y Supplemental material Nakajima and Tanoue, http://www.jcb.org/cgi/content/full/jcb.201104118/dc1 Figure S1. DLD-1 cells exhibit the characteristic morphology
SUPPLEMENTARY INFORMATION
 (Supplementary Methods and Materials) GST pull-down assay GST-fusion proteins Fe65 365-533, and Fe65 538-700 were expressed in BL21 bacterial cells and purified with glutathione-agarose beads (Sigma).
Supplementary Figure 1. Localization of MST1 in RPE cells. Proliferating or ciliated HA- MST1 expressing RPE cells (see Fig. 5b for establishment of
 Supplementary Figure 1. Localization of MST1 in RPE cells. Proliferating or ciliated HA- MST1 expressing RPE cells (see Fig. 5b for establishment of the cell line) were immunostained for HA, acetylated
monoclonal antibody. (a) The specificity of the anti-rhbdd1 monoclonal antibody was examined in
 The specificity of the anti-rhbdd1 monoclonal antibody was examined in") Supplementary information Supplementary figures Supplementary Figure 1 Determination of the s pecificity of in-house anti-rhbdd1 mouse monoclonal antibody. (a) The specificity of the anti-rhbdd1 monoclonal
Supplementary information Supplementary figures Supplementary Figure 1 Determination of the s pecificity of in-house anti-rhbdd1 mouse monoclonal antibody. (a) The specificity of the anti-rhbdd1 monoclonal
Supplemental Figure 1 (Figure S1), related to Figure 1 Figure S1 provides evidence to demonstrate Nfatc1Cre is a mouse line that directed gene
, related to Figure 1 Figure S1 provides evidence to demonstrate Nfatc1Cre is a mouse line that directed gene") Developmental Cell, Volume 25 Supplemental Information Brg1 Governs a Positive Feedback Circuit in the Hair Follicle for Tissue Regeneration and Repair Yiqin Xiong, Wei Li, Ching Shang, Richard M. Chen,
Developmental Cell, Volume 25 Supplemental Information Brg1 Governs a Positive Feedback Circuit in the Hair Follicle for Tissue Regeneration and Repair Yiqin Xiong, Wei Li, Ching Shang, Richard M. Chen,
Toll Receptor-Mediated Hippo Signaling Controls Innate Immunity in Drosophila
 Cell Supplemental Information Toll Receptor-Mediated Hippo Signaling Controls Innate Immunity in Drosophila Bo Liu, Yonggang Zheng, Feng Yin, Jianzhong Yu, Neal Silverman, and Duojia Pan Supplemental Experimental
supplementary information
 DOI: 10.1038/ncb2116 Figure S1 CDK phosphorylation of EZH2 in cells. (a) Comparison of candidate CDK phosphorylation sites on EZH2 with known CDK substrates by multiple sequence alignments. (b) CDK1 and
Supplementary Figure 1. α-synuclein is truncated in PD and LBD brains. Nature Structural & Molecular Biology: doi: /nsmb.
 Supplementary Figure 1 α-synuclein is truncated in PD and LBD brains. (a) Specificity of anti-n103 antibody. Anti-N103 antibody was coated on an ELISA plate and different concentrations of full-length
SUPPLEMENTARY INFORMATION
 DOI: 10.1038/ncb3164 Supplementary Figure 1 Validation of effective Gnas deletion and epithelial thickness. a, Representative genotyping in mice treated or not with tamoxifen to show Gnas deletion. To
Sarker et al. Supplementary Material. Subcellular Fractionation
 Supplementary Material Subcellular Fractionation Transfected 293T cells were harvested with phosphate buffered saline (PBS) and centrifuged at 2000 rpm (500g) for 3 min. The pellet was washed, re-centrifuged
Coleman et al., Supplementary Figure 1
 Coleman et al., Supplementary Figure 1 BrdU Merge G1 Early S Mid S Supplementary Figure 1. Sequential destruction of CRL4 Cdt2 targets during the G1/S transition. HCT116 cells were synchronized by sequential
Regulation of transcription by the MLL2 complex and MLL complex-associated AKAP95
 Supplementary Information Regulation of transcription by the complex and MLL complex-associated Hao Jiang, Xiangdong Lu, Miho Shimada, Yali Dou, Zhanyun Tang, and Robert G. Roeder Input HeLa NE IP lot:
SUPPLEMENTARY INFORMATION
 SUPPLEMENTARY INFORMATION Dynamic Phosphorylation of HP1 Regulates Mitotic Progression in Human Cells Supplementary Figures Supplementary Figure 1. NDR1 interacts with HP1. (a) Immunoprecipitation using
Figure S1. Verification of ihog Mutation by Protein Immunoblotting Figure S2. Verification of ihog and boi
 Figure S1. Verification of ihog Mutation by Protein Immunoblotting Extracts from S2R+ cells, embryos, and adults were analyzed by immunoprecipitation and immunoblotting with anti-ihog antibody. The Ihog
Supplementary methods Shoc2 In Vitro Ubiquitination Assay
 Supplementary methods Shoc2 In Vitro Ubiquitination Assay 35 S-labelled Shoc2 was prepared using a TNT quick Coupled transcription/ translation System (Promega) as recommended by manufacturer. For the
Supplemental material
 Supplemental material THE JOURNAL OF CELL BIOLOGY Gillespie et al., http://www.jcb.org/cgi/content/full/jcb.200907037/dc1 repressor complex induced by p38- Gillespie et al. Figure S1. Reduced fiber size
Figure S1. Sequence alignments of ATRIP and ATR TopBP1 interacting regions.
 A H. sapiens 204 TKLQTS--ERANKLAAPSVSH VSPRKNPSVVIKPEACS-PQFGKTSFPTKESFSANMS LP 259 B. taurus 201 TKLQSS--ERANKLAVPTVSH VSPRKSPSVVIKPEACS-PQFGKPSFPTKESFSANKS LP 257 M. musculus 204 TKSQSN--GRTNKPAAPSVSH
Gene Forward (5 to 3 ) Reverse (5 to 3 ) Accession # PKA C- TCTGAGGAAATGGGAGAACC CGAGGGTTTTCTTCCTCTCAA NM_011100
 Reverse (5 to 3 ) Accession # PKA C- TCTGAGGAAATGGGAGAACC CGAGGGTTTTCTTCCTCTCAA NM_011100") Supplementary Methods: Materials. BRL37344, insulin, 3-isobutyl-1-methylxanthine, dibutyryl camp (Bt2-cAMP) and 8-Bromoadenosine 3,5 -cyclic monophosphate sodium (8-br-cAMP), cilostamide, adenosine deaminase,
Supplementary Methods: Materials. BRL37344, insulin, 3-isobutyl-1-methylxanthine, dibutyryl camp (Bt2-cAMP) and 8-Bromoadenosine 3,5 -cyclic monophosphate sodium (8-br-cAMP), cilostamide, adenosine deaminase,
Figure 1: TDP-43 is subject to lysine acetylation within the RNA-binding domain a) QBI-293 cells were transfected with TDP-43 in the presence or
 QBI-293 cells were transfected with TDP-43 in the presence or") Figure 1: TDP-43 is subject to lysine acetylation within the RNA-binding domain a) QBI-293 cells were transfected with TDP-43 in the presence or absence of the acetyltransferase CBP and acetylated TDP-43
Figure 1: TDP-43 is subject to lysine acetylation within the RNA-binding domain a) QBI-293 cells were transfected with TDP-43 in the presence or absence of the acetyltransferase CBP and acetylated TDP-43
 Supplemental Table 1. The progeny of crosses between MPK4/mpk4-2 and ANQ/anq-2. Genotype Number Number Number observed expected-1 expected-2 (1) MPK4/MPK4 ANQ/ANQ 32 12 21 (2) MPK4/MPK4 ANQ/anq-2 28 25
Figure S1. Figure S2. Figure S3 HB Anti-FSP27 (COOH-terminal peptide) Ab. Anti-GST-FSP27(45-127) Ab.
 Ab. Anti-GST-FSP27(45-127) Ab.") / 36B4 mrna ratio Figure S1 * 2. 1.6 1.2.8 *.4 control TNFα BRL49653 Figure S2 Su bw AT p iw Anti- (COOH-terminal peptide) Ab Blot : Anti-GST-(45-127) Ab β-actin Figure S3 HB2 HW AT BA T Figure S4 A TAG
/ 36B4 mrna ratio Figure S1 * 2. 1.6 1.2.8 *.4 control TNFα BRL49653 Figure S2 Su bw AT p iw Anti- (COOH-terminal peptide) Ab Blot : Anti-GST-(45-127) Ab β-actin Figure S3 HB2 HW AT BA T Figure S4 A TAG
Supplementary Information: Materials and Methods. Immunoblot and immunoprecipitation. Cells were washed in phosphate buffered
 Supplementary Information: Materials and Methods Immunoblot and immunoprecipitation. Cells were washed in phosphate buffered saline (PBS) and lysed in TNN lysis buffer (50mM Tris at ph 8.0, 120mM NaCl
SUPPLEMENTARY INFORMATION
 SUPPLEMENTARY INFORMATION SUPPLEMENTARY MATERIALS AND METHODS Antibodies and sirna The antibodies against BAF170, BAF155, BAF60a, BAF57 and BAF53 were purchased from Santa Cruz (TX), and the antibodies
HPV E6 oncoprotein targets histone methyltransferases for modulating specific. Chih-Hung Hsu, Kai-Lin Peng, Hua-Ci Jhang, Chia-Hui Lin, Shwu-Yuan Wu,
 1 HPV E oncoprotein targets histone methyltransferases for modulating specific gene transcription 3 5 Chih-Hung Hsu, Kai-Lin Peng, Hua-Ci Jhang, Chia-Hui Lin, Shwu-Yuan Wu, Cheng-Ming Chiang, Sheng-Chung
SUPPLEMENTARY INFORMATION
 DOI:.38/ncb327 a b Sequence coverage (%) 4 3 2 IP: -GFP isoform IP: GFP IP: -GFP IP: GFP Sequence coverage (%) 4 3 2 IP: -GFP IP: GFP 33 52 58 isoform 2 33 49 47 IP: Control IP: Peptide Sequence Start
indicated numbers of pups at day of life (DOL) 10, or embryonic day (ED) B. Male mice of
 10, or embryonic day (ED) B. Male mice of") SUPPLEMENTRY FIGURE LEGENDS Figure S1. USP44 loss leads to chromosome missegregation.. Genotypes obtained from the indicated numbers of pups at day of life (DOL) 10, or embryonic day (ED) 13.5.. Male mice
SUPPLEMENTRY FIGURE LEGENDS Figure S1. USP44 loss leads to chromosome missegregation.. Genotypes obtained from the indicated numbers of pups at day of life (DOL) 10, or embryonic day (ED) 13.5.. Male mice
Post-translational modification
 Protein expression Western blotting, is a widely used and accepted technique to detect levels of protein expression in a cell or tissue extract. This technique measures protein levels in a biological sample
Supplementary Information: Materials and Methods. GST and GST-p53 were purified according to standard protocol after
 Supplementary Information: Materials and Methods Recombinant protein expression and in vitro kinase assay. GST and GST-p53 were purified according to standard protocol after induction with.5mm IPTG for
Gene Forward Primer Reverse Primer GAPDH ATCATCCCTGCCTCTACTGG GTCAGGTCCACCACTGACAC SSB1 AACTTCAGTGAGCCAAACCC GTTCTCAGAGGCTGGAGAGG
 Supplemental Data EXPERIMENTAL PROCEDURES Plasmids and Antibodies- Full length cdna of INT11 or INT12 were cloned into ps- Flag-SBP vector respectively. Anti-RNA pol II (RPB1) was purchased from Santa
RNA oligonucleotides and 2 -O-methylated oligonucleotides were synthesized by. 5 AGACACAAACACCAUUGUCACACUCCACAGC; Rand-2 OMe,
 Materials and methods Oligonucleotides and DNA constructs RNA oligonucleotides and 2 -O-methylated oligonucleotides were synthesized by Dharmacon Inc. (Lafayette, CO). The sequences were: 122-2 OMe, 5
Supplementary Materials
 Supplementary Materials Supplementary Figure 1. PKM2 interacts with MLC2 in cytokinesis. a, U87, U87/EGFRvIII, and HeLa cells in cytokinesis were immunostained with DAPI and an anti-pkm2 antibody. Thirty
SUPPLEMENTARY INFORMATION FIGURE LEGENDS
 SUPPLEMENTARY INFORMATION FIGURE LEGENDS Fig. S1. Radiation-induced phosphorylation of Rad50 at a specific site. A. Rad50 is an in vitro substrate for ATM. A series of Rad50-GSTs covering the entire molecule
transcription and the promoter occupancy of Smad proteins. (A) HepG2 cells were co-transfected with the wwp-luc reporter, and FLAG-tagged FHL1,
 HepG2 cells were co-transfected with the wwp-luc reporter, and FLAG-tagged FHL1,") Supplementary Data Supplementary Figure Legends Supplementary Figure 1 FHL-mediated TGFβ-responsive reporter transcription and the promoter occupancy of Smad proteins. (A) HepG2 cells were co-transfected
Supplementary Data Supplementary Figure Legends Supplementary Figure 1 FHL-mediated TGFβ-responsive reporter transcription and the promoter occupancy of Smad proteins. (A) HepG2 cells were co-transfected
Recombinant adenoviruses. A TRB3-expressing adenovirus was generated through
 Materials and Methods Recombinant adenoviruses. A -expressing adenovirus was generated through homologous recombination between a linearized transfer vector pad-track and the adenoviral backbone vector
SUPPLEMENTARY INFORMATION
 DOI: 10.1038/ncb3363 Supplementary Figure 1 Several WNTs bind to the extracellular domains of PKD1. (a) HEK293T cells were co-transfected with indicated plasmids. Flag-tagged proteins were immunoprecipiated
A) B) Ladder. Supplementary Figure 1. Recombinant calpain 14 purification analysis. A) The general domain structure of classical
 B) Ladder. Supplementary Figure 1. Recombinant calpain 14 purification analysis. A) The general domain structure of classical") A) B) Ladder C) r4 r4 Nt- -Ct 78 kda Supplementary Figure 1. Recombinant calpain 14 purification analysis. A) The general domain structure of classical calpains is shown. The protease core consists of
A) B) Ladder C) r4 r4 Nt- -Ct 78 kda Supplementary Figure 1. Recombinant calpain 14 purification analysis. A) The general domain structure of classical calpains is shown. The protease core consists of
Supplementary
 Supplementary information Supplementary Material and Methods Plasmid construction The transposable element vectors for inducible expression of RFP-FUS wt and EGFP-FUS R521C and EGFP-FUS P525L were derived
Supplementary Methods
 Supplementary Methods Reverse transcribed Quantitative PCR. Total RNA was isolated from bone marrow derived macrophages using RNeasy Mini Kit (Qiagen), DNase-treated (Promega RQ1), and reverse transcribed
Supplementary Figure 1. The Hsp70 acetylation level is related to the co-chaperone binding of Hsp70 under various stress conditions.
 Supplementary Figure 1. The Hsp70 acetylation level is related to the co-chaperone binding of Hsp70 under various stress conditions. 1 (a) Etoposide treatment gradually changes acetylation level and co-chaperone
Nature Medicine doi: /nm.2548
 Supplementary Table 1: Genotypes of offspring and embryos from matings of Pmm2 WT/F118L mice with Pmm2 WT/R137H mice total events Pmm2 WT/WT Pmm2 WT/R137H Pmm2 WT/F118L Pmm2 R137H/F118L offspring 117 (100%)
(a) Immunoblotting to show the migration position of Flag-tagged MAVS
 Immunoblotting to show the migration position of Flag-tagged MAVS") Supplementary Figure 1 Characterization of six MAVS isoforms. (a) Immunoblotting to show the migration position of Flag-tagged MAVS isoforms. HEK293T Mavs -/- cells were transfected with constructs expressing
Supplementary Figure 1 Characterization of six MAVS isoforms. (a) Immunoblotting to show the migration position of Flag-tagged MAVS isoforms. HEK293T Mavs -/- cells were transfected with constructs expressing
Supplementary Information Alternative splicing of CD44 mrna by ESRP1 enhances lung colonization of metastatic cancer cell
 Supplementary Information Alternative splicing of CD44 mrna by ESRP1 enhances lung colonization of metastatic cancer cell Supplementary Figures S1-S3 Supplementary Methods Supplementary Figure S1. Identification
Supplementary Fig. 1 related to Fig. 1 Clinical relevance of lncrna candidate
 Supplementary Figure Legends Supplementary Fig. 1 related to Fig. 1 Clinical relevance of lncrna candidate BC041951 in gastric cancer. (A) The flow chart for selected candidate lncrnas in 660 up-regulated
pt7ht vector and over-expressed in E. coli as inclusion bodies. Cells were lysed in 6 M
 Supplementary Methods MIG6 production, purification, inhibition, and kinase assays MIG6 segment 1 (30mer, residues 334 364) peptide was synthesized using standard solid-phase peptide synthesis as described
Supplementary information Activation of AMP-activated protein kinase
 Supplementary information Activation of AMP-activated protein kinase 2 by nicotine instigates formation of abdominal aortic aneurysms in mice in vivo Shuangxi Wang 1,2,5, Cheng Zhang 1,2,5, Miao Zhang
Aspergillus fumigatus CalA binds to integrin α 5 β 1 and mediates host cell invasion
 In the format provided by the authors and unedited. SUPPLEMENTARY INFORMATION ARTICLE NUMBER: 16211 DOI: 10.1038/NMICROBIOL.2016.211 Aspergillus fumigatus CalA binds to integrin α 5 β 1 and mediates host
Supplemental Information: Phosphorylation of CLIP-170 by Both Plk1 and CK2 Is Involved in the Timely Formation of Kinetochore-microtubule Attachments
 Supplemental Information: Phosphorylation of CLIP-170 by Both Plk1 and CK2 Is Involved in the Timely Formation of Kinetochore-microtubule Attachments Hongchang Li, X. Shawn Liu, Xiaoming Yang, Yingmin
Supplemental Figure Legends:
 Supplemental Figure Legends: Fig S1. GFP-ABRO1 localization. U2OS cells were infected with retrovirus expressing GFP- ABRO1. The cells were fixed with 3.6% formaldehyde and stained with antibodies against
Supplemental Information
 Supplemental Information Intrinsic protein-protein interaction mediated and chaperonin assisted sequential assembly of a stable Bardet Biedl syndome protein complex, the BBSome * Qihong Zhang 1#, Dahai
Supplementary data. sienigma. F-Enigma F-EnigmaSM. a-p53
 Supplementary data Supplemental Figure 1 A sienigma #2 sienigma sicontrol a-enigma - + ++ - - - - - - + ++ - - - - - - ++ B sienigma F-Enigma F-EnigmaSM a-flag HLK3 cells - - - + ++ + ++ - + - + + - -
Supplemental Fig. 1: PEA-15 knockdown efficiency assessed by immunohistochemistry and qpcr
 Supplemental figure legends Supplemental Fig. 1: PEA-15 knockdown efficiency assessed by immunohistochemistry and qpcr A, LβT2 cells were transfected with either scrambled or PEA-15 sirna. Cells were then
Supplemental Materials
 Supplemental Materials Flores-Pérez et al., Supplemental Materials, page 1 of 5 Supplemental Figure S1. Pull-down and BiFC controls, and quantitative analyses associated with the BiFC studies. (A) Controls
Supplementary Table 1. Primers used to construct full-length or various truncated mutants of ISG12b2.
 Supplementary Table 1. Primers used to construct full-length or various truncated mutants of ISG12b2. Construct name ISG12b2 (No tag) HA-ISG12b2 (N-HA) ISG12b2-HA (C-HA; FL-HA) 94-283-HA (FL-GFP) 93-GFP
Supplementary Fig. 1. Schematic structure of TRAIP and RAP80. The prey line below TRAIP indicates bait and the two lines above RAP80 highlight the
 Supplementary Fig. 1. Schematic structure of TRAIP and RAP80. The prey line below TRAIP indicates bait and the two lines above RAP80 highlight the prey clones identified in the yeast two hybrid screen.
We performed RT-PCR, cloning, sequencing and qrt-pcr in murine melanoma. cell lines and melanocytic tumors from RET-mice in accordance with the method
 Supplementary Material and Methods Quantitative RT-PCR (qrt-pcr) We performed RT-PCR, cloning, sequencing and qrt-pcr in murine melanoma cell lines and melanocytic tumors from RET-mice in accordance with
Supplementary Figure 1 Phosphorylated tau accumulates in Nrf2 (-/-) mice. Hippocampal tissues obtained from Nrf2 (-/-) (10 months old, 4 male; 2
 mice. Hippocampal tissues obtained from Nrf2 (-/-) (10 months old, 4 male; 2") Supplementary Figure 1 Phosphorylated tau accumulates in Nrf2 (-/-) mice. Hippocampal tissues obtained from Nrf2 (-/-) (10 months old, 4 male; 2 female) or wild-type (5 months old, 1 male; 11 months old,
Supplementary Figure 1 Phosphorylated tau accumulates in Nrf2 (-/-) mice. Hippocampal tissues obtained from Nrf2 (-/-) (10 months old, 4 male; 2 female) or wild-type (5 months old, 1 male; 11 months old,
SUPPLEMENTARY INFORMATION
 doi:10.1038/nature09732 Supplementary Figure 1: Depletion of Fbw7 results in elevated Mcl-1 abundance. a, Total thymocytes from 8-wk-old Lck-Cre/Fbw7 +/fl (Control) or Lck-Cre/Fbw7 fl/fl (Fbw7 KO) mice
SUPPLEMENTAL FIGURES AND TABLES
 SUPPLEMENTAL FIGURES AND TABLES A B Flag-ALDH1A1 IP: α-ac HEK293T WT 91R 128R 252Q 367R 41/ 419R 435R 495R 412R C Flag-ALDH1A1 NAM IP: HEK293T + + - + D NAM - + + E Relative ALDH1A1 activity 1..8.6.4.2
Supplementary material for: Materials and Methods:
 Supplementary material for: Iron-responsive degradation of iron regulatory protein 1 does not require the Fe-S cluster: S.L. Clarke, et al. Materials and Methods: Fe-S Cluster Reconstitution: Cells treated
Supplementary Figure S1. N-terminal fragments of LRRK1 bind to Grb2.
 Myc- HA-Grb2 Mr(K) 105 IP HA 75 25 105 1-1163 1-595 - + - + - + 1164-1989 Blot Myc HA total lysate 75 25 Myc HA Supplementary Figure S1. N-terminal fragments of bind to Grb2. COS7 cells were cotransfected
Supplementary Table, Figures and Videos
 Supplementary Table, Figures and Videos Table S1. Oligonucleotides used for different approaches. (A) RT-qPCR study. (B) qpcr study after ChIP assay. (C) Probes used for EMSA. Figure S1. Notch activation
Supplementary information
 Supplementary information The E3 ligase RNF8 regulates KU80 removal and NHEJ repair Lin Feng 1, Junjie Chen 1 1 Department of Experimental Radiation Oncology, The University of Texas M. D. Anderson Cancer
SUPPLEMENTAL MATERIAL. Supplemental Methods. Cumate solution was from System Biosciences. Human complement C1q and complement
 SUPPLEMENTAL MATERIAL Supplemental Methods Reagents Cumate solution was from System Biosciences. Human complement Cq and complement C-esterase inhibitor (C-INH) were from Calbiochem. C-INH (Berinert) for
SUPPLEMENTARY INFORMATION
 DOI: 10.1038/ncb3562 In the format provided by the authors and unedited. Supplementary Figure 1 Glucose deficiency induced FH-ATF2 interaction. In b-m, immunoblotting or immunoprecipitation analyses were
Supporting Online Material for
 www.sciencemag.org/cgi/content/full/1154040/dc1 Supporting Online Material for Selective Blockade of MicroRNA Processing by Lin-28 Srinivas R. Viswanathan, George Q. Daley,* Richard I. Gregory* *To whom
SUPPLEMENTARY INFORMATION
 DOI: 10.1038/ncb2271 Supplementary Figure a! WM266.4 mock WM266.4 #7 sirna WM266.4 #10 sirna SKMEL28 mock SKMEL28 #7 sirna SKMEL28 #10 sirna WM1361 mock WM1361 #7 sirna WM1361 #10 sirna 9 WM266. WM136
Hossain_Supplemental Figure 1
 Hossain_Supplemental Figure 1 GFP-PACT GFP-PACT Motif I GFP-PACT Motif II A. MG132 (1µM) GFP Tubulin GFP-PACT Pericentrin GFP-PACT GFP-PACT Pericentrin Fig. S1. Expression and localization of Orc1 PACT
Supplementary Figure 1 a
 3 min PMA 45 min PMA AnnexinV-FITC Supplementary Figure 1 5 min PMA 15 min PMA a 9 min PMA 12 min PMA 5 min FGF7 15 min FGF7 3 min FGF7 6 min FGF7 9 min FGF7 12 min FGF7 5 min control 3 min control 6 min
Primers used for PCR of conductin, SGK1 and GAPDH have been described in (Dehner et al,
 Supplementary METHODS Flow Cytometry (FACS) For FACS analysis, trypsinized cells were fixed in ethanol, rehydrated in PBS and treated with 40μg/ml propidium iodide and 10μ/ml RNase for 30 min at room temperature.
SUPPLEMENTARY INFORMATION
 DOI: 10.1038/ncb2743 Figure S1 stabilizes cellular protein level, post-transcriptionally. (a, b) and DDR1 were RNAi-depleted from HEK.293.-CBG cells. Western blots with indicated antibodies (a). RT-PCRs
SUPPLEMENTARY INFORMATION
 DOI: 10.1038/ncb3240 Supplementary Figure 1 GBM cell lines display similar levels of p100 to p52 processing but respond differentially to TWEAK-induced TERT expression according to TERT promoter mutation
Fig. S1. Effect of p120-catenin overexpression on the interaction of SCUBE2 with E-cadherin. The expression plasmid encoding FLAG.
 Fig. S1. Effect of p120-catenin overexpression on the interaction of SCUBE2 with E-cadherin. The expression plasmid encoding FLAG.SCUBE2, E-cadherin.Myc, or HA.p120-catenin was transfected in a combination
Supplemental Data YAP1 Increases Organ Size and Expands Undifferentiated Progenitor Cells
 Supplemental Data YAP1 Increases Organ Size and Expands Undifferentiated Progenitor Cells S1 Fernando D. Camargo, Sumita Gokhale, Jonathan B. Johnnidis, Dongdong Fu, George W. Bell, Rudolf Jaenisch, and
SUPPLEMENTARY INFORMATION
 doi: 10.1038/nature06721 SUPPLEMENTARY INFORMATION. Supplemental Figure Legends Supplemental Figure 1 The distribution of hatx-1[82q] in Cos7 cells. Cos7 cells are co-transfected with hatx-1[82q]-gfp (green)
A RRM1 H2AX DAPI. RRM1 H2AX DAPI Merge. Cont. sirna RRM1
 A H2AX DAPI H2AX DAPI Merge Cont sirna Figure S1: Accumulation of RRM1 at DNA damage sites (A) HeLa cells were subjected to in situ detergent extraction without IR irradiation, and immunostained with the
Supplementary methods
 Supplementary methods Cell culture, infection, transfection, and RNA interference HEK293 cells and its derivatives were grown in DMEM supplemented with 10% FBS. Various constructs were introduced into
Supplementary Materials for
 www.sciencesignaling.org/cgi/content/full/8/404/ra120/dc1 Supplementary Materials for The subcellular localization and activity of cortactin is regulated by acetylation and interaction with Keap1 Akihiro
Supplemental Figure legends Figure S1. (A) (B) (C) (D) Figure S2. Figure S3. (A-E) Figure S4. Figure S5. (A, C, E, G, I) (B, D, F, H, Figure S6.
 (B) (C) (D) Figure S2. Figure S3. (A-E) Figure S4. Figure S5. (A, C, E, G, I) (B, D, F, H, Figure S6.") Supplemental Figure legends Figure S1. Map-based cloning and complementation testing for ZOP1. (A) ZOP1 was mapped to a ~273-kb interval on Chromosome 1. In the interval, a single-nucleotide G to A substitution
Supplemental Figure legends Figure S1. Map-based cloning and complementation testing for ZOP1. (A) ZOP1 was mapped to a ~273-kb interval on Chromosome 1. In the interval, a single-nucleotide G to A substitution
Supplemental Figure 1 HDA18 has an HDAC domain and therefore has concentration dependent and TSA inhibited histone deacetylase activity.
 Supplemental Figure 1 HDA18 has an HDAC domain and therefore has concentration dependent and TSA inhibited histone deacetylase activity. (A) Amino acid alignment of HDA5, HDA15 and HDA18. The blue line
Supplemental Data. LMO4 Controls the Balance between Excitatory. and Inhibitory Spinal V2 Interneurons
 Neuron, Volume 61 Supplemental Data LMO4 Controls the Balance between Excitatory and Inhibitory Spinal V2 Interneurons Kaumudi Joshi, Seunghee Lee, Bora Lee, Jae W. Lee, and Soo-Kyung Lee Supplemental
supplementary information
 DOI: 10.1038/ncb1862 Figure S1 Identification of SCAI as a Dia1 associating factor. (a) Identification of SCAI (Riken cdna 930041I02) as a Dia1-FH3 interacting protein. Mouse brain lysate was incubated
Jung-Nam Cho, Jee-Youn Ryu, Young-Min Jeong, Jihye Park, Ji-Joon Song, Richard M. Amasino, Bosl Noh, and Yoo-Sun Noh
 Developmental Cell, Volume 22 Supplemental Information Control of Seed Germination by Light-Induced Histone Arginine Demethylation Activity Jung-Nam Cho, Jee-Youn Ryu, Young-Min Jeong, Jihye Park, Ji-Joon
Supplementary Figure 1
 Supplementary Figure 1 PTEN promotes virus-induced expression of IFNB1 and its downstream genes. (a) Quantitative RT-PCR analysis of IFNB1 mrna (left) and ELISA of IFN-β (right) in HEK 293 cells (2 10
SUPPLEMENTARY INFORMATION
 DOI: 1.138/ncb37 a Supplementary Figure 1 Dapi EU γh2ax Overlay b Dapi NBS1-GFP Firbillarin Overlay c Pre-laser 2 min 5 min 1 min 2 min 3 min 4 min 5 min 6 min 7 min d Dapi GFP-MRE11 γh2ax Overlay Supplementary
Supplementary Figure 1. (A) Cell proliferative ability and (B) the invasiveness of
 Cell proliferative ability and (B) the invasiveness of") LEGEND FOR SUPPLEMENTARY FIGURES Supplementary Figure 1. (A) Cell proliferative ability and (B) the invasiveness of LLC-1, LLC-3, and LLC-5 cell line series were quantified by BrdU assay after 72 h of
LEGEND FOR SUPPLEMENTARY FIGURES Supplementary Figure 1. (A) Cell proliferative ability and (B) the invasiveness of LLC-1, LLC-3, and LLC-5 cell line series were quantified by BrdU assay after 72 h of
SUPPLEMENTARY INFORMATION
 Figure S1: Activation of the ATM pathway by I-PpoI. A. HEK293T cells were either untransfected, vector transfected, transfected with an I-PpoI expression vector, or subjected to 2Gy γ-irradiation. 24 hrs
Figure legends for supplement
 Figure legends for supplement Supplemental Figure 1 Characterization of purified and recombinant proteins Relevant fractions related the final stage of the purification protocol(bingham et al., 1998; Toba
Rer1 and calnexin regulate endoplasmic reticulum retention of a peripheral myelin protein 22 mutant that causes type 1A Charcot-Marie-Tooth disease
 Rer1 and calnexin regulate endoplasmic reticulum retention of a peripheral myelin protein mutant that causes type 1A Charcot-Marie-Tooth disease Taichi Hara, Yukiko Hashimoto, Tomoko Akuzawa, Rika Hirai,
Regulation of autophagic activity by ζ proteins associated with class III. phosphatidylinositol-3 kinase. Mercedes Pozuelo Rubio
 ONLINE SUPPORTING INFORMATION Regulation of autophagic activity by 14-3-3ζ proteins associated with class III phosphatidylinositol-3 kinase Mercedes Pozuelo Rubio entro Andaluz de Biología Molecular y
supplementary information
 DOI: 1.138/ncb1839 a b Control 1 2 3 Control 1 2 3 Fbw7 Smad3 1 2 3 4 1 2 3 4 c d IGF-1 IGF-1Rβ IGF-1Rβ-P Control / 1 2 3 4 Real-time RT-PCR Relative quantity (IGF-1/ mrna) 2 1 IGF-1 1 2 3 4 Control /
Supplementary Materials for
 www.sciencesignaling.org/cgi/content/full//59/ra7/dc1 Supplementary Materials for Dok-7 ctivates the Muscle Receptor Kinase MuSK and Shapes Synapse Formation kane Inoue, Kiyoko Setoguchi, Yosuke Matsubara,
Supplementary Fig. 1
 a FL (1-2266) NL (1-1190) CL (1191-2266) HA-ICE1: - HA-ICE1: - - - FLAG-ICE2: + + + + FLAG-ELL: + + + + + + IP: anti-ha FLAG-ICE2 HA-ICE1-FL HA-ICE1-NL HA-ICE1-CL FLAG-ICE2 b IP: anti-ha FL (1-2266) NL
Supplementary Figure 1. APP cleavage assay. HEK293 cells were transfected with various
 Supplementary Figure 1. APP cleavage assay. HEK293 cells were transfected with various GST-tagged N-terminal truncated APP fragments including GST-APP full-length (FL), APP (123-695), APP (189-695), or
Xu et al., Supplementary Figures 1-7
 Xu et al., Supplementary Figures 1-7 Supplementary Figure 1. PIPKI is required for ciliogenesis. (a) PIPKI localizes at the basal body of primary cilium. RPE-1 cells treated with two sirnas targeting to
Supplementary Figure 1. IFN-γ induces TRC dormancy. a, IFN-γ induced dormancy
 Supplementary Figure 1. IFN-γ induces TRC dormancy. a, IFN-γ induced dormancy of various tumor type TRCs, including H22 (murine hepatocarcinoma) and CT26 (murine colon cancer). Bar, 50 µm. b, B16 cells
Supplementary Information
 Supplementary Information stability is regulated by CK2-dependent interaction with R2TP complex Patrick von Morgen 1,2, Kamila Burdova 1, Thomas G. Flower 3, Nicola J. O'Reilly 4, Simon J. Boulton 5, Stephen
Supplementary Figure 1. Wnt10a mutation causes aberrant molar tooth development and formation of an ectopic M4 molar. (a,b) Smaller molar teeth with
 Smaller molar teeth with") Supplementary Figure 1. Wnt10a mutation causes aberrant molar tooth development and formation of an ectopic M4 molar. (a,b) Smaller molar teeth with blunted cusp formation, and presence of an ectopic molar
Supplementary Figure 1. Wnt10a mutation causes aberrant molar tooth development and formation of an ectopic M4 molar. (a,b) Smaller molar teeth with blunted cusp formation, and presence of an ectopic molar