SUPPLEMENTARY INFORMATION
|
|
|
- Cori Anthony
- 6 years ago
- Views:
Transcription
 Immunoprecipitation using HA antibody in cells expressing YFP vector or YFP-HP1α cotransfected with HA-NDR1. Note HA-NDR1 does not interact with YFP protein (detected by GFP immunoblot).")
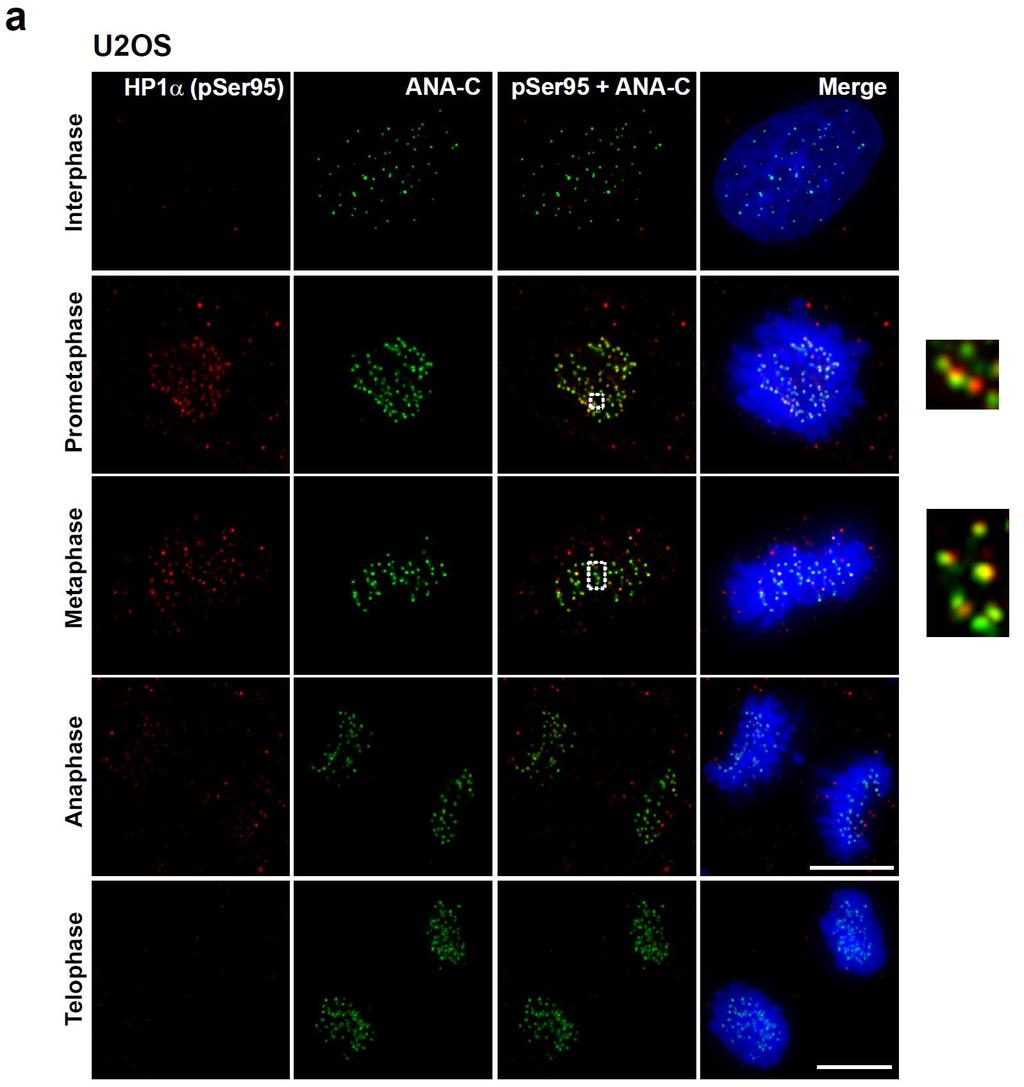
1 SUPPLEMENTARY INFORMATION Dynamic Phosphorylation of HP1 Regulates Mitotic Progression in Human Cells Supplementary Figures Supplementary Figure 1. NDR1 interacts with HP1. (a) Immunoprecipitation using HA antibody in cells expressing YFP vector or YFP-HP1α cotransfected with HA-NDR1. Note HA-NDR1 does not interact with YFP protein (detected by GFP immunoblot). (b) Immunoprecipitation using HA antibody in cells expressing HA-HP1 wild type or HA-HP1 -W174A with T7-NDR1. Note the interaction between T7-NDR1 and HA- HP1 -WT but not W174A mutant. (c) Contrast adjusted YFP-LacI-HP1 tethered cells. Note that in addition to the CLTon heterochromatic locus, HP1 signal is localized to heterochromatic regions within the nucleus. Scale bar represents 10 m. 1
2 Supplementary Figure 2. NDR kinase mediates the phosphorylation of HP1. (a) In vitro kinase assay using NDR1 kinase isolated using HA immunoprecipitation from HA-NDR1 expressing human HEK293 cells. GST or GST-HP1 WT or truncation mutants 1-66, , and were used as substrates. Note the robust phosphorylation of GST-HP1 containing the chromo (1-66) and the hinge domain (67-119). Coomassie stained gel is shown for the substrates. Eluate from un-transfected HEK293 cells containing nonspecifically HA-bound proteins was used for control kinase assay using GST-HP1 WT as a substrate; the signal obtained from this assay was used to normalize the signal obtained from wild type NDR1. (b). Phos-tag PAGE analysis of lysates expressing HA-NDR1 along with single point mutants in N-terminal region of HP1 (S11A; S12A; S13A; S14A); a combined N-terminal mutant (S11-14A); single point mutants in the hinge region (S92A; S93A; S95A; S97A); a combined 2
3 hinge mutant (S92,93,95,97A). (c) Phos-tag PAGE analysis of lysates expressing HA-NDR1 along with single point mutants in the hinge region (S92A; S93A; S95A; S97A) and the combination of all (hinge mutant). CIP represents lysates treated with calf intestinal phosphatase. (d) Phos-tag PAGE analysis of lysates from cells transfected with FLAG-HP1 and with (+) or without (-) HA-NDR1 kinase, cells were synchronized at mitosis using nocodazole. Quantitation of the relative levels of N-terminal and N- terminal+ hinge phosphorylation of HP1 is based on the immunoblot in d. 3
4 4
5 5
 Immunofluorescence localization of hinge-specific phosphorylation of HP1 using S95 phospho-ab (red) along with centromere marker ANA-C (green) in human U2OS cells.")
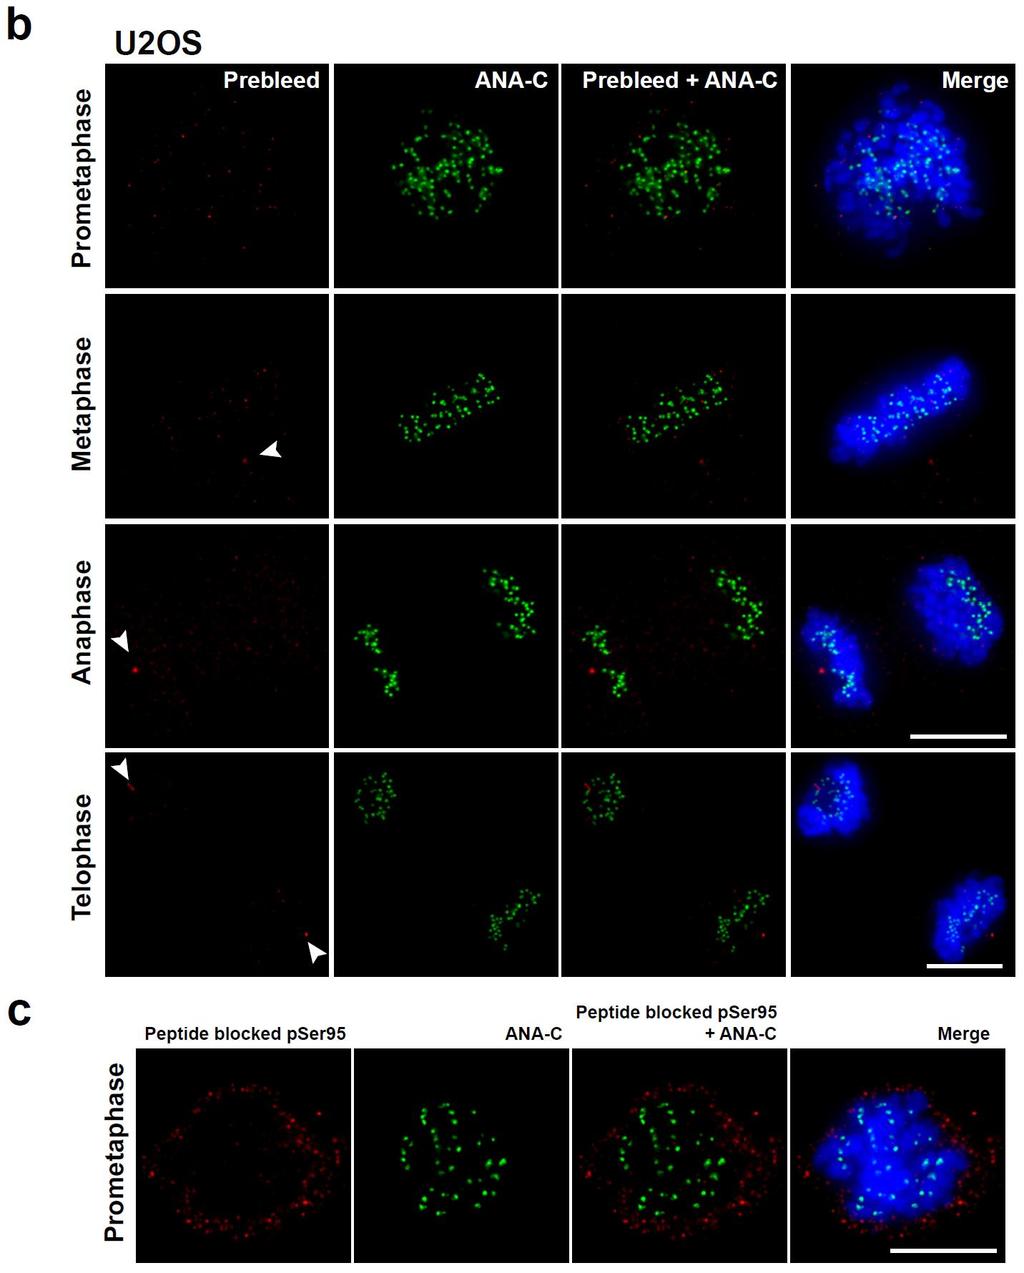
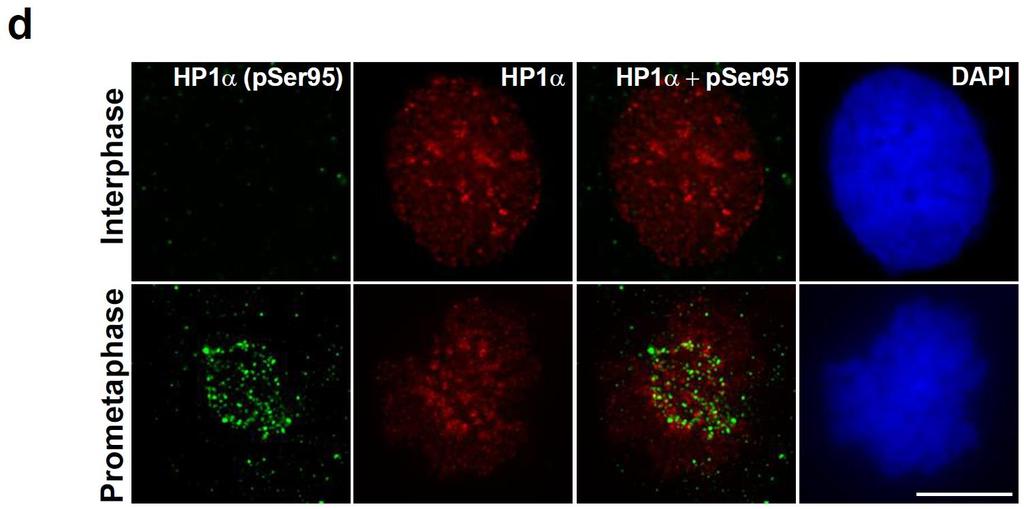
6 Supplementary Figure 3. Hinge-specific phosphorylated form of HP1 localizes at kinetochores during early mitosis. (a) Immunofluorescence localization of hinge-specific phosphorylation of HP1 using S95 phospho-ab (red) along with centromere marker ANA-C (green) in human U2OS cells. Note the association of phosphorylated form of HP1 in the vicinity of centromeres in prophase and metaphase. Inset (5X) shows that the red signals are exterior to green, suggesting the presence of this modified form of HP1 at outer kinetochores. Scale bar represents 10 m. (b) Immunofluorescence localization using preimmune sera (prebleed) and the centromeric ANA-C antibody in U2OS cells. Centrosomes (arrowhead) were non-specific staining. Scale bar represents 10 m. (c) Immunofluorescence using peptide-blocked pser95 antibody in HeLa cells. Note that the centromeric specific signal is lost. Scale bar represents 10 m. (d) Immunofluorescence localization of hinge-specific phosphorylation of HP1 using S95 phospho-ab (green) and HP1 antibody (red) in human HeLa cells. Scale bar represents 10 m. (e, f) Co-localization of S95 phospho-ab (red) and outer kinetochore marker Mad1 (green) in prometaphase and metaphase cells. Note the kinetochore association of the hingespecific phosphorylated form of HP1 is reduced as the cells progressed from prometaphase to metaphase. Arrowhead represents non-specific staining at centrosomes. Scale bar represents 10 m. 6
7 7

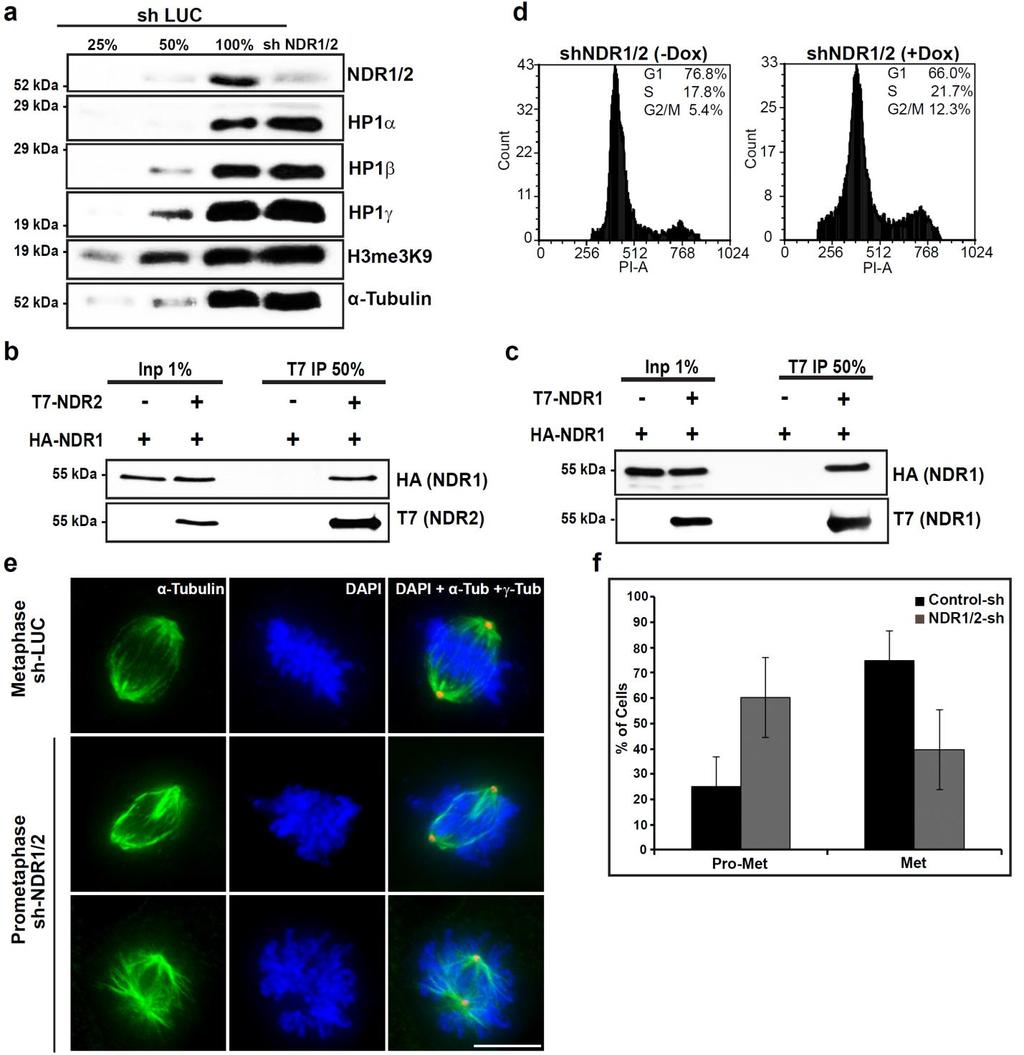
8 Supplementary Figure 4. Hinge-specific phosphorylation of HP1 is required for accurate chromosome alignment and mitotic progression. (a). Immunoblot analysis of NDR depleted cell lysates using shrna against both NDR1 and 2. Note that >75% knock-down of NDR was achieved without significant alteration of total cellular level of other HP1 isoforms. (b) Immunoprecipitation using T7 antibody in cells expressing T7-NDR2 and HA-NDR1. (c) Immunoprecipitation using T7 antibody in cells expressing T7-NDR1 and HA-NDR1. Note the interaction between NDR1 and NDR2. (d) Flow cytometry in shrna mediated NDR1/2 depleted cells demonstrated an increase in G2/M population. (e) Immunofluorescence analysis of NDR1/2 depleted cells revealed mitotic abnormalities. Scale bar represents 10 m. (f) An increase in prometaphase and a concomitant decrease in metaphase population were also associated with NDR1/2 depletion. Error bars represent SD of three independent experiments. (g) Immunofluorescence localization of hinge-specific phosphorylation of HP1 using S95 phospho-ab (red) along with centromere marker ANA-C (green) in human HeLa cells. Note the reduction of phosphorylated form of HP1 in the vicinity of centromeres in NDR1-depleted cells. Scale bar represents 10 m. 8
 Immunoblot analysis to demonstrate the efficiency of HP1 sirna (3 UTR-specific) treatment in cells expressing U2OS, YFP-HP1 -S95A and YFP-HP1 -S95E.")
9 Supplementary Figure 5. Hinge-specific phosphorylation of HP1 facilitates HP1 and Sgo1 binding to mitotic centromeres. (a) Immunoblot analysis to demonstrate the efficiency of HP1 sirna (3 UTR-specific) treatment in cells expressing U2OS, YFP-HP1 -S95A and YFP-HP1 -S95E. (b) Localization of YFP-HP1 -S95A phospho mutant and YFP-HP1 -S95E on mitotic chromosome in cells lacking endogenous HP1. Scale bar represents 10 m. (c) Immunoprecipitation experiments demonstrate that HP1 phosphorylation mutants YFP-HP1 -S95A and YFP-HP1 -S95E dimerize with WT-HP1. (d) Hinge-specific phosphorylation of HP1 facilitates Sgo1 binding to mitotic centromeres. Depletion of HP1 from U2OS or from cells stably expressing YFP-HP1 -S95A or YFP-HP1 -S95E followed by immunofluorescence using Sgo1 antibody. Quantification of Sgo1 present at mitotic centromeres. Note the increased binding of Sgo1 to centromeres in HP1 -depleted YFP-HP1 -S95E expressing cells. The bar graphs for control sirna are identical to the one depicted in Figure 6e control. The control-sirna, NDR1-siRNA and HP1 -sirna experiments (one group) were conducted at the same time. Error bars represent SD of three independent experiments. Statistical significance was determined by Student s t- test.. Mean ± SD, *p<0.05, **p<0.01 and ***p<

10 Supplementary Figure 6. Uncropped scans of the most important western blots. Boxes highlight the lanes used in panels. 10
Supplementary Materials
 Supplementary Materials Supplementary Figure 1. PKM2 interacts with MLC2 in cytokinesis. a, U87, U87/EGFRvIII, and HeLa cells in cytokinesis were immunostained with DAPI and an anti-pkm2 antibody. Thirty
Supplementary Figure 1. Localization of truncated Borealin co-transfected with Borealin shrna.
 Supplementary Figure 1. Localization of truncated Borealin co-transfected with Borealin shrna. HeLa M cells were transfected with empty psuper or a vector producing a shrna targetingg the 3 UTR (missing
SUPPLEMENTARY INFORMATION
 DOI: 10.1038/ncb3209 Supplementary Figure 1 IR induces the association of FH with chromatin. a, U2OS cells synchronized by thymidine double block (2 mm) underwent no release (G1 phase) or release for 2
Supporting Online Material for
 Supporting Online Material for Spatiotemporal dynamics of Aurora B-PLK1-MCAK signaling axis orchestrates kinetochore bi-orientation and faithful chromosome segregation Hengyi Shao, Yuejia Huang, Liangyu
Coleman et al., Supplementary Figure 1
 Coleman et al., Supplementary Figure 1 BrdU Merge G1 Early S Mid S Supplementary Figure 1. Sequential destruction of CRL4 Cdt2 targets during the G1/S transition. HCT116 cells were synchronized by sequential
Supplementary Table 1. The Q-PCR primer sequence is summarized in the following table.
 Supplementary Table 1. The Q-PCR primer sequence is summarized in the following table. Name Sequence (5-3 ) Application Flag-u ggactacaaggacgacgatgac Shared upstream primer for all the amplifications of
SUPPLEMENTARY INFORMATION
 DOI: 10.1038/ncb2271 Supplementary Figure a! WM266.4 mock WM266.4 #7 sirna WM266.4 #10 sirna SKMEL28 mock SKMEL28 #7 sirna SKMEL28 #10 sirna WM1361 mock WM1361 #7 sirna WM1361 #10 sirna 9 WM266. WM136
T H E J O U R N A L O F C E L L B I O L O G Y
 T H E J O U R N A L O F C E L L B I O L O G Y Supplemental material Han et al., http://www.jcb.org/cgi/content/full/jcb.201311007/dc1 Figure S1. SIVA1 interacts with PCNA. (A) HEK293T cells were transiently
Figure 1: TDP-43 is subject to lysine acetylation within the RNA-binding domain a) QBI-293 cells were transfected with TDP-43 in the presence or
 QBI-293 cells were transfected with TDP-43 in the presence or") Figure 1: TDP-43 is subject to lysine acetylation within the RNA-binding domain a) QBI-293 cells were transfected with TDP-43 in the presence or absence of the acetyltransferase CBP and acetylated TDP-43
Figure 1: TDP-43 is subject to lysine acetylation within the RNA-binding domain a) QBI-293 cells were transfected with TDP-43 in the presence or absence of the acetyltransferase CBP and acetylated TDP-43
Supplemental Information: Phosphorylation of CLIP-170 by Both Plk1 and CK2 Is Involved in the Timely Formation of Kinetochore-microtubule Attachments
 Supplemental Information: Phosphorylation of CLIP-170 by Both Plk1 and CK2 Is Involved in the Timely Formation of Kinetochore-microtubule Attachments Hongchang Li, X. Shawn Liu, Xiaoming Yang, Yingmin
Nature Structural & Molecular Biology: doi: /nsmb.1583
 Acetylation by GCN5 regulates CDC6 phosphorylation in the S-phase of the cell cycle Roberta Paolinelli 1,2, Ramiro Mendoza-Maldonado 2, Anna Cereseto 1 and Mauro Giacca 2 1 Molecular Biology Laboratory,
Supplementary Figure 1. Drawing of spinal cord open-book preparations and DiI tracing. Nature Neuroscience: doi: /nn.3893
 Supplementary Figure 1 Drawing of spinal cord open-book preparations and DiI tracing. Supplementary Figure 2 In ovo electroporation of dominant-negative PlexinA1 in commissural neurons induces midline
Phosphorylation of CLIP-170 by Plk1 and CK2 promotes timely formation of kinetochore microtubule attachments
 The EMBO Journal (2010) 29, 2953 2965 & 2010 European Molecular Biology Organization All Rights Reserved 0261-4189/10 www.embojournal.org Phosphorylation of CLIP-170 by Plk1 and CK2 promotes timely formation
Supplementary Fig. 1. Schematic structure of TRAIP and RAP80. The prey line below TRAIP indicates bait and the two lines above RAP80 highlight the
 Supplementary Fig. 1. Schematic structure of TRAIP and RAP80. The prey line below TRAIP indicates bait and the two lines above RAP80 highlight the prey clones identified in the yeast two hybrid screen.
SUPPLEMENTARY INFORMATION
 SUPPLEMENTARY INFORMATION Supplementary figures Supplementary Figure 1: Suv39h1, but not Suv39h2, promotes HP1α sumoylation in vivo. In vivo HP1α sumoylation assay. Top: experimental scheme. Middle: we
T H E J O U R N A L O F C E L L B I O L O G Y
 T H E J O U R N A L O F C E L L B I O L O G Y Supplemental material Nakajima and Tanoue, http://www.jcb.org/cgi/content/full/jcb.201104118/dc1 Figure S1. DLD-1 cells exhibit the characteristic morphology
Supplementary Fig. 1 Identification of Nedd4 as an IRS-2-associated protein in camp-treated FRTL-5 cells.
 Supplementary Fig. 1 Supplementary Fig. 1 Identification of Nedd4 as an IRS-2-associated protein in camp-treated FRTL-5 cells. (a) FRTL-5 cells were treated with 1 mm dibutyryl camp for 24 h, and the lysates
This is the author's accepted version of the manuscript.
 This is the author's accepted version of the manuscript. The definitive version is published in Nature Communications Online Edition: 2015/4/16 (Japan time), doi:10.1038/ncomms7780. The final version published
Primers used for PCR of conductin, SGK1 and GAPDH have been described in (Dehner et al,
 Supplementary METHODS Flow Cytometry (FACS) For FACS analysis, trypsinized cells were fixed in ethanol, rehydrated in PBS and treated with 40μg/ml propidium iodide and 10μ/ml RNase for 30 min at room temperature.
SUPPLEMENTARY INFORMATION
 doi:10.1038/nature09732 Supplementary Figure 1: Depletion of Fbw7 results in elevated Mcl-1 abundance. a, Total thymocytes from 8-wk-old Lck-Cre/Fbw7 +/fl (Control) or Lck-Cre/Fbw7 fl/fl (Fbw7 KO) mice
supplementary information
 DOI: 10.1038/ncb2116 Figure S1 CDK phosphorylation of EZH2 in cells. (a) Comparison of candidate CDK phosphorylation sites on EZH2 with known CDK substrates by multiple sequence alignments. (b) CDK1 and
(a) Immunoblotting to show the migration position of Flag-tagged MAVS
 Immunoblotting to show the migration position of Flag-tagged MAVS") Supplementary Figure 1 Characterization of six MAVS isoforms. (a) Immunoblotting to show the migration position of Flag-tagged MAVS isoforms. HEK293T Mavs -/- cells were transfected with constructs expressing
Supplementary Figure 1 Characterization of six MAVS isoforms. (a) Immunoblotting to show the migration position of Flag-tagged MAVS isoforms. HEK293T Mavs -/- cells were transfected with constructs expressing
Specific threonine-4 phosphorylation and function of RNA polymerase II CTD during M phase progression
 Supplementary Figures Specific threonine- phosphorylation and function of RNA polymerase II CTD during M phase progression Corinna Hintermair 1, Kirsten Voß 1, Ignasi Forné 2, Martin Heidemann 1, Andrew
The Human Protein PRR14 Tethers Heterochromatin to the Nuclear Lamina During Interphase and Mitotic Exit
 Cell Reports, Volume 5 Supplemental Information The Human Protein PRR14 Tethers Heterochromatin to the Nuclear Lamina During Interphase and Mitotic Exit Andrey Poleshko, Katelyn M. Mansfield, Caroline
Hossain_Supplemental Figure 1
 Hossain_Supplemental Figure 1 GFP-PACT GFP-PACT Motif I GFP-PACT Motif II A. MG132 (1µM) GFP Tubulin GFP-PACT Pericentrin GFP-PACT GFP-PACT Pericentrin Fig. S1. Expression and localization of Orc1 PACT
Stargazin regulates AMPA receptor trafficking through adaptor protein. complexes during long term depression
 Supplementary Information Stargazin regulates AMPA receptor trafficking through adaptor protein complexes during long term depression Shinji Matsuda, Wataru Kakegawa, Timotheus Budisantoso, Toshihiro Nomura,
GFP CCD2 GFP IP:GFP
 D1 D2 1 75 95 148 178 492 GFP CCD1 CCD2 CCD2 GFP D1 D2 GFP D1 D2 Beclin 1 IB:GFP IP:GFP Supplementary Figure 1: Mapping domains required for binding to HEK293T cells are transfected with EGFP-tagged mutant
Supplementary Figure S1. N-terminal fragments of LRRK1 bind to Grb2.
 Myc- HA-Grb2 Mr(K) 105 IP HA 75 25 105 1-1163 1-595 - + - + - + 1164-1989 Blot Myc HA total lysate 75 25 Myc HA Supplementary Figure S1. N-terminal fragments of bind to Grb2. COS7 cells were cotransfected
Supplementary Figure 1 Collision-induced dissociation (CID) mass spectra of peptides from PPK1, PPK2, PPK3 and PPK4 respectively.
 mass spectra of peptides from PPK1, PPK2, PPK3 and PPK4 respectively.") Supplementary Figure 1 lision-induced dissociation (CID) mass spectra of peptides from PPK1, PPK, PPK3 and PPK respectively. % of nuclei with signal / field a 5 c ppif3:gus pppk1:gus 0 35 30 5 0 15 10
Supplementary Figure 1 lision-induced dissociation (CID) mass spectra of peptides from PPK1, PPK, PPK3 and PPK respectively. % of nuclei with signal / field a 5 c ppif3:gus pppk1:gus 0 35 30 5 0 15 10
Supplementary Fig. 1. (A) Working model. The pluripotency transcription factor OCT4
 Working model. The pluripotency transcription factor OCT4") SUPPLEMENTARY FIGURE LEGENDS Supplementary Fig. 1. (A) Working model. The pluripotency transcription factor OCT4 directly up-regulates the expression of NIPP1 and CCNF that together inhibit protein phosphatase
SUPPLEMENTARY FIGURE LEGENDS Supplementary Fig. 1. (A) Working model. The pluripotency transcription factor OCT4 directly up-regulates the expression of NIPP1 and CCNF that together inhibit protein phosphatase
At E17.5, the embryos were rinsed in phosphate-buffered saline (PBS) and immersed in
 and immersed in") Supplementary Materials and Methods Barrier function assays At E17.5, the embryos were rinsed in phosphate-buffered saline (PBS) and immersed in acidic X-gal mix (100 mm phosphate buffer at ph4.3, 3 mm
Supplementary Materials and Methods Barrier function assays At E17.5, the embryos were rinsed in phosphate-buffered saline (PBS) and immersed in acidic X-gal mix (100 mm phosphate buffer at ph4.3, 3 mm
Xu et al., Supplementary Figures 1-7
 Xu et al., Supplementary Figures 1-7 Supplementary Figure 1. PIPKI is required for ciliogenesis. (a) PIPKI localizes at the basal body of primary cilium. RPE-1 cells treated with two sirnas targeting to
indicated numbers of pups at day of life (DOL) 10, or embryonic day (ED) B. Male mice of
 10, or embryonic day (ED) B. Male mice of") SUPPLEMENTRY FIGURE LEGENDS Figure S1. USP44 loss leads to chromosome missegregation.. Genotypes obtained from the indicated numbers of pups at day of life (DOL) 10, or embryonic day (ED) 13.5.. Male mice
SUPPLEMENTRY FIGURE LEGENDS Figure S1. USP44 loss leads to chromosome missegregation.. Genotypes obtained from the indicated numbers of pups at day of life (DOL) 10, or embryonic day (ED) 13.5.. Male mice
Supplementary Figure 1. Localization of MST1 in RPE cells. Proliferating or ciliated HA- MST1 expressing RPE cells (see Fig. 5b for establishment of
 Supplementary Figure 1. Localization of MST1 in RPE cells. Proliferating or ciliated HA- MST1 expressing RPE cells (see Fig. 5b for establishment of the cell line) were immunostained for HA, acetylated
T H E J O U R N A L O F C E L L B I O L O G Y
 T H E J O U R N A L O F C E L L B I O L O G Y Supplemental material Ricke et al., http://www.jcb.org/cgi/content/full/jcb.201205115/dc1 Figure S1. Kinetochore localization of mitotic regulators in wild-type
supplementary information
 DOI: 10.1038/ncb2172 Figure S1 p53 regulates cellular NADPH and lipid levels via inhibition of G6PD. (a) U2OS cells stably expressing p53 shrna or a control shrna were transfected with control sirna or
Supplementary Materials for
 www.sciencesignaling.org/cgi/content/full/9/429/ra54/dc1 Supplementary Materials for Dephosphorylation of the adaptor LAT and phospholipase C by SHP-1 inhibits natural killer cell cytotoxicity Omri Matalon,
Supplementary Figure 1. TRIM9 does not affect AP-1, NF-AT or ISRE activity. (a,b) At 24h post-transfection with TRIM9 or vector and indicated
 At 24h post-transfection with TRIM9 or vector and indicated") Supplementary Figure 1. TRIM9 does not affect AP-1, NF-AT or ISRE activity. (a,b) At 24h post-transfection with TRIM9 or vector and indicated reporter luciferase constructs, HEK293T cells were stimulated
Supplementary Figure 1. TRIM9 does not affect AP-1, NF-AT or ISRE activity. (a,b) At 24h post-transfection with TRIM9 or vector and indicated reporter luciferase constructs, HEK293T cells were stimulated
A RRM1 H2AX DAPI. RRM1 H2AX DAPI Merge. Cont. sirna RRM1
 A H2AX DAPI H2AX DAPI Merge Cont sirna Figure S1: Accumulation of RRM1 at DNA damage sites (A) HeLa cells were subjected to in situ detergent extraction without IR irradiation, and immunostained with the
seminal vesicle thymus kidney lung liver
 a 1 HEK293 1 B 3 3 T GFPSMAD TGFβ (T)/ BMP (B) IB: SMAD1/3TP IB: GFP b wild type mouse tissue kidney thymus seminal vesicle liver lung brain adipose tissue muscle pancreas heart uterus spleen testis IB:
Supplemental Material Igreja and Izaurralde 1. CUP promotes deadenylation and inhibits decapping of mrna targets. Catia Igreja and Elisa Izaurralde
 Supplemental Material Igreja and Izaurralde 1 CUP promotes deadenylation and inhibits decapping of mrna targets Catia Igreja and Elisa Izaurralde Supplemental Materials and methods Functional assays and
SUPPLEMENTARY INFORMATION
 (Supplementary Methods and Materials) GST pull-down assay GST-fusion proteins Fe65 365-533, and Fe65 538-700 were expressed in BL21 bacterial cells and purified with glutathione-agarose beads (Sigma).
T H E J O U R N A L O F C E L L B I O L O G Y
 T H E J O U R N A L O F C E L L B I O L O G Y Supplemental material Bays et al., http://www.jcb.org/cgi/content/full/jcb.201309092/dc1 Figure S1. Specificity of the phospho-y822 antibody. (A) Total cell
Supplemental Material
 Supplemental Material 1 Figure S1. Phylogenetic analysis of Cep72 and Lrrc36, comparative localization of Cep72 and Lrrc36 and Cep72 antibody characterization (A) Phylogenetic alignment of Cep72 and Lrrc36
JCB. Supplemental material THE JOURNAL OF CELL BIOLOGY. Kimura et al.,
 Supplemental material JCB Kimura et al., http://www.jcb.org/cgi/content/full/jcb.201503023/dc1 THE JOURNAL OF CELL BIOLOGY Figure S1. TRIMs regulate IFN-γ induced autophagy. (A and B) HC image analysis
Supplementary Information for. Regulation of Rev1 by the Fanconi Anemia Core Complex
 Supplementary Information for Regulation of Rev1 by the Fanconi Anemia Core Complex Hyungjin Kim, Kailin Yang, Donniphat Dejsuphong, Alan D. D Andrea* *Corresponding Author: Alan D. D Andrea, M.D. Alan_dandrea@dfci.harvard.edu
SUPPLEMENTARY INFORMATION
 DOI: 10.1038/ncb2743 Figure S1 stabilizes cellular protein level, post-transcriptionally. (a, b) and DDR1 were RNAi-depleted from HEK.293.-CBG cells. Western blots with indicated antibodies (a). RT-PCRs
Supplementary Figure 1 Phosphorylated tau accumulates in Nrf2 (-/-) mice. Hippocampal tissues obtained from Nrf2 (-/-) (10 months old, 4 male; 2
 mice. Hippocampal tissues obtained from Nrf2 (-/-) (10 months old, 4 male; 2") Supplementary Figure 1 Phosphorylated tau accumulates in Nrf2 (-/-) mice. Hippocampal tissues obtained from Nrf2 (-/-) (10 months old, 4 male; 2 female) or wild-type (5 months old, 1 male; 11 months old,
Supplementary Figure 1 Phosphorylated tau accumulates in Nrf2 (-/-) mice. Hippocampal tissues obtained from Nrf2 (-/-) (10 months old, 4 male; 2 female) or wild-type (5 months old, 1 male; 11 months old,
Supplementary Fig. S1. SAMHD1c has a more potent dntpase activity than. SAMHD1c. Purified recombinant SAMHD1c and SAMHD1c proteins (with
 Supplementary Fig. S1. SAMHD1c has a more potent dntpase activity than SAMHD1c. Purified recombinant SAMHD1c and SAMHD1c proteins (with concentration of 800nM) were incubated with 1mM dgtp for the indicated
Supplemental Information. Pacer Mediates the Function of Class III PI3K. and HOPS Complexes in Autophagosome. Maturation by Engaging Stx17
 Molecular Cell, Volume 65 Supplemental Information Pacer Mediates the Function of Class III PI3K and HOPS Complexes in Autophagosome Maturation by Engaging Stx17 Xiawei Cheng, Xiuling Ma, Xianming Ding,
Supplementary Figure 1. Related to Figure 1. Characterization of centrosome fragmentation in mitotically delayed RPE1 cells. (a) Cells transiently
 Cells transiently") Supplementary Figure 1. Related to Figure 1. Characterization of centrosome fragmentation in mitotically delayed RPE1 cells. (a) Cells transiently transfected with EGFP centrin-2 (Green), synchronized
Supplementary Figure 1. Related to Figure 1. Characterization of centrosome fragmentation in mitotically delayed RPE1 cells. (a) Cells transiently transfected with EGFP centrin-2 (Green), synchronized
Supplemental Materials and Methods
 Supplemental Materials and Methods Co-immunoprecipitation (Co-IP) assay Cells were lysed with NETN buffer (20 mm Tris-HCl, ph 8.0, 0 mm NaCl, 1 mm EDT, 0.5% Nonidet P-40) containing 50 mm β-glycerophosphate,
Supplementary Figure 1. α-synuclein is truncated in PD and LBD brains. Nature Structural & Molecular Biology: doi: /nsmb.
 Supplementary Figure 1 α-synuclein is truncated in PD and LBD brains. (a) Specificity of anti-n103 antibody. Anti-N103 antibody was coated on an ELISA plate and different concentrations of full-length
J. Cell Sci. 128: doi: /jcs : Supplementary Material. Supplemental Figures. Journal of Cell Science Supplementary Material
 Supplemental Figures Figure S1. Trio controls endothelial barrier function. (A) TagRFP-shTrio constructs were expressed in ECs. Western blot shows efficient Trio knockdown in TagRFP-expressing ECs. (B)
Flag-Rac Vector V12 V12 N17 C40. Vector C40 pakt (T308) Akt1. Myc-DN-PAK1 (N-SP)
 Akt1. Myc-DN-PAK1 (N-SP)") a b FlagRac FlagRac V2 V2 N7 C4 V2 V2 N7 C4 p (T38) p (S99, S24) p Flag (Rac) NIH 3T3 COS c +Serum p (T38) MycDN (NSP) Mycp27 3 6 2 3 6 2 3 6 2 min p Myc ( or p27) Figure S (a) Effects of Rac mutants on
a b FlagRac FlagRac V2 V2 N7 C4 V2 V2 N7 C4 p (T38) p (S99, S24) p Flag (Rac) NIH 3T3 COS c +Serum p (T38) MycDN (NSP) Mycp27 3 6 2 3 6 2 3 6 2 min p Myc ( or p27) Figure S (a) Effects of Rac mutants on
 DOI: 10.1038/ncb3259 A Ismail et al. Supplementary Figure 1 B 60000 45000 SSC 30000 15000 Live cells 0 0 15000 30000 45000 60000 FSC- PARR 60000 45000 PARR Width 30000 FSC- 15000 Single cells 0 0 15000
SUPPLEMENTARY INFORMATION
 DOI: 10.1038/ncb3562 In the format provided by the authors and unedited. Supplementary Figure 1 Glucose deficiency induced FH-ATF2 interaction. In b-m, immunoblotting or immunoprecipitation analyses were
SUPPLEMENTARY INFORMATION
 DOI: 10.1038/ncb3363 Supplementary Figure 1 Several WNTs bind to the extracellular domains of PKD1. (a) HEK293T cells were co-transfected with indicated plasmids. Flag-tagged proteins were immunoprecipiated
Supplementary Figure 1
 Supplementary Figure 1 PTEN promotes virus-induced expression of IFNB1 and its downstream genes. (a) Quantitative RT-PCR analysis of IFNB1 mrna (left) and ELISA of IFN-β (right) in HEK 293 cells (2 10
SUPPLEMENTARY INFORMATION
 Figure S1 The effect of T198A mutation on p27 stability. a, Hoechst 33342 staining for nuclei (see Fig 1d). Scale bar, 100 μm. b, Densitometric analysis of wild type and mutant p27 protein levels represented
Supplemental Figure 1 Human REEP family of proteins can be divided into two distinct subfamilies. Residues (single letter amino acid code) identical
 identical") Supplemental Figure Human REEP family of proteins can be divided into two distinct subfamilies. Residues (single letter amino acid code) identical in all six REEPs are highlighted in green. Additional
Supplemental Figure Human REEP family of proteins can be divided into two distinct subfamilies. Residues (single letter amino acid code) identical in all six REEPs are highlighted in green. Additional
JCB. Supplemental material THE JOURNAL OF CELL BIOLOGY. Hong et al.,
 Supplemental material JCB Hong et al., http://www.jcb.org/cgi/content/full/jcb.201412127/dc1 THE JOURNAL OF CELL BIOLOGY Figure S1. Analysis of purified proteins by SDS-PAGE and pull-down assays. (A) Coomassie-stained
Supplemental Figure Legends:
 Supplemental Figure Legends: Fig S1. GFP-ABRO1 localization. U2OS cells were infected with retrovirus expressing GFP- ABRO1. The cells were fixed with 3.6% formaldehyde and stained with antibodies against
Supplementary Figure 1. Nature Structural & Molecular Biology: doi: /nsmb.3494
 Supplementary Figure 1 Pol structure-function analysis (a) Inactivating polymerase and helicase mutations do not alter the stability of Pol. Flag epitopes were introduced using CRISPR/Cas9 gene targeting
SUPPLEMENTARY INFORMATION
 Figure S1: Activation of the ATM pathway by I-PpoI. A. HEK293T cells were either untransfected, vector transfected, transfected with an I-PpoI expression vector, or subjected to 2Gy γ-irradiation. 24 hrs
Nature Structural & Molecular Biology: doi: /nsmb Supplementary Figure 1
 Supplementary Figure 1 Detection of MCM-subunit SUMOylation under normal growth conditions. a. Sumoylated forms of MCM subunits show differential shifts when SUMO is attached to differently sized tags.
SUPPLEMENTARY INFORMATION
 DOI: 10.1038/ncb3230 a GM13267(ZW) WCE C N M H 2 O 2 : p(s1981) 2 2 LDH Lamin A/C β-integrin c b d AT Flag- WT Flag- RQ H 2 O 2 IgG p (S1981) p (S1981) 2 IP: Flag N.S. 2 e f A: Untreated AT5 cells B: AT5
Figure S1. USP-46 is expressed in several tissues including the nervous system
 Supplemental Figure legends Figure S1. USP-46 is expressed in several tissues including the nervous system Transgenic animals expressing a transcriptional reporter (P::GFP) were imaged using epifluorescence
Supplementary Figure 1 PARP1 is involved in regulating the stability of mrnas from pro-inflammatory cytokine/chemokine mediators.
 Supplementary Figure 1 PARP1 is involved in regulating the stability of mrnas from pro-inflammatory cytokine/chemokine mediators. (a) A graphic depiction of the approach to determining the stability of
Sarker et al. Supplementary Material. Subcellular Fractionation
 Supplementary Material Subcellular Fractionation Transfected 293T cells were harvested with phosphate buffered saline (PBS) and centrifuged at 2000 rpm (500g) for 3 min. The pellet was washed, re-centrifuged
THE JOURNAL OF CELL BIOLOGY
 Supplemental Material THE JOURNAL OF CELL BIOLOGY Toso et al., http://www.jcb.org/cgi/content/full/jcb.200809055/dc1 Figure S1. Control experiments for sirna depletions used in Figs. 1 3. The phenotype
SUPPLEMENTARY INFORMATION FIGURE LEGENDS
 SUPPLEMENTARY INFORMATION FIGURE LEGENDS Fig. S1. Radiation-induced phosphorylation of Rad50 at a specific site. A. Rad50 is an in vitro substrate for ATM. A series of Rad50-GSTs covering the entire molecule
T H E J O U R N A L O F C E L L B I O L O G Y
 Supplemental material Thompson et al., http://www.jcb.org/cgi/content/full/jcb.200909067/dc1 T H E J O U R N A L O F C E L L B I O L O G Y Figure S1. Modification-specific antibodies do not detect unmodified
Nanog-Luc. R-Luc. 40 HA-Klf Relative protein level of Klf USP21. Vector USP2 USP21 *** *** *** ***
 :Flag Relative protein level of Relative protein level of : Flag Vec 21LV 21SV 2 : HA HA- HA- HA- HA-Klf4 Relative mrna expression Relative protein level of Relative protein level of Relative protein level
Supplementary Figure 1. The Hsp70 acetylation level is related to the co-chaperone binding of Hsp70 under various stress conditions.
 Supplementary Figure 1. The Hsp70 acetylation level is related to the co-chaperone binding of Hsp70 under various stress conditions. 1 (a) Etoposide treatment gradually changes acetylation level and co-chaperone
Regulation of transcription by the MLL2 complex and MLL complex-associated AKAP95
 Supplementary Information Regulation of transcription by the complex and MLL complex-associated Hao Jiang, Xiangdong Lu, Miho Shimada, Yali Dou, Zhanyun Tang, and Robert G. Roeder Input HeLa NE IP lot:
supplementary information
 DOI: 10.1038/ncb1816 A Gal4 Gal4 B Kinase domain C (1502) N (5111191) Interaction with SIAH1 C SIAH1 SIAH1 C (182) SIAH1 N (82282) RING domain Interaction with Input GST GSTSIAH1 1a a N C Input GST GSTSIAH1
Supplementary Figure 1. APP cleavage assay. HEK293 cells were transfected with various
 Supplementary Figure 1. APP cleavage assay. HEK293 cells were transfected with various GST-tagged N-terminal truncated APP fragments including GST-APP full-length (FL), APP (123-695), APP (189-695), or
Supplementary material for: Materials and Methods:
 Supplementary material for: Iron-responsive degradation of iron regulatory protein 1 does not require the Fe-S cluster: S.L. Clarke, et al. Materials and Methods: Fe-S Cluster Reconstitution: Cells treated
SUPPLEMENTARY INFORMATION
 DOI: 10.1038/ncb2386 Figure 1 Src-containing puncta are not focal adhesions, podosomes or endosomes. (a) FAK-/- were stained with anti-py416 Src (green) and either (in red) the focal adhesion protein paxillin,
Supplemental Information. Plk1/Polo Phosphorylates Sas-4 at the Onset. of Mitosis for an Efficient Recruitment
 Cell Reports, Volume 25 Supplemental Information Plk1/Polo Phosphorylates Sas-4 at the Onset of Mitosis for an Efficient Recruitment of Pericentriolar Material to Centrosomes Anand Ramani, Aruljothi Mariappan,
Supplementary methods Shoc2 In Vitro Ubiquitination Assay
 Supplementary methods Shoc2 In Vitro Ubiquitination Assay 35 S-labelled Shoc2 was prepared using a TNT quick Coupled transcription/ translation System (Promega) as recommended by manufacturer. For the
Supplemental Fig. 1: PEA-15 knockdown efficiency assessed by immunohistochemistry and qpcr
 Supplemental figure legends Supplemental Fig. 1: PEA-15 knockdown efficiency assessed by immunohistochemistry and qpcr A, LβT2 cells were transfected with either scrambled or PEA-15 sirna. Cells were then
b alternative classical none
 Supplementary Figure. 1: Related to Figure.1 a d e b alternative classical none NIK P-IkBa Total IkBa Tubulin P52 (Lighter) P52 (Darker) RelB (Lighter) RelB (Darker) HDAC1 Control-Sh RelB-Sh NF-kB2-Sh
Supplementary information
 Supplementary information The E3 ligase RNF8 regulates KU80 removal and NHEJ repair Lin Feng 1, Junjie Chen 1 1 Department of Experimental Radiation Oncology, The University of Texas M. D. Anderson Cancer
supplementary information
 DOI: 10.1038/ncb1864 Figure S1 Apak specifically inhibits p53 transcriptional activity. Transcription activity of p53 was measured in U2OS (p53 wild-type) and H1299 (p53 deficient) cells which were transfected
SUPPLEMENTARY INFORMATION
 DOI: 10.1038/ncb3240 Supplementary Figure 1 GBM cell lines display similar levels of p100 to p52 processing but respond differentially to TWEAK-induced TERT expression according to TERT promoter mutation
The Bub1 Plk1 kinase complex promotes spindle checkpoint signalling through Cdc20 phosphorylation
 Received 1 Jul 15 Accepted 25 Jan 16 Published 25 Feb 16 The kinase complex promotes spindle checkpoint signalling through phosphorylation Luying Jia 1, Bing Li 1 & Hongtao Yu 1 DOI: 1.138/ncomms1818 OPEN
Supplementary Figure 1. GST pull-down analysis of the interaction of GST-cIAP1 (A, B), GSTcIAP1
, GSTcIAP1") Legends Supplementary Figure 1. GST pull-down analysis of the interaction of GST- (A, B), GST mutants (B) or GST- (C) with indicated proteins. A, B, Cell lysate from untransfected HeLa cells were loaded
Legends Supplementary Figure 1. GST pull-down analysis of the interaction of GST- (A, B), GST mutants (B) or GST- (C) with indicated proteins. A, B, Cell lysate from untransfected HeLa cells were loaded
SUPPLEMENTARY INFORMATION
 Supplementary Figure 1 sirna and shrna mediated depletion of ATP7A results in loss of melanosomal ATP7A staining. a-h, sirna mediated ATP7A depletion. Immunofluorescence microscopy (IFM) analysis of ATP7A
SUPPLEMENTARY INFORMATION
 DOI:.38/ncb327 a b Sequence coverage (%) 4 3 2 IP: -GFP isoform IP: GFP IP: -GFP IP: GFP Sequence coverage (%) 4 3 2 IP: -GFP IP: GFP 33 52 58 isoform 2 33 49 47 IP: Control IP: Peptide Sequence Start
Supplementary Information
 Supplementary Information Peroxiredoxin-2 and STAT3 form a redox relay for H 2 O 2 signaling Mirko C. Sobotta 1, Willy Liou 1, Sarah Stöcker 1, Deepti Talwar 1, Michael Oehler 1, Thomas Ruppert 2, Annette
Supplementary information. Supplementary Figures
 Supplementary information Supplementary Figures Supplementary Figure 1. A. i. HA-JMY expressing U2OS cells were treated with SAHA (6h). DAPI was used to visualise nuclei. ii. U2OS cells stably expressing
Supplemental Figure 1 HDA18 has an HDAC domain and therefore has concentration dependent and TSA inhibited histone deacetylase activity.
 Supplemental Figure 1 HDA18 has an HDAC domain and therefore has concentration dependent and TSA inhibited histone deacetylase activity. (A) Amino acid alignment of HDA5, HDA15 and HDA18. The blue line
Supplementary Figure 1, related to Figure 1. GAS5 is highly expressed in the cytoplasm of hescs, and positively correlates with pluripotency.
 Supplementary Figure 1, related to Figure 1. GAS5 is highly expressed in the cytoplasm of hescs, and positively correlates with pluripotency. (a) Transfection of different concentration of GAS5-overexpressing
Nature Immunology: doi: /ni Supplementary Figure 1. Control experiments for Figure 1.
 Supplementary Figure 1 Control experiments for Figure 1. (a) Localization of SETX in untreated or PR8ΔNS1 virus infected A549 cells (4hours). Nuclear (DAPI) and Tubulin staining are shown. SETX antibody
SUPPLEMENTARY INFORMATION
 SUPPLEMENTARY INFORMATION Supplementary Figure 1 Effect of ROCK inhibition on lumen abnormality in MDCK cysts. (A) MDCK cells as indicated cultured in Matrigel were treated with and without Y27632 (10
SUPPLEMENTARY INFORMATION. Prolyl isomerase Pin1 and protein kinase HIPK2 cooperate to promote
 SUPPLEMENTARY INFORMATION Prolyl isomerase Pin1 and protein kinase HIPK2 cooperate to promote cortical neurogenesis by suppressing Groucho/TLE:Hes1-mediated inhibition of neuronal differentiation Running
Thanasoula et al. - Fig. S1
 S HK1si G1 Thanasoula et al. - Fig. S1 G2/M HK2si 1 3 5 7 9 11 13 hours after double thymidine block release Figure S1. U2OS synchronous cell cycle progression. U2OS cells transfected with, POT1, HK1,
Supplementary Materials for
 www.sciencesignaling.org/cgi/content/full/8/404/ra120/dc1 Supplementary Materials for The subcellular localization and activity of cortactin is regulated by acetylation and interaction with Keap1 Akihiro