Online Supporting Material for. The Bisecting GlcNAc on N-Glycans Inhibits Growth. Factor Signaling and Retards Mammary Tumor
|
|
|
- Logan Wilkins
- 5 years ago
- Views:
Transcription
1 Online Supporting Material for The Bisecting GlcNAc on N-Glycans Inhibits Growth Factor Signaling and Retards Mammary Tumor Progression Yinghui Song 1, Jason A. Aglipay 1, Joshua D. Bernstein 2, Sumanta Goswami 2 and Pamela Stanley 1, 3 1 Department of Cell Biology, Albert Einstein College of Medicine of Yeshiva University, Bronx, NY, 10461; 2 Dept. Biology, Yeshiva University, New York, NY, Corresponding author Supplemental Materials Mouse mab anti-pymt (PAb 762) was from Steven Dilworth (Imperial College; 1:1,000), rat anti-mouse PDGFR- mab (APA5; BD Pharmingen; 0.5 mg/ml), rat antikeratin-8 Ab (Troma-I; 1: 1000), goat anti-vimentin Ab (Santa Cruz; 1: 500), rabbit anti-pdgfr- Ab (C-terminal) (Santa Cruz; 1:300), Alexa Fluor 647 goat-anti-rat IgG (H+L) (Invitrogen; 1: 300). Primers for RT-PCR are in Table S1. Supplemental Methods Flow cytometry. Cells were grown in monolayer to ~75-80% confluence. After serum starvation for 24 h, cells were harvested and incubated with FACS binding 1
2 buffer [FBB; HBSS (0.4 g/l KCl, 0.06 g/l K 2 HPO 4, 8 g/l NaCl, g/l Na 2 HPO 4, 1 g/l D-glucose (ph7.4), 2% BSA, 0.05% azide] at 4 C for 1 h with gentle agitation. FBB (300 μl) containing 0.7 μl PDGFR- (APA5) was added to 10 6 cells, and incubated for 45 min with gentle agitation at 4 C. After two washes with 1 ml FBB, 250 μl FBB containing Alexa Fluor 647 goat-anti-rat IgG (H+L) was added. After 45 min with gentle agitation at 4 C, cells were washed twice with 1 ml FBB and resuspended in 300 μl FBB. Flow cytometry was performed on a FACSScan (Becton Dickinson) and data analyzed using Cell Quest software (Becton Dickinson). Fluorescence data were collected using logarithmic amplification on 10,000 light scatter-gated cells (cell counts). Negative controls were cells incubated with secondary antibody alone. Whole mount analysis. The fourth abdominal mammary gland was surgically dissected, stretched onto a glass slide and fixed in 10% formalin overnight at room temperature. After washing in 70% ethanol for 15 min, the slides were rinsed with gently running tap water and distiled water for 5 min each, and stained overnight in an alum carmine solution (0.2% w/v carmine and 0.5% w/v aluminium potassium phosphate; Sigma). Whole mounts were dehydrated through a graded series of ethanol solutions, de-lipidified in toluene, mounted in Permount (Thermo Fisher Scientific) and photographed. Lesion areas in the images were measured using ImageJ software (National Institutes of Health). Cell proliferation assay. For CHO/PyMT cells grown in suspension, cultures were initiated in triplicate at cells per ml containing 6, 8 or 10 μm MEK1/2 inhibitor U0126 (diluted from 10 mm stock) in 10 ml + -MEM with 7.5% FBS; DMSO at the same final concenration was added to controls. An aliquot was counted every 24 h for 5 days and the inhibitor was replenished on the third day. For tumor epithelial cells grown in monolayer, cultures were initiated in triplicate in a 6-well plate at cells per well containing 0, 5 or 10 μm MEK1/2 inhibitor (U0126) in 3 ml + -MEM with 7.5% heat-inactivated FBS, 3 μl DMSO was added to controls. Cells were counted from triplicate wells every 24 h for 5 days and the inhibitor was replenished on the third day. 2
3 Growth factor signaling assay. Cells 85-90% confluent in 60 mm dishes were serum-starved for 24 h. For MEK1/2 inhibitor treatments after starvation, 10 μm U0126 or DMSO equivalent in 1.5 ml + -MEM was added for 2 h at 37 C, cells were washed twice with + -MEM and treated with 50 ng/ml human PDGF-AB or EGF at 50 ng/ml at 37 C at the indicated time points. After stimulation, cells were collected and Western blot analyses were performed as described in the manuscript Methods. Western and lectin blot analysis. TEC cells were subjected to western blot analysis with anti-pymt Ab and anti- -actin and lectin blot analysis with biotinylated-e-pha as described in the manuscript Methods. Supplemental Results Flow cytometry using anti-pdgfr- extracellular domain showed that the different CHO/PyMT cell lines expressed similar cell surface levels of PDGFR- (Fig. S1). Therefore differences observed in signaling induced by PDGF were not due to differences in PDGFR cell surface levels. In Fig. S2 the effects of the MEK1/2 inhibitor U0126 on signaling and cell proliferation were investigated. U0126 caused not only reduced Erk1/2 phosphorylation but also reduced proliferation of CHO and LEC10B cells, thereby functionally correlating MAP kinase signaling to cell proliferation. The ~40%-50% decrease in signaling (Fig. S2B) caused by 10 μm U0126 resulted in a significant decrease in cell growth (Fig. S2A). LEC10B/PyMT cells were more inhibited by UO126 than CHO cells at all concentrations. Fig. S3 shows that primary tumor lesions at 5 weeks were generally larger in Mgat3 -/- /PyMT mammary glands than in littermate controls. Fig. S4 shows the characterization of independent TEC lines derived from MMTV/PyMT mammary tumors. Primers used for RT-PCR are given in Table S1. All TEC lines expressed PyMT RNA (Fig. S4A) and protein and were keratin 8-positive and vimentin-negative based on western blot analyses (not shown). Mgat3 +/- /PyMT lines expressed Mgat3 RNA (Fig. S4A) and possessed glycoproteins that bound E- PHA much better than those lacking Mgat3 (Fig. S4B). Signaling stimulated by 50 3
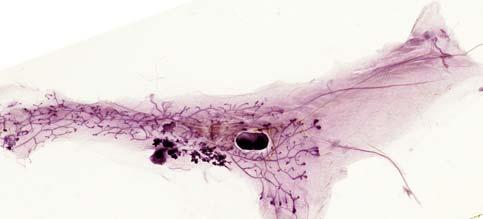
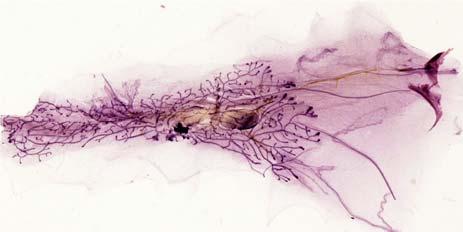
4 ng/ml EGF or 10% serum (Fig. S4C) was enhanced in both the Mgat3 -/- /PyMT lines. In Fig. S5, TECs derived from mammary tumors were compared for EGFstimulated signaling and cell proliferation in the presence and absence of the inhibitor UO126. The Mgat3 +/- /PyMT tumor cells exhibited less signaling in response to EGF than Mgat3 -/- /PyMT tumor cells and signaling in both lines was inhibited by UO126 (Fig. S5A). Fig. S5B shows that Mgat3 -/- /PyMT tumor cells proliferated faster than Mgat3 +/- /PyMT tumor cells, and that proliferation was inhibited by U0126. Interestingly, mammary TECs were more sensitive to the MEK1/2 inhibitor than CHO cell for inhibition of both signaling and cell proliferation. Supplemental Figure Legends Fig. S1. PDGF receptors of CHO cells. Binding of anti-pdgfr- mab APA5 to CHO-PyMT cells was assessed by flow cytometry. The gray profile indicates background fluroscence in the presence of secondary antibody alone; the colored profiles indicate data from APA5 (blue, CHO/PyMT; green, Lec4/PyMT; orange, Lec8/PyMT; turquoise, LEC10B/PyMT). Fig. S2. U0126 inhibits signaling and proliferation of CHO/PyMT cells. A, growth curves of CHO/PyMT and LEC10B/PyMT cells with 6 μm (left panel); 8 μm (middle panel) or 10 μm (right panel) U0126 in medium containing 7.5% serum. Bars STDEV; LEC10B/PyMT cells grew more slowly than CHO/PyMT (p<0.001 in a two-tailed Student t test for all comparisons at days 4 and 5. B, Ratios of perk-1/2/erk-1/2 at 0, 5 and 10 min of CHO/PyMT and LEC10B/PyMT cells treated with 50 ng/ml PDGF-AB in the presence or absence of 10 μm MEK1/2 inhibitor U0126. Fig. S3. Increased tumor lesions in Mgat3 -/- /PyMT mammary glands. A, representative whole-mount preparations of mammary glands from a littermate pair of Mgat3 +/- /PyMT (Control) and Mgat3 -/- /PyMT (Mutant) 5 week females. Photographs of the entire fourth abdominal mammary gland whole mount were taken at the same distance. Tumor lesions (circled) were measured using NIH Image J. B, fourth 4
5 mammary glands from another littermate pair of a control and mutant female at 5 weeks. Fig. S4. Properties of mammary TECs. A, RT-PCR of total RNA from control Mgat3 +/- /PyMT lines b and c and mutant Mgat3 -/- /PyMT lines a1 and b1; B, E-PHA lectin blot analysis; C, Erk-1 activation after stimulation with EGF (50 ng/ml) for 0, 7.5 or 15 minutes following serum starvation for 24h (top) and Erk-1 activation after stimulation with 10% serum after 24h in 1% serum (bottom). Fig. S5. U0126 inhibits signaling and proliferation of mammary TECs. A, perk- 1/2 and Erk-1/2/ signals at 0, 5 and 10 min after stimulation of Mgat3 +/- /PyMT and Mgat3 -/- /PyMT TECs with 50 ng/ml EGF in the presence or absence of 10 μm UO126. B, growth curves of Mgat3 +/- /PyMT and Mgat3 -/- /PyMT TECs with 5 μm (left panel) and 10 μm (right panel) U0126 in medium containing 7.5% heat-inactivated FBS. Bars STDEV; p<0.01 in a two-tailed Student t test comparing Mgat3 +/- /PyMT and Mgat3 -/- /PyMT at days 2, 3, 4 and 5 in medium alone. 5
6 Table S1. Primers used for RT-PCR Forward Primer Reverse Primer PyMT ggaagcaagtacttcacaaggg ggaaagtcactaggagcaggg Mgat3 gcactaggcgcaagtgggttgag gtagatgccctcgggtgtgaag Mgat5 catcggccggccacacgt tctttgcagagggccacttgg -actin tggccttagggttcaggggg gtgggccgctctaggcacca cdna was generated as described in the main text and 2 μl was amplified for 35 cycles. 6
7 % of Max FL4-H: APC PDGFR Fig. S1

8 A Cell number (x100/ml) CHO 0 CHO 6 LEC10B 0 LEC10B 6 Cell number (x100/ml) CHO 0 CHO 8 LEC10B 0 LEC10B 8 Cell number (x100/ml) CHO 0 CHO 10 LEC10B 0 LEC10B 10 Days Days Days B CHO LEC10B CHO LEC10B perk-1/erk-1 ratio perk-2/erk-2 ratio UO μm UO μm Fig. S2


9 A Control/PyMT B Control/PyMT Mgat3 -/- /PyMT Mgat3 -/- /PyMT Fig. S3

10

11 A B Cell number (x100/ml) UO126 (10 μm) Mgat3 +/- 0 Mgat3 +/- 5 Mgat3 -/- 0 Mgat3 -/- 5 Mgat3 +/- /PyMT Mgat3 +/- /PyMT Cell number (x100/ml) Mgat3 -/- /PyMT Min Mgat3 -/- /PyMT perk-1 perk-2 Erk-1 Erk-2 Min perk-1 perk-2 Erk-1 Erk-2 Mgat3 +/- 0 Mgat3 +/- 10 Mgat3 -/- 0 Mgat3 -/- 10 Days Days Fig. S5